#NIFTY Intraday Support and Resistance Levels - 12/01/2026A flat opening is expected in Nifty 50, with the index currently trading near the 25,700 zone after a sharp corrective move in the previous sessions. The overall structure remains weak, but some short-term stabilization and minor pullback attempts are visible near intraday support levels. Market participants should remain cautious and focus strictly on level-based trades.
On the upside, the 25,750–25,800 zone is a crucial support-cum-reversal area. If Nifty manages to hold and show strength above this zone, a reversal long can be considered with upside targets at 25,850, 25,900, and 25,950+. A sustained move above 25,950 would indicate short-covering and may lead to further recovery.
On the downside, failure to hold 25,700 will keep selling pressure intact. A break below 25,700 may trigger fresh shorts with targets at 25,650, 25,550, and 25,500-. Additionally, any pullback toward 25,950–25,900 that shows rejection can be used for short positions, targeting 25,850, 25,800, and 25,750. Until a clear directional breakout occurs, traders are advised to trade with strict stop-losses and avoid overexposure in a volatile environment.
Chart Patterns

Nifty View For 12-01-2026Dear Trader,
Overall view is bearish,
Opening GUP : Slightly move up, then down move expected
Opening GDOWN : Slip down
Opening GDOWN : More aggressively down
Resistance : 25835 & 25920
Support : 25662, 25520, 25464, 25339

09 Jan 2026 - The Reversal we didn't see coming 'NiftyNifty Stance Bearish 🐻
We began this week with a positively looking market, with just one way to go - UP. The options premiums also indicated that, so did all the technical indicators. None of us knew that the news of 500% tariff could play the spoilsport. The impact - a 670-point fall.
The EMA crossover came only on wednesday and after the short signal, we are down close to 455pts. The blue and orange lines are only diverging and there has been no attempt to pull back.
What I see is that it's just an overreaction to the rumors of tariffs. Once we get some clarity, the markets could bounce back. Meanwhile, this would be an ideal time for the central government to rethink the Long Term Capital Gains (LTCG) Taxes and the Securities Transaction Taxes (STTs). Restoring indexation benefits for Debt Instruments would also provide some relief.
Reducing the taxes would definitely boost the markets and could create a fresh inflow of capital.
A lower taxation slab on a bigger market cap is much better than a higher taxation on a lower Mcap - Hope the decision makers take this into account and pave the way for growth momentum.
The GST cuts and Increased income tax slabs are the steps in the right direction, but to give it wings, more capital has to flow into the market. If fresh capital does not flow in, our economy will stall. A stalling economy would nudge SIP investors to stop pouring money in (just as happened from February to May 2025).

TITAN Inverted Head & Shoulders | Bullish Breakout SetupTITAN has formed a well-structured Inverted Head & Shoulders pattern, signaling a potential bullish trend reversal.
🔹 Breakout confirmed above the neckline
🔹 Neckline tested again after breakout and successfully held as support
🔹 Retests indicate strong buyer presence and acceptance above resistance
🔹 Structure supports continuation towards higher levels
📌 Trade Setup:
Buy Above: immediately
Target (Profit): 🎯 4109
Stop Loss: ❌ 4020
📊 Bias: Bullish as long as price sustains above the neckline.
⚠️ Invalidation:
A decisive close below the neckline and SL level would weaken the bullish setup.
Not financial advice. Trade with proper risk management.

BALKRISIND | Support Trendline + Demand Zone ConfluenceDISCLAIMER: This is NOT a trade recommendation, but only my observation. Please do your own analysis before entering your trades.
Points to note:
------------------
1. A Support trendline of 3 years is being respected by price
2. There is tightness since Oct 2025, on the said trendline, indicating accumulation.
3. A Higher High, Higher Low formation is being seen.
------------------
Keeping in mind the above points, the following trade:
Entry CMP, SL 2220, TGT 2525, 2750

#DMART RESLUT COMING PERFECT#DMART RESLUT COMING PERFECT
ADD ABOVE 3873 FOR 4949
there are support near 3333 and resisitance near 5200
for long term
after breaking these levels ..new tgt will open

Part 10 Trade Like Institutions Options Expiration and Exercise
Options have a finite life, expiring on a predetermined date. They can be exercised:
American Options: Can be exercised any time before expiration. Common in stocks.
European Options: Can only be exercised on the expiration date. Common in indices and ETFs.
Settlement:
Physical delivery: Underlying asset is delivered upon exercise.
Cash settlement: Profit/loss is settled in cash, common in index options.

Part 4 Learn Institutional Trading What Are Options?
At its core, an option is a financial derivative contract that gives the buyer the right, but not the obligation, to buy or sell an underlying asset at a predetermined price (known as the strike price) on or before a specific date (the expiration date). Unlike buying the asset outright, purchasing an option requires paying a premium, which is the cost of acquiring the right conveyed by the option.
Options are broadly classified into two types:
Call Option: Gives the holder the right to buy the underlying asset at the strike price.
Put Option: Gives the holder the right to sell the underlying asset at the strike price.

FORCEMOT 1 Day Time Frame 📊 Important Daily Levels
1. Key Support Levels
₹18,500–₹18,700 — current intraday lower range area (near recent day’s low).
~₹18,414 — Daily 50‑EMA zone (dynamic support).
~₹17,555 — Daily 100‑EMA support if price weakens further.
~₹15,478 — 200‑EMA long‑term support (major trend level).
2. Key Resistance Levels
~₹19,980–₹20,000+ — recent intraday high daily resistance.
~₹19,579–₹19,876 — shorter daily EMAs (15/5 EMA cluster).
Above ₹20,000 — break above this zone could turn trend bullish short‑term.
📈 Daily Trend & Indicators
RSI ~47 — neutral zone, not showing clear overbought/oversold bias.
MACD bearish on daily, but price still above medium & long EMAs, indicating mixed signals with possible deeper correction.
Above 50 & 100 EMA is still technically bullish overall, but short‑term momentum has weakened.
Practical Levels for Traders (Daily)
✅ Bullish above:
₹19,980–₹20,000 — daily breakout zone
Run‑up potential if sustained: ₹20,500+
⚠ Neutral / consolidation:
₹18,800–₹19,800 — range‑bound daily
⚡ Bearish below:
₹18,500 — first key support
₹17,550 — medium support line
₹15,400–₹15,500 — strong downside support zone

Catostrophic time aheadDear Humans,
I have a strange finding about the coming time which is going to be tougher than 2008, yes its 100years cycle and we are going to see repeat of 1929-1931, I have marked the fall in RED in WXYXZ style move, market always gives you one chance and we are still adamant on on upward direction and investing at top levels where smart money is selling quiet Easily....
Nifty doesn't have any charts or exchange was not there during this time while we can see in Dow john's chart.
the current scenario at ground levels is that even a Lower and medium class is suffering because of the money scarcity in the market..
I can see that we are going to fall around 78%(precisely 76.4%) from highs by may 2027 in just one and half years time as we are in era of social media where movements are very fast ,,1929-1931 was 2.5 years time great depression.. " what name the market will it be given to this Catastrophic fall" ..
those who were mongeringfall of 12500 levels pre covid high levels at 16000/18000/20000/23500, its time to see those levels again, yes by May/June 2026 . unfortunately they all became bulls now and talking of 28000-30000 levels. well the investor has to hold on for 6 years or more to see these levels again, as history suggest that once such brutal fall happens then time takes its own course to rise again.
even Astro is suggesting Jupiter in 6/8 axis and malific ketu during this 6 years so the journey will be tough to rise from 6000 levels .. so its a time and price fall this time, both together..
Great Depression / Recession/ stagflation/WW3 god knows what all we see ? but
chart is showing a horrific picture..
Its a bigger time frame fall ( weekly, monthly & Yearly) so post this destruction we will not see these brutal levels for next bigger cycle atleast.. may God gives energy & courage to face the tough time coming ahead..
Yes after this fall we will enter into big time bull ERA, Prosperity, growth and growth only..
This post will really help next to next generations to see this interesting finding, if this software pertains that time..
* disclaimer:
its my personal finding for education purpose only and don't take any trade on basis of this.

RELIANCE may head for 1111 #RELIANCE is forming a NEAT 3-3-5 FLAT and should head for 1111. Anybody in EW kindly study and share views. In simple terms if you see the two DTF and WTF charts , the stock is forming a 3-3-5 FLAT correction STARTING 12 July 2024 where sub wave -a has three sub waves culminating at 1114 on 07 Apr 2025 and sub sub -c of this wave is ending as a 5 wave Ending Diagonal. Then we have sub wave-b going up in three sub waves again culminating at 1611 high on 03 Jan 2026. Now I am looking for sub wave -c going deep down to 1111 in five sub waves 1-2-3-4-5 as I have shown in the DTF Chart. ANALYSIS INVALIDATION 1611 ( or even 1575 may be good enough for invalidation). THIS DTF CHART ( Daily Time Frame).Lets C

DMART - What can you possibly expect next......💹 Avenue Supermarts Ltd (DMart)
Context: Q3 FY26 Results vs Market Expectations
Chart View: Daily
Market Context: When Good Results Are Not Enough
DMart reported growth in both revenue and profit in its latest quarterly results. The company continues to add stores, customer demand remains steady, and the business model is stable. There was no major negative surprise in the results, and the long-term business story remains intact.
However, the stock market does not react only to whether results are good or bad. It reacts to whether results are better or worse than what the market was expecting. Before the results, many participants were expecting faster sales growth, better margin improvement, and clearer signs of stronger earnings momentum.
The reported numbers, although positive, did not go much beyond these expectations. Because of this, the stock price did not show a strong positive reaction. When a stock is already trading at higher valuations, the market looks for improvement, not just stability.
This difference between expectations and actual results explains the price behaviour. When expectations are high and results only meet them, prices often move sideways or see short-term selling. This does not mean the business is weak — it simply means the market is adjusting its expectations.
From a chart point of view, the stock is facing selling pressure near earlier price levels. Buying interest is limited for now, and price action suggests the stock is taking time to absorb the results rather than moving in a clear direction.
While DMart continues to report double-digit growth, the market is becoming cautious about the pace of that growth. Revenue growth in the latest quarter was lower than the company’s longer-term average and also slower than the rate at which new stores are being added. This suggests pressure on same-store sales. In addition, margins are facing challenges due to intense competition, price cuts in daily-use products, and changes in GST rates. These factors explain why the stock price has remained under pressure despite healthy headline numbers.
The key learning for beginners is simple: stocks do not always go up after good results. Sometimes prices move sideways to allow expectations to cool down. Patience and understanding the bigger picture are more important than reacting emotionally to quarterly numbers.
⚠️ Disclosure & Disclaimer
This post is shared only for educational and informational purposes. It is not investment advice or a recommendation. Stock market investments involve risk. Please consult a SEBI-registered financial advisor before making any investment or trading decisions.
🚀 Stay Calm. Stay Clean. Trade With Patience. Trade Smart | Learn Zones | Be Self-Reliant

Bitcoin Bybit chart analysis JENUARY 8Hello
It's a Bitcoin Guide.
If you "follow"
You can receive real-time movement paths and comment notifications on major sections.
If my analysis was helpful,
Please click the booster button at the bottom.
This is Bitcoin's 30-minute chart.
The Nasdaq indicator will be released shortly at 10:30 AM.
*When the red finger moves,
this is a one-way long position strategy.
1. $89,346.8 is the entry point for a long position.
Stop-loss price is set when the green support line is broken.
(It must be touched before 9 PM,
to complete the 6+12 pattern and trigger an uptrend.)
2. I've marked the wave path with the finger in the middle.
The short-term target price is $90,546 -> $91,516.9.
After re-entering the long position at $90,880,
the target price is in order from Top -> Good -> Great.
If it touches the bottom today,
the mid-term pattern will be broken again,
creating the possibility of further declines. Please be careful.
The bottom section is connected to the uptrend line, so it's best to maintain a long position.
The bottom section is open up to section 1.
Please note that my analysis up to this point is for reference only.
I hope you operate safely, with a clear focus on principled trading and stop-loss orders.
Thank you.

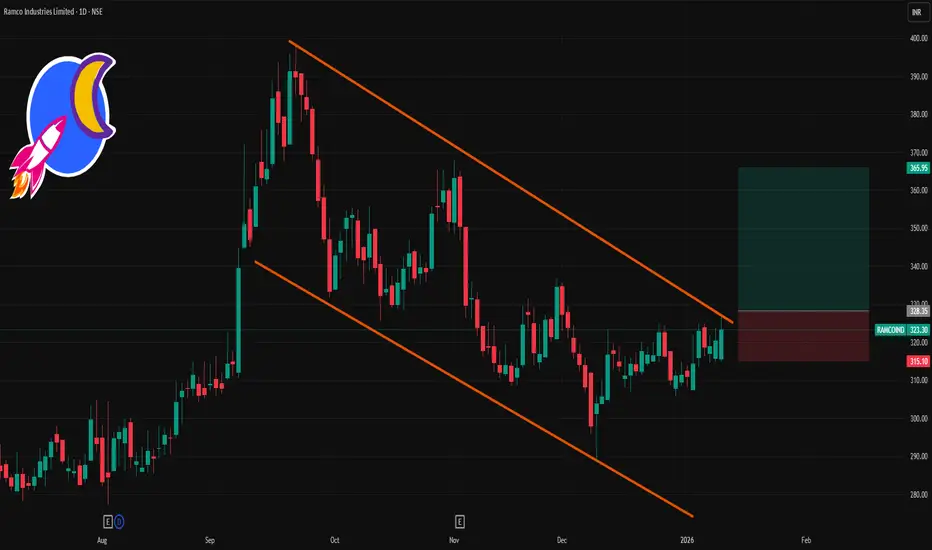
RAMCOIND 1 Day Time Frame 📈 Current Price (Approx Latest Close)
📌 Last Traded / Closing Price: ~₹323.30 on NSE (as of Jan 9, 2026)
📊 Daily Pivot & Support/Resistance Levels
Classic Pivot Levels (Daily)
These are useful for intraday and short‑term directional bias:
Level Price (Approx)
R3 ~₹336.23
R2 ~₹329.12
R1 ~₹321.78
Pivot ~₹314.67
S1 ~₹307.33
S2 ~₹300.22
S3 ~₹292.88
Interpretation:
Above Pivot (~314–315): bullish bias.
Above R1 (~321–322): stronger upside view.
Break above R2 (~329): could shift momentum higher intraday.
Below Pivot: more bears in control.
📌 Alternate Daily Pivot (Standard)
Another reliable pivot view from recent technical data:
Level Price
R3 ~₹324.02
R2 ~₹321.03
R1 ~₹316.62
Pivot ~₹313.63
S1 ~₹309.22
S2 ~₹306.23
S3 ~₹301.82
This set is slightly tighter but confirms similar zones near ₹310–₹322.
📌 How to Use These Levels Today
Bullish below/above strategy:
Bullish view: Price staying above Pivot (~₹314–315) and ideally R1 (~₹321–322) — targets R2 (~₹329) then R3 (~₹336).
Bearish risk: If price fails below Pivot (~₹314), next stops are S1 (~₹307) → S2 (~₹300).
🧾 Summary — 1D Levels Snapshot
Zone Level
Resistance 3 ~₹336
Resistance 2 ~₹329
Resistance 1 ~₹322
Pivot ~₹315
Support 1 ~₹307
Support 2 ~₹300
Support 3 ~₹293
BUY TODAY SELL TOMORROW for 5%DON’T HAVE TIME TO MANAGE YOUR TRADES?
- Take BTST trades at 3:25 pm every day
- Try to exit by taking 4-7% profit of each trade
- SL can also be maintained as closing below the low of the breakout candle
Now, why do I prefer BTST over swing trades? The primary reason is that I have observed that 90% of the stocks give most of the movement in just 1-2 days and the rest of the time they either consolidate or fall
Trendline Breakout in INFOBEAN
BUY TODAY SELL TOMORROW for 5%

Nifty spot 25683.30 by Daily Chart view - Weekly UpdateNifty spot 25683.30 by Daily Chart view - Weekly Update
- Support Zone 25425 to 25725 for Nifty Index
- Resistance Zone 26000 to 26200 >>> ATH 26373.20 for Nifty Index
- Deep rooted Fear plus Geo-Political events dampening Domestic Markets

MTARTECH: Trendline BO with Fresh Momentun, Chart of the WeekNSE:MTARTECH Trendline Breakout after Signals Fresh Momentum as BofA Takes Stake in It. Let us understand it in the "Chart of the Week."
As per the Latest SEBI Mandate, this isn't a Trading/Investment RECOMMENDATION nor for Educational Purposes; it is just for Informational purposes only. The chart data used is 3 Months old, as Showing Live Chart Data is not allowed according to the New SEBI Mandate.
Disclaimer: "I am not a SEBI REGISTERED RESEARCH ANALYST AND INVESTMENT ADVISER."
This analysis is intended solely for informational purposes and should not be interpreted as financial advice. It is advisable to consult a qualified financial advisor or conduct thorough research before making investment decisions.
Price Action Overview:
- Current Price: ₹2,689.70 (+13.38%)
- 52-Week High: ₹2,920.35
- 52-Week Low: ₹1,155.60
- The stock has broken out from a multi-month symmetrical triangle pattern with strong volumes
- Price is currently trading 8% below its all-time high, showing recovery momentum
- A recent breakout occurred with significant volume expansion (6.66M vs the average of 2.38M)
Volume Spread Analysis:
- Current Volume: 6.66M (significantly above average)
- Average Volume: 2.38M
- Volume Spike: Nearly 3x the average, confirming strong institutional interest
- Breakout accompanied by highest volume in recent months
- Volume expansion during up-moves and contraction during corrections is a bullish sign
- Green volume bars dominating in recent sessions indicating buying pressure
Symmetrical Triangle Breakout:
- Formation Period: Mid-2024 to Early 2026
- Apex Point: Around ₹1,600-1,700 zone
- Breakout Level: ₹2,400-2,450
- Pattern indicates consolidation followed by directional move
- Breakout suggests potential continuation of the prior uptrend from 2022 to 2023
Descending Trendline Break:
- A major descending trendline resistance from the 2023 peak has been decisively broken
- This trendline acted as resistance throughout 2024-2025
- Break confirms shift in market sentiment from bearish to bullish
Key Support and Resistance Levels:
Major Support Zones:
- Immediate Support: ₹2,400-2,450 (breakout zone and recent consolidation)
- Secondary Support: ₹2,200-2,250 (previous resistance turned support)
- Strong Support: ₹1,900-2,000 (triangle mid-point and psychological level)
- Critical Support: ₹1,600-1,700 (triangle apex and long-term support)
Major Resistance Zones:
- Immediate Resistance: ₹2,750-2,800 (short-term supply zone)
- Major Resistance: ₹2,900-2,920 (all-time high zone)
- Psychological Resistance: ₹3,000 (round number psychological barrier)
Base Formation:
- Primary Base: The symmetrical triangle from mid-2024 to early 2026 represents a consolidation base
- This base formed after a significant decline from the 2023 highs
- Base width suggests potential for sustained upward movement
- The longer consolidation typically leads to stronger breakouts
Trend Analysis:
- Short-term Trend (Daily): Bullish with strong momentum
- Medium-term Trend (Weekly): Transitioning from consolidation to bullish
- Long-term Trend (Monthly): In recovery phase after 2023-2024 correction
- Price trading above key moving average levels post-breakout
Sectoral Backdrop:
Clean Energy and Nuclear Power Sector:
- India's nuclear power capacity expansion plans gaining momentum
- Government targeting 100 GW nuclear capacity by 2047
- Small Modular Reactors (SMRs) emerging as key focus area
- Global shift toward carbon-neutral energy boosting nuclear power demand
- MTAR is positioned as a key supplier to India's nuclear program
Defense Manufacturing Sector:
- India's defense budget increased to ₹6.21 lakh crore for FY25
- The government's 'Aatmanirbhar Bharat' initiative driving domestic defense manufacturing
- Capital outlay for defense modernization supporting equipment manufacturers
- Private sector participation in defense production expanding
- MTAR supplies critical components to defence applications, including missile systems
Space Technology Sector:
- ISRO's increasing launch frequency and ambitious missions
- Private space sector opening up with policy reforms
- Growing demand for satellite components and launch vehicle parts
- India positioning itself as a low-cost space launch provider globally
- MTAR manufactures precision components for space applications
Industrial and Clean Energy Equipment:
- India's renewable energy target of 500 GW by 2030
- Growing demand for precision-engineered components in various industries
- Export opportunities expanding in specialized manufacturing
- The government's PLI schemes supporting manufacturing competitiveness
Fundamental Backdrop:
Company Overview:
- MTAR Technologies is a precision engineering solutions company
- Specializes in manufacturing critical and precision components
- Serves diversified sectors: Nuclear, Defense, Space, and Clean Energy
- Established reputation with marquee clients including ISRO, BARC, DRDO
- Listed on NSE and BSE in March 2021
Recent Key Developments:
- BofA Securities (Bank of America) has reportedly acquired a stake in the company
- This institutional interest signals confidence in the company's growth prospects
- The timing of the stake acquisition coinciding with technical breakout is noteworthy
- Institutional buying often precedes sustained upward moves
Business Strengths:
- Strong order book visibility across multiple sectors
- High entry barriers due to specialized manufacturing capabilities
- Long-term relationships with government and PSU clients
- Diversified revenue streams reducing concentration risk
- Focus on high-margin precision engineering products
Growth Drivers:
- Expanding nuclear power program in India
- Increasing defense indigenization requirements
- Growing space sector opportunities with ISRO and private players
- Clean energy transition driving demand for specialized components
- Potential for export growth in precision engineering
Key Metrics to Watch:
- Order book growth and execution
- Revenue mix across different sectors
- Operating margins and profitability trends
- Capacity utilization and expansion plans
- Working capital management
Risk Factors:
- Failure to hold ₹2,400 support could trigger profit booking
- Market-wide correction could impact momentum
- Any negative news on key sectors (defence/nuclear) could affect sentiment
- Overbought conditions in the near term may lead to consolidation
Key Levels to Watch:
- Breakout Confirmation: Sustained trade above ₹2,700
- Momentum Acceleration: Break above ₹2,920 (all-time high)
- Support Test: How price behaves if it retests ₹2,400-2,450 zone
- Volume Sustenance: Whether high volumes continue or fade
My 2 Cents:
MTAR Technologies is showing a strong technical setup following a prior symmetrical triangle breakout and current trendline breakout with exceptional volumes. The combination of technical breakout, institutional interest from BofA Securities, and favorable sectoral tailwinds in nuclear, defense, and space sectors creates a compelling case. However, traders should watch for confirmation above the ₹2,700-2,750 levels and manage risk appropriately. The stock's positioning in high-growth strategic sectors provides a supportive fundamental backdrop for the technical rally.
Full Coverage on my Mid-Week Newsletter coming Wednesday.
Keep in the Watchlist and DOYR.
NO RECO. For Buy/Sell.
📌Thank you for exploring my idea! I hope you found it valuable.
🙏FOLLOW for more
👍BOOST if you found it useful.
✍️COMMENT below with your views.
Meanwhile, check out my other stock ideas on the right side until this trade is activated. I would love your feedback.
As per the Latest SEBI Mandate, this isn't a Trading/Investment RECOMMENDATION nor for Educational Purposes; it is just for Informational purposes only. The chart data used is 3 Months old, as Showing Live Chart Data is not allowed according to the New SEBI Mandate.
Disclaimer: "I am not a SEBI REGISTERED RESEARCH ANALYST AND INVESTMENT ADVISER."
This analysis is intended solely for informational purposes and should not be interpreted as financial advice. It is advisable to consult a qualified financial advisor or conduct thorough research before making investment decisions.

BTCUSD 1H Trend Shift Highlights Key Support and Recovery ZoneBitcoin on the 1H timeframe shows a complete cycle of trend development and correction based on clean price action. The market initially respected a bullish structure, forming higher highs and higher lows along an ascending trendline. Strong buying pressure pushed price above previous resistance, confirming bullish continuation and a clear Break of Structure . This impulsive move created a Fair Value Gap in the 91,200–91,700 area, which acted as a demand zone and supported further upside.
As price approached the 94,000–94,500 region, bullish momentum weakened and selling pressure increased. A lower high formed, followed by a decisive break below the rising trendline, signaling a short-term trend reversal. Price then respected a descending trendline, confirming a bearish intraday structure with lower highs and lower lows.
Current price is reacting near the 90,000–89,800 zone, which acts as key support. This area also represents a potential demand zone where buyers may attempt a recovery. A sustained hold above this level can lead to a corrective rebound toward 91,200 and 92,000. Resistance remains at 92,800–93,200, followed by major resistance near 94,000.
Overall, the market is in a corrective bearish phase after a strong rally. Bullish continuation is possible only if support holds and structure shifts again. This analysis is educational and based solely on technical price behavior.

Part 2 Ride The Big Moves How Beginners Should Start Option Trading
A. Start With Buying Options
Risk is limited to premium.
B. Practice with Paper Trading
Learn Greeks, price action, OI analysis.
C. Avoid Selling Naked Options
Very risky without proper experience and capital.
D. Stick to Liquid Instruments
Nifty, Bank Nifty, major stocks with high liquidity.
E. Trade With Proper Stop-Loss
Even though options fluctuate quickly, stop-loss is crucial.

BUY TODAY SELL TOMORROW for 5%DON’T HAVE TIME TO MANAGE YOUR TRADES?
- Take BTST trades at 3:25 pm every day
- Try to exit by taking 4-7% profit of each trade
- SL can also be maintained as closing below the low of the breakout candle
Now, why do I prefer BTST over swing trades? The primary reason is that I have observed that 90% of the stocks give most of the movement in just 1-2 days and the rest of the time they either consolidate or fall
Resistance Breakout in KROSS
BUY TODAY SELL TOMORROW for 5%

NIFTY Ready to Fly - Double Bottom BreakoutNIFTY Trade View (Technical):
Pattern : Double Bottom
Status : Breakout confirmed
Target : 26,310
Stop Loss : 25,900
Quick technical context:
A double bottom breakout generally signals trend reversal / continuation strength, especially if it’s supported by:
Strong closing above the neckline
With SL at 25,900 , the setup offers a defined risk, which is good discipline.
Risk note (important):
Markets can be volatile, and false breakouts do happen—especially near all-time highs. Trailing the stop loss if price moves in your favor can help protect gains.

Smart Choice of Mutual Funds – Build Wealth with Confidence 1. Understanding the Power of Mutual Funds
Mutual funds pool money from multiple investors to invest in diversified assets such as equities, debt, or hybrid instruments.
They offer professional fund management, making them ideal for both beginners and experienced investors.
A smart choice of mutual funds helps reduce risk while aiming for consistent long-term returns.
Investors can start with small amounts through SIPs (Systematic Investment Plans), making wealth creation accessible to everyone.
2. Why Smart Selection Matters
Not all mutual funds perform the same across market cycles.
Choosing the right fund aligns your investments with financial goals, time horizon, and risk appetite.
A smart selection avoids impulsive decisions driven by market noise or short-term performance.
Proper fund selection enhances compounding benefits over the long run.
3. Define Your Financial Goals Clearly
Identify whether your goal is wealth creation, retirement planning, child education, or short-term liquidity.
Match goals with suitable fund categories such as equity for long-term growth or debt funds for stability.
Goal-based investing brings discipline and clarity to your investment journey.
Clear goals help measure performance meaningfully, not emotionally.
4. Assess Your Risk Appetite
Risk appetite varies from conservative to aggressive investors.
Equity funds suit high-risk, long-term investors, while debt funds suit low-risk investors.
Hybrid funds balance risk and return for moderate investors.
A smart mutual fund choice respects your comfort with volatility.
5. Choose the Right Mutual Fund Category
Equity Funds: Ideal for long-term wealth creation and inflation beating returns.
Debt Funds: Suitable for capital preservation and stable income.
Hybrid Funds: Combine equity and debt for balanced growth.
Index Funds: Low-cost funds tracking market indices for passive investors.
Selecting the right category is the foundation of smart investing.
6. Analyze Fund Performance Across Market Cycles
Look beyond short-term returns; evaluate 3-year, 5-year, and 10-year performance.
Consistency matters more than one-time high returns.
Compare fund performance with benchmarks and peer funds.
Smart investors focus on risk-adjusted returns rather than absolute numbers.
7. Understand the Fund Manager’s Expertise
Fund managers play a crucial role in investment decisions.
Experience, investment philosophy, and track record matter.
A stable fund management team ensures continuity in strategy.
Smart investors trust funds with proven leadership and disciplined processes.
8. Evaluate Expense Ratio and Costs
Expense ratio directly impacts net returns over time.
Lower costs lead to higher compounding benefits in the long run.
Index funds and direct plans usually have lower expense ratios.
Smart choices balance cost efficiency with quality fund management.
9. Importance of Asset Allocation
Asset allocation spreads investments across equity, debt, and other assets.
It reduces overall portfolio risk during market volatility.
Rebalancing ensures alignment with changing market conditions and goals.
Smart mutual fund investors follow asset allocation, not market emotions.
10. SIP – The Smart Way to Invest
SIPs encourage disciplined and regular investing.
They average out market volatility through rupee cost averaging.
SIPs remove the stress of timing the market.
Smart investors use SIPs to build wealth steadily over time.
11. Tax Efficiency of Mutual Funds
Equity mutual funds enjoy favorable long-term capital gains taxation.
ELSS funds offer tax benefits under Section 80C.
Debt funds provide indexation benefits for long-term investors.
Smart fund selection also considers post-tax returns, not just gross returns.
12. Avoid Common Investor Mistakes
Chasing past performance without understanding risks.
Frequent switching of funds due to market fluctuations.
Over-diversification leading to diluted returns.
Smart investors stay patient, informed, and disciplined.
13. Review and Monitor Regularly
Periodic review ensures funds are aligned with goals.
Monitor performance, but avoid overreacting to short-term volatility.
Replace underperforming funds only with valid reasons.
Smart investing is proactive, not reactive.
14. Role of Professional Guidance
Financial advisors help match funds with personal goals.
They provide unbiased advice during volatile market phases.
Professional guidance prevents emotional investment decisions.
Smart investors value expert insights for long-term success.
15. Long-Term Vision is the Key
Mutual funds reward patience and consistency.
Compounding works best when investments are left untouched for longer periods.
Market ups and downs are temporary; discipline is permanent.
A smart choice of mutual funds transforms small savings into significant wealth.
16. Conclusion – Invest Smart, Grow Strong
Smart mutual fund investing is about clarity, discipline, and informed decisions.
The right fund, aligned with goals and risk profile, ensures financial confidence.
With proper planning, mutual funds become powerful wealth-building tools.
Make a smart choice today and secure a financially stronger tomorrow.
Smart Choice of Mutual Funds – Because Intelligent Investing Builds Lasting Wealth.

ETERNAL: Early Signs of "U" shaped turnaround‽Technicals: ETERNAL has completed a full markdown phase after distribution near the 345/355 supply zone. the sharp selloff was followed by prolonged sideways move near the lows which clearly signals selling exhaustion rather than continuation. price has been respecting the higher timeframe demand zone around 277/283, and every dip into this area is being absorbed quickly.
From SMC perspective, this zone shows accumulation by stronger hands, not retail panic the narrow range candles and repeated rejections from below confirm that liquidity below 277 has already been swept the market is now compressing, preparing for a directional move.
The 285/288 zone is the short-term decision level. acceptance above this area indicates a shift from accumulation to early expansion the curved forecast path you’ve drawn makes sense because this is not a momentum breakout scenario but a gradual re-pricing phase after a deep correction.
As long as price holds above 277 and continues to build above 288, the bias remains bullish. Any move below 275 would break the demand structure and invalidate the bullish setup.
Fundamentals: the stock has gone through expectation reset, not business breakdown. the correction reflects margin pressure and cautious earnings outlook which the market has already priced in during the decline.
The key missing driver earlier was earnings visibility and that still remains the deciding factor. the market is currently in wait and watch mode ahead of results this explains why price is basing instead of rallying aggressively.
If upcoming results show margin stability, controlled costs, or neutral-to-positive guidance, institutional participation can increase. That would align perfectly with the accumulation seen on charts and fuel the next expansion leg without confirmation, price may still move higher but in a controlled and selective manner.
In short, fundamentals support stability first and trend continuation only after confirmation.
Levels to Watch
Higher timeframe demand zone: 277–283
Bullish bias holds above: 288
First upside objective: 303
Major structure level: 323
Supply zone: 343
Extended liquidity target: 377
Invalidation level: Below 275
Technically, sellers are done.
Structurally, accumulation is in place.
Fundamentally, the business is stabilizing, not failing.
Above 288, the chart supports your bullish roadmap step by step toward higher liquidity zones. This is a structured recovery setup, not a hype-driven rally.
Like, comment your thoughts, share this post
Explore more stock ideas on the right hand side!
Disclaimer: This post is for educational purposes only and should not be considered a buy/sell recommendation.
