MPHASIS – Tight Structure Building Before the Next MoveMPHASIS is currently trading inside a well-defined triangle structure, where price is making lower highs and higher lows.
This clearly shows that the market is moving into a compression phase, with buyers and sellers gradually pushing price into a narrower range. Instead of trending strongly in one direction, the stock is taking time to build energy.
The upper trendline continues to act as resistance, while the rising base is providing consistent support. As price moves closer to the end of this structure, a strong directional move is usually expected.
At this stage, the focus is not on predicting the move, but on waiting for confirmation.
👉 A strong close above resistance may signal upside continuation.
👉 A clear break below support could invite further downside.
Until then, patience is key.
Let price decide the direction — structure only shows that a move is coming.
Chart Patterns

XAUUSD – Weekend Geopolitical Shock → GAP & Continuation Market Context (Why the GAP?)
Over the weekend, geopolitical tensions escalated sharply, triggering a strong risk-off reaction at the start of the week.
Typical market response:
Capital rotates out of risk assets
USD softens amid uncertainty
Gold opens with a bullish GAP on Monday and continues higher
This is not a low-liquidity weekend GAP, but a safe-haven driven GAP, which historically does not need to be filled immediately.
HTF Structure (H1–H4)
Overall structure remains clearly bullish
Multiple bullish BOS are still intact
The latest impulse created a large FVG above equilibrium
Current pullback is technical rebalancing, not a trend reversal
➡️ Market behavior: Impulse → Pullback → Continuation
Key Zones for the Week
Upper FVG / reaction zone: 5,020 – 5,000
Mid FVG (decision zone): 4,988 – 4,960
Lower FVG / strong support: 4,960 – 4,940
HTF Order Block: around 4,910 – 4,900
As long as price holds above 4,960, the bullish structure remains valid.
Weekly Scenarios (If – Then)
Scenario 1 – Shallow Pullback & Continuation (Primary Bias)
If price pulls back into 4,988 – 4,960 and shows bullish reaction
FVG is respected → trend continuation
Next upside objectives: 5,040 – 5,080
Scenario 2 – Deeper Pullback (Still Corrective)
If price loses 4,960
Expect a deeper retracement toward 4,940 – 4,910 for rebalancing
Only a confirmed H1/H4 close below 4,900 would weaken the bullish structure
Summary
The Monday GAP reflects real defensive capital flows, not technical noise.
With geopolitical risks still elevated, buy-the-dip remains the dominant strategy.
No chasing highs.
No FOMO after the GAP.
Trade the pullback.
React at FVG.
Let structure confirm continuation.

XAUUSD – H1 Outlook: New All-Time HighXAUUSD – H1 Outlook: New ATH, Now Watch the Pullback Structure | Lana ✨
Gold has printed fresh all-time highs and is now trading near the $5,100 psychological area. After six consecutive bullish sessions, the trend is still strong — but at these levels, the market often needs a controlled pullback to rebalance liquidity before the next expansion.
📌 Quick Summary
Trend: Bullish (strong momentum, new ATH)
Timeframe: H1
Focus: Don’t chase highs → wait for pullback into structure
Key idea: Pullback → hold support → continuation toward upper supply
📈 Market Structure & Price Action
Price is moving inside a bullish expansion leg, and the current area is a typical “extended” zone where volatility can increase.
A pullback toward the first clean structural support is healthy and often needed after a steep rally.
As long as price holds above key supports, the bias remains continuation, not reversal.
🔍 Key Zones From the Chart
1) Upper Supply / Profit-taking Area
5100–5130 (approx.)
This is the area where price is likely to face selling pressure / profit-taking, especially after a vertical rally.
2) Primary Support (Pullback Buy Zone)
5000–5020
This is the most important “structure retest” area on the chart — a logical zone for price to rebalance before continuation.
3) Deeper Value Zone (If Pullback Extends)
4750–4800 (Fibo value cluster on chart)
If the market pulls deeper, this becomes the more attractive value zone to watch for stronger reactions.
4) Major Demand Zone (Extreme Support)
4590–4630 (lower purple demand area)
This is a deeper base zone if the market shifts into a larger correction.
🎯 Trading Scenarios (Structure-Based)
✅ Scenario A (Primary): Buy the Pullback Into Structure
Buy Entry: 5005 – 5015
SL: 4995 – 5000 (8–10 points below entry)
TP Targets (scale out):
TP1: 5065 – 5075 (retest of recent high)
TP2: 5100 (psychological milestone)
TP3: 5125 – 5135 (upper supply / extension zone)
TP4: 5150+ (if breakout accepts)
Idea: Let price come back to support, confirm, then ride the trend — no chasing.
✅ Scenario B (Alternative): Deeper Pullback Into Value
If price fails to hold 5000–5020 and dips deeper:
Buy Entry: 4760 – 4790
SL: 4750 – 4755
TP Targets:
TP1: 4900
TP2: 5000
TP3: 5100
TP4: 5125 – 5135
🌍 Macro Context (Short & Relevant)
Gold’s upside momentum is being supported by:
Safe-haven flows amid ongoing geopolitical and trade uncertainty
Expectations of further Fed easing
Continued central bank buying
Strong inflows into ETFs
This backdrop helps explain why pullbacks are more likely to be profit-taking and positioning, not a structural trend change.
✨ Lana’s View
Gold is bullish — but the best trades usually come from patience, not excitement.
At ATH levels, Lana prefers buying pullbacks into structure, scaling out into targets, and letting the market do the work.

#ETH one final hope?
One last hope for a bounce back.
If the price fails to break and hold above $3050, then we may see a downside move. The direction is still not clear.
Disclaimer:
This idea is provided for educational and informational purposes only.
It does not constitute financial advice, investment recommendations, or trade signals.
The creator and Systematic Traders Club are not responsible for any financial losses resulting from the use of this indicator.
Trading and investing involve risk. Always do your own analysis and use proper risk management.

XAUUSD - ATH confirmed, buy pullbacks to 5,100+Gold continues to trade in a strong ATH expansion phase, not a blow-off move. The latest impulsive rally confirms that buyers remain in control, while pullbacks are being absorbed quickly and efficiently. On the macro side, USD weakness persists, safe-haven flows remain active, and the market still prices only modest Fed easing — a combination that continues to support gold at elevated levels.
At this stage, ATHs are no longer resistance — they are areas of acceptance.
Structure & Price Action
Bullish structure remains intact with clear Higher Highs – Higher Lows.
No bearish CHoCH has formed despite the sharp upside extension.
Current consolidation near the highs suggests continuation, not exhaustion.
Pullbacks are corrective and aligned with the ascending trendline and demand zones.
Key insight: ATH is being defended by structure → trend continuation remains the primary bias.
Trading Plan – MMF Style
Primary Scenario – Buy the Pullback Focus on patience, not chasing price.
BUY Zone 1: 4,984 – 4,970 (Former resistance turned demand + short-term rebalancing)
BUY Zone 2: 4,928 – 4,910 (Trendline confluence + deeper liquidity absorption)
➡️ Only execute BUYs after clear bullish reaction and structure confirmation. ➡️ Avoid FOMO at the highs.
Upside Targets (ATH Extension):
TP1: 5,085
TP2: 5,120+ (extension if momentum sustains)
Alternative Scenario If price holds above 5,085 without a meaningful pullback, wait for a break & retest before looking for continuation BUYs.
Invalidation A confirmed H1 close below 4,910 would weaken the current bullish structure and require reassessment.
Summary Gold remains in a controlled ATH expansion, supported by both structure and macro flow. The edge is not predicting the top, but buying pullbacks into demand while the trend is intact. As long as structure holds, higher prices remain the path of least resistance.

BTCUSD SHORTBitcoin loading 72000/ soon see only short trades . BTC is in selling zone in weekly time frame.
BTCUSD Sell
Only

HTF Bullish Context: Buy the Pullback, Not the Market Context
Gold remains in a strong higher-timeframe bullish structure.
Momentum is driven by sustained risk-off flows and persistent demand for safe-haven assets.
In this environment, pullbacks are opportunities, not signs of reversal.
Technical Structure (HTF → LTF Alignment)
Price previously confirmed a BOS (Break of Structure) to the upside.
The latest impulsive leg created a clear bullish FVG.
Current price is consolidating below 4,953, signaling a corrective pullback, not distribution.
Structure remains intact as long as price holds above the key demand zone.
Key Levels (Decision Zones)
Current high: 4,953
Discount pullback zone (FVG): 4,906 – 4,887
Deep support / structure low: 4,810
Upside projection (1.618): 5,061
Scenarios (If – Then)
Primary Scenario – Bullish Continuation
If price reacts and holds above 4,900
FVG is respected → continuation toward 4,953, extension to 5,061
Alternative Scenario – Deeper Pullback
If price loses 4,900
Expect a deeper retracement toward 4,810
Structure remains bullish unless HTF closes below 4,810
Summary
This is a trend continuation environment.
Chasing highs carries poor risk-reward.
Buy the pullback.
Respect the FVG.
Let structure do the work.

XAUUSD – Monday Focus: Buy the Dip Toward 5,020–5,043Market Context
Gold remains firmly supported by a bullish risk environment. The recent impulse leg confirms that buyers are still in control, while pullbacks are being absorbed rather than extended.
This is continuation behavior, not distribution.
The question for Monday is not if Gold is bullish —
but where the dip becomes opportunity.
Technical Structure (H1)
Market has already confirmed bullish BOS
Strong impulsive leg created multiple stacked FVGs below
Current price is consolidating above structure, not breaking it
Pullback is corrective in nature
This is a classic impulse → retracement → continuation setup.
Key Zones to Watch
Immediate resistance / BOS level: 4,969 – 4,970
Intraday BUY zone: 4,933 – 4,940
Upper FVG support: 4,920 – 4,899
Deeper demand (HTF): 4,860 – 4,880
As long as price holds above the upper FVG, bullish bias remains intact.
Scenarios (If – Then)
Scenario 1 – Bullish Continuation (Primary)
If price pulls back into 4,933 – 4,940 and holds
Buyers step in → continuation toward:
5,020
5,043 (1.618 extension)
Scenario 2 – Deeper Pullback (Alternative)
If price loses 4,933
Expect mitigation toward 4,920 – 4,899
Only a sustained H1 close below 4,899 would weaken the bullish structure
Summary
Gold is not overextended — it is rebalancing within a bullish trend.
The structure favors buying pullbacks, not chasing highs.
This is a dip-buying market until structure says otherwise.

Gold Trend and Scalping Strategy for 26th january 2026🟡 GOLD TRADING PLAN (Intraday)
📈 TREND TRADING STRATEGY
🔔 BUY SETUP
💲 Buy Above: High of 30-minute candle
📌 Condition: Candle must close above 5019
🎯 Targets:
Target 1: 5029
Target 2: 5039
Target 3: 5049
🛑 Stop Loss:
Below the 30-minute candle low or as per your risk management
📊 Logic:
Sustained price action above 5019 confirms bullish momentum
Suitable for trend-following traders
🔔 SELL SETUP
💲 Sell Below: Low of 1-hour candle
📌 Condition: Candle must close below 4963
🎯 Targets:
Target 1: 4953
Target 2: 4943
Target 3: 4933
🛑 Stop Loss:
Above the 1-hour candle high
📊 Logic:
Breakdown below 4963 confirms bearish continuation
Ideal for positional intraday trend trades
⚡ SCALPING STRATEGY
🔻 SCALPING SELL
📌 Area: Around 5019 resistance zone
🔔 Entry Rule:
Price moves near 5019,
15-minute candle gets rejected (wick / strong selling pressure),
Sell below the low of the rejected 15-min candle
🛑 Stop Loss:
Above the high of the rejected candle
🎯 Profit Booking:
5 to 10 points, OR
Trail stop loss for extended move
📊 Logic:
5019 acts as a strong supply zone
Best for quick momentum scalps
🔺 SCALPING BUY
📌 Area: Around 4963 support zone
🔔 Entry Rule:
Price approaches 4963,
15-minute candle shows rejection / buying support,
Buy above the high of the rejected candle
🛑 Stop Loss:
Below the low of the rejected candle
🎯 Profit Booking:
5 to 10 points, OR
Trail stop loss
📊 Logic:
4963 acts as a demand zone
Suitable for support-based scalping
⚠️ DISCLAIMER
🚫 This content is only for educational purposes
🚫 Not a buy/sell recommendation
🚫 Trading involves high risk
🚫 Please consult your financial advisor before trading
🚫 Trade strictly with proper risk management

Gold Trend and Scalping Strategy for 26th January 2026🟡 GOLD TRADING PLAN (Intraday)
📈 TREND TRADING STRATEGY
🔔 BUY SETUP
💲 Buy Above: High of 30-minute candle
📌 Condition: Candle must close above 5019
🎯 Targets:
Target 1: 5029
Target 2: 5039
Target 3: 5049
🛑 Stop Loss:
Below the 30-minute candle low or as per your risk management
📊 Logic:
Sustained price action above 5019 confirms bullish momentum
Suitable for trend-following traders
🔔 SELL SETUP
💲 Sell Below: Low of 1-hour candle
📌 Condition: Candle must close below 4963
🎯 Targets:
Target 1: 4953
Target 2: 4943
Target 3: 4933
🛑 Stop Loss:
Above the 1-hour candle high
📊 Logic:
Breakdown below 4963 confirms bearish continuation
Ideal for positional intraday trend trades
⚡ SCALPING STRATEGY
🔻 SCALPING SELL
📌 Area: Around 5019 resistance zone
🔔 Entry Rule:
Price moves near 5019,
15-minute candle gets rejected (wick / strong selling pressure),
Sell below the low of the rejected 15-min candle
🛑 Stop Loss:
Above the high of the rejected candle
🎯 Profit Booking:
5 to 10 points, OR
Trail stop loss for extended move
📊 Logic:
5019 acts as a strong supply zone
Best for quick momentum scalps
🔺 SCALPING BUY
📌 Area: Around 4963 support zone
🔔 Entry Rule:
Price approaches 4963,
15-minute candle shows rejection / buying support,
Buy above the high of the rejected candle
🛑 Stop Loss:
Below the low of the rejected candle
🎯 Profit Booking:
5 to 10 points, OR
Trail stop loss
📊 Logic:
4963 acts as a demand zone
Suitable for support-based scalping
⚠️ DISCLAIMER
🚫 This content is only for educational purposes
🚫 Not a buy/sell recommendation
🚫 Trading involves high risk
🚫 Please consult your financial advisor before trading
🚫 Trade strictly with proper risk management

EURUSD 1W T/F ANALYSIS-----
eurusd 1w t/f analysis----- center portion is a arc and it`s breakout so arc of previous marked demand can measure still demand are remaning so we can go with demand on lower t/f ok /
larger t/f are a direction and lower t/f become for entery purpose

What next on nifty ?NSE:NIFTY As per price action concept, context is bearish there is no doubt....
60% chances is market will resume it trend and 40% is it will reverse,
if it remians sideways probablity goes 50-50 for both bull and bears

BTCUSDT | Elliott Wave – Bearish Wedge Setup
Price is forming a bearish wedge within an Elliott Wave structure.
Wave (1) and (2) are completed. Current consolidation is part of Wave (3), with a possible final push forming Wave (5) wedge will breakdown, more down side is possible
After Wave (5) completion, price will move towards the years old price trend channel to retest is the best buying opportunity
Key Levels:
Buying zone: ~77,200 USDT
Bias: Bearish after wedge breakdown
Invalidation: Strong breakout above wedge resistance

inverser head and shoulder stock is showing inver head and sholder
prise closed above vwap
rsi is crosing 20 ema good position

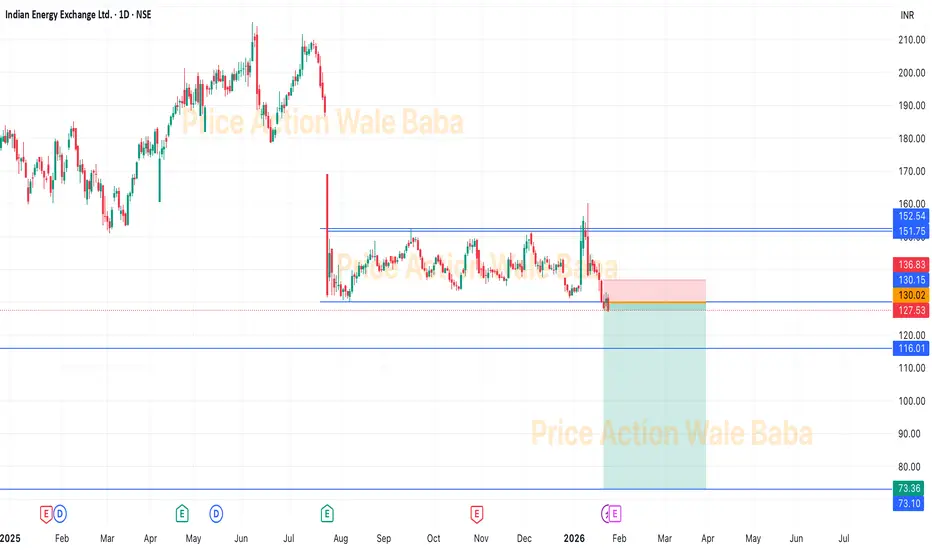
IEX - Box BreakoutIEX was consolidating in the box from the long time and now it's out of the box.
It is good to short IEX and hold for the target of 115-110
Although, you can keep in the hold for the target of 80-75 as we know government policy are comes against IEX's monopoly.
Head & shoulder patternLast week Qpower formed h&s pattern on weekly time frame and breaks the neck line with good volumes.
These views are only for educational purposes.

V2 Retail - Multibagger Stock not to miss for 5x ROIV2 Retail - Multibagger Stock not to miss for 5x ROI in coming 7-8 Years.
Fundamentals:
Company has delivered good profit growth of 84% CAGR over last 5 years
Company has delivered good profit growth of 40% CAGR over last 10 years
Median sales growth is 33.3% of last 10 years
Technical:
Stock has recently broken from Monthly CUP Pattern. Stock is in continuous uptrend.
LTP - 1826
Targets - 9000+
Timeframe - 7-8 Years
Happy Investing.

ETH long term chartETHUSD – Weekly Structure
• Pattern: Long-term range / re-accumulation (Wyckoff-style)
• Trend bias: Bullish (higher lows since 2023)
• Volatility compression → expansion coming
Key Levels
• Resistance: $3,800–4,100
• Support: $1,400–1,600
Bullish Breakout
• Trigger: Weekly close above $4,100 + volume
• Measured move target:
– $5,500–6,000
– $7,200–7,800
– Extension: $9,500–10,000
Bearish Invalidation
• Weekly close below $1,400
• Downside support: $900–1,100
Summary
• ETH is coiling inside a macro range
• Break above range likely leads to strong multi-year expansion

NIFTY- Intraday Levels - 27th Jan 2026Monthly expiry and also trade deal news may impact on market movements so I think market can become volatile
If NIFTY sustain above 25053/95 above this bullish then 25488/501 then 25175/81/97 strong level above this more bullish then 25224/30/245/56 very very strong level above this wait more levels marked on chart
If NIFTY sustain below 25996/89 strong level below this bearis then around 25915 then 25857/41 then25806/744 very very strong level below this more bearish below this wait more levels marked on chart
My view :-
"My viewpoint, offered purely for analytical consideration, The trading thesis is: Nifty (bearish tactical approach: sell on rise)
However don't have a clear view due to trade deal news this may impact the movement of market.
This analysis is highly speculative and is not guaranteed to be accurate; therefore, the implementation of stringent risk controls is non-negotiable for mitigating trade risk."
Consider some buffer points in above levels.
Please do your due diligence before trading or investment.
**Disclaimer -
I am not a SEBI registered analyst or advisor. I does not represent or endorse the accuracy or reliability of any information, conversation, or content. Stock trading is inherently risky and the users agree to assume complete and full responsibility for the outcomes of all trading decisions that they make, including but not limited to loss of capital. None of these communications should be construed as an offer to buy or sell securities, nor advice to do so. The users understands and acknowledges that there is a very high risk involved in trading securities. By using this information, the user agrees that use of this information is entirely at their own risk.
Thank you.

BEL | Range-Bound Structure | Deciding ZoneBharat Electronics is currently trading inside a rising consolidation pattern, with price respecting both ascending trendline support and overhead supply zone.
Momentum has cooled after the prior rally, indicating a pause phase rather than trend reversal.
🔍 Technical Observations:
• Higher-low structure intact
• Price compressing between trendline support & declining resistance
• Volatility contraction → expansion likely next
• Volume neutral – waiting for trigger
📈 What to Watch:
• Break & close above range → Trend continuation
• Break below trendline → Deeper pullback / retest zone
📌 Current Status: ⚖️ Deciding Zone
👉 Patience > Prediction
⚠️ Educational view only. Not a buy/sell recommendation.
#BEL #BharatElectronics #DecidingZone #RangeBound #StockMarketIndia #TechnicalAnalysis #PriceAction #SwingTrading

Next week: Will gold listen to the Fed… or the White House?🔎 Context
Next week could be highly volatile as monetary policy and geopolitics converge.
Donald Trump signaled a potential 100% tariff on Canadian goods if Canada moves closer to trade deals with China—raising trade-war risks.
At the same time, military assets are being deployed en masse around Iran, heightening concerns that tensions could escalate.
👉 Safe-haven flows may return, with gold potentially opening the week gap-up and early buying.
🧠 Quick take
Primary trend: Bullish
At elevated prices: a short, sharp shakeout is possible to absorb liquidity
No top/bottom calls—watch price reactions at key zones
📌 Key levels to watch
🟢 Supports: 4920–4900 | 4890–4882 | 4850–4830 | 4660–4640
🔴 Observation resistances: 5006–5030–5090 | 5110–5115 | Current ATH
🎭 Weekly scenarios (reference only)
Early week: Gap-up / early push
Pre-FOMC: Chop & liquidity sweep
Then: Deep shakeout or base-building and continuation
👉 Distribution at the top—or just a pause before the next leg higher?

Home First Finance: When the Hero Starts Losing StrengthOnce upon a time, this stock was a market hero.
Strong rallies, higher highs, and buyers ready to step in on every dip.
But every hero goes through a phase…
when the energy fades and the story changes.
That phase seems to have arrived for Home First Finance.
📉 The Plot Twist:
After a powerful rally, the stock entered a distribution phase.
Buyers started getting exhausted.
Sellers slowly took control.
Then the structure flipped.
Lower highs. Lower lows.
And a clean falling trendline confirmed who’s in charge now.
— Ayushi Shrivastava
NISM-Certified Research Analyst
⚠️ Disclaimer:
This analysis is for educational and informational purposes only and should not be considered as investment advice or a recommendation to buy or sell any security.
Market investments are subject to risk. Past performance is not indicative of future results.
Please consult your financial advisor before taking any trading or investment decisions.
The bounce we’re seeing today?
It doesn’t look like a comeback.
It looks more like a pause to catch its breath.
📍 Current Scene:
Price has taken temporary support near the 1030–1050 zone
A small relief bounce has emerged from this area
But the falling trendline is still pressing from above

Cummins India cmp 3930.40 by Daily Chart viewCummins India cmp 3930.40 by Daily Chart view
- Support Zone 3885 to 3965 Price Band
- Resistance Zone 4165 to 4250 Price Band
- Support Zone reversal observed for stock price
- Volumes need to increase to push price on upside trend
- Price consolidation seen within 3885 to 4110 since mid Jan 2026
