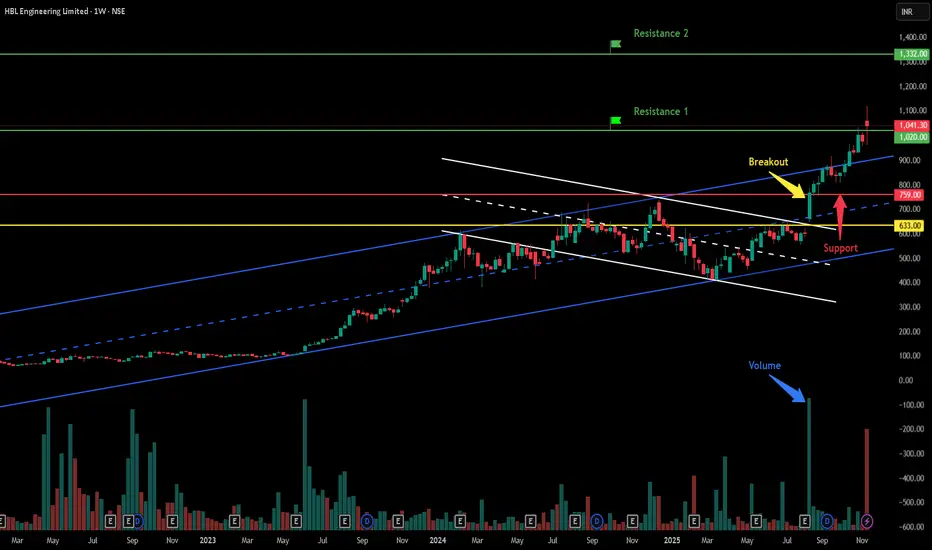
HBL Engineering Ltd - Breakout Setup, Move is ON...#HBLENGINE trading above Resistance of 1020
Next Resistance is at 1332
Support is at 759
Here is previous chart:
Chart is self explanatory. Levels of breakout, possible up-moves (where stock may find resistances) and support (close below which, setup will be invalidated) are clearly defined.
Disclaimer: This is for demonstration and educational purpose only. This is not buying or selling recommendations. I am not SEBI registered. Please consult your financial advisor before taking any trade.
Chart Patterns
EURUSD – Bullish Setup Toward 1.16EURUSD – Bullish Setup Toward 1.17
EURUSD is showing strong signs of a bullish reversal after an extended period of downside movement. The 3H chart highlights several Market Structure Shifts (MSS) and Breaks of Structure (BOS) suggesting that bearish momentum is fading and buyers are regaining control near the 1.1500 demand zone.
The price is forming a solid accumulation base, indicating that smart money may be positioning for a move higher. A clean break above the 1.1680–1.1730 resistance area could confirm a trend reversal, opening the way for a sustained bullish rally toward the mid-1.18 region.
With momentum strengthening and structure turning positive, EURUSD looks poised for a potential breakout continuation in the days ahead.
📈 Key Insights:
Structure: Bullish reversal forming on 3H timeframe
Support zone: 1.1500 – strong accumulation base
Upside targets: 1.1680 → 1.1730 → 1.1800
Outlook: Buyers regaining control; bullish continuation likely

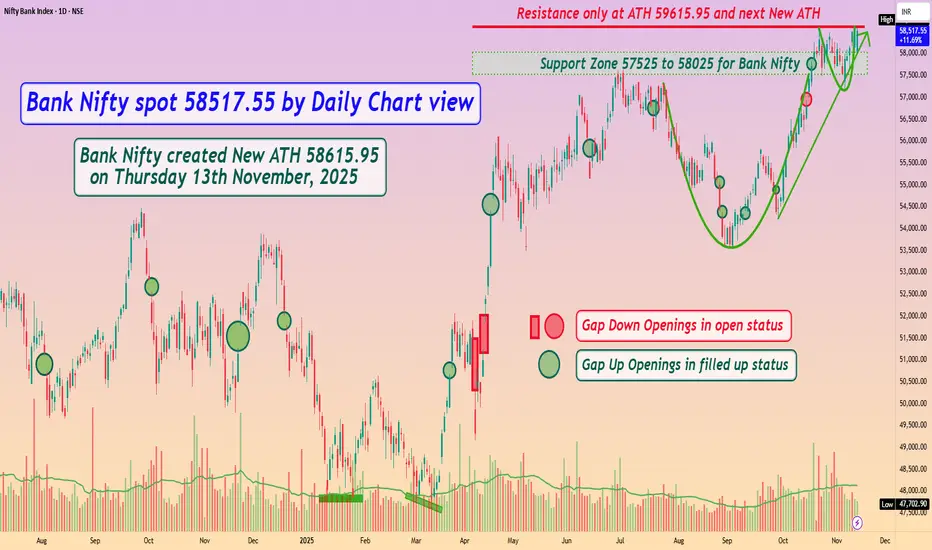
Bank Nifty spot 58517.55 by Daily Chart view - Weekly UpdateBank Nifty spot 58517.55 by Daily Chart view - Weekly Update
- Support Zone 57525 to 58025 for Bank Nifty
- Resistance only at ATH 59615.95 and next New ATH
- Bank Nifty created New ATH 58615.95 on Thursday 13th November, 2025
- Bullish momentum of Rounding Bottoms by Support Zone and Resistance Zone necklines well sustained
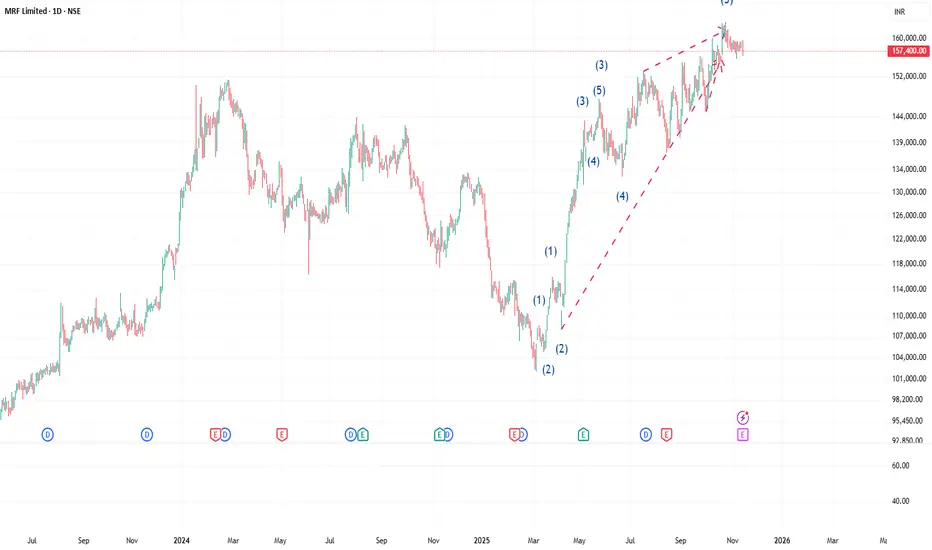
classic example of Ending Diognal Triangle in MRF Dear Trader this is classic case of ending diagonal triangle
this is daily chart of MRF starting from 5th march to 26th may 2025 is five wave which is the third wave and after than up to 4th June 2025 is 4th wave and after that it move up in to three wave which is indicating that this is diagonals triangle
#GRMOVER: Rounding Bottom Breakout in Play!🚨 Monthly chart shows a classic rounding bottom breakout brewing!
Clear break above 498 MCB with strong momentum is needed to confirm the bullish continuation.
CMP: 481.40
🚧 Immediate Resistance: 498
🛡 Key Supports: 434 / 366 - 338 / 289 - 264
🎯 Targets: 935. Beyond that, sky’s the limit!
⚠️ Stay above the negation level to keep the bullish run intact.
#GRMOVER #RoundingBottom #ChartPatterns #PriceAction #LongTerm #Investing
📌 #Disclaimer: This analysis is shared for educational purposes only. It is not a buy/sell recommendation. Please do your own research before making any trading decisions.

XAUUSD Potential Reversal Zone & Bullish Channel Projection (45-1. Price Action Context
Gold (XAUUSD) has been in a short-term downtrend, shown by a sequence of lower highs and lower lows.
Price is currently trading around 4113 after a sharp drop.
2. Key Zone: RESISTANCE Turned SUPPORT
The highlighted red zone around 4081 – 4103 is marked as a major support / demand zone.
This appears to be a level where buyers are expected to step in.
The squiggly black arrows indicate a possible liquidity grab or fake breakout before the true move begins.
3. Projected Bullish Recovery
The gray vertical projection box and upward channel lines suggest the author expects:
A bounce from the 4081–4103 support
A move up through the channel
A potential target around 4220, which aligns with the upper boundary of the projected ascending channel.
4. Trend Channel
A rising channel has been plotted, projecting the potential direction over the next sessions.
Price bouncing inside the lower area of the channel suggests:
The down move might be ending
Momentum could shift toward a bullish correction or even a trend reversal
5. Key Levels Highlighted
Support zone:
4,081.888
4,103.142
Bullish target:
4,220.041
These levels are visually marked and consistent with a reversal strategy.
🧭 Overall Interpretation
This chart proposes a bullish reversal setup, with traders watching for:
A potential liquidity sweep at the support zone
A bounce and consolidation
A climb toward the upper channel area, with 4220 as a projected target
This is a counter-trend reversal idea, so confirmation would be crucial (rejection wicks, bullish candle structures, RSI turning up, etc.).

Asian Paints - Reversal on the Cards ?Asian Paints has undergone a very steep correction of around 38% as compared to the Nifty., breaking strong supports on the way down.
My view is that the reversal has begun and I will give reasons for the same:
1. Asian paints has approached its Dec 2020 support levels which were during the Covid levels of close to 2230-2277. It took multiple supports within this range before moving up and consolidating within the range.
2. On a daily chart it has to cover 2 very important zones before moving either way: a: 2325- 2340 and b: 2565-2760. It has also shown a positive divergence on the charts technically indicating a move upwards.
3. The stock has been over sold and as per law of averages, what goes down must go up as well. Short term this is going to give a decent return and long term it has proven itself already. Patience is the key.
4. A good opportunity to gather this stock would be in the range of 2250-2280 for a trgt of 2520/ 2615/ 2762++ with a SL of 2500.
5. Its P/E has corrected significantly as well and is not close to the industrial P/E. With growth in the housing sector, this is always an A1 favourite.
Plz note this is a view and is not a recommendation to buy or sell.

GOLD H1 – Gold Reacts to Mixed U.S. Inflation Data🟡 XAUUSD – Intraday Smart Money Plan | by Ryan_TitanTrader (14/11)
📈 Market Context
Gold continues to trade within a balanced range as investors digest the latest U.S. inflation data. The CPI report showed cooling price pressures, while producer prices (PPI) are due soon — both shaping market sentiment toward the Fed’s December rate outlook.
• Softer inflation supports a bullish bias if gold holds the discount zone.
• Renewed USD strength could trigger short setups from premium liquidity zones.
Institutional flows suggest engineered liquidity hunts before a decisive move resumes.
🔎 Technical Analysis (1H / SMC Structure)
• Structure: Gold remains in a short-term bullish correction after a strong sell-off, with recent ChoCH signaling a possible re-accumulation phase.
• Premium Zone: 4300–4298 aligns with a previous unmitigated supply and internal liquidity — ideal for sell-side reactions.
• Discount Zone: 4144–4142 overlaps with the last bullish OB and EMA100 area — a potential demand zone for continuation.
• Liquidity: Resting buy-side liquidity sits above 4300, while inducement below 4140 could lure early longs before true accumulation.
🔴 Sell Setup (Premium Reaction Zone)
• Entry: 4,300 – 4,298
• Stop-Loss: 4,310
• Take-Profit Targets:
→ 4,178 (previous BOS zone)
→ 4,144 (discount retest)
→ 4,110 (deep liquidity pocket)
📌 Valid only after a liquidity sweep and bearish BOS confirmation on M5–M15.
🟢 Buy Setup (Discount Reaction Zone)
• Entry: 4,144 – 4,142
• Stop-Loss: 4,135
• Take-Profit Targets:
→ 4,185 (minor structure high)
→ 4,210 (liquidity void fill)
→ 4,300 (final premium reaction zone)
📌 Valid if price reclaims structure with bullish BOS confirmation.
⚠️ Risk Management Notes
• Stay patient until U.S. PPI data confirms direction.
• Avoid trades between 4175–4250 (low R/R consolidation area).
• Scale out partials near liquidity pools and trail stops after confirmation.
• Maintain disciplined risk exposure under 2%.
Summary
Gold is in an engineered equilibrium phase — liquidity pools are forming at both extremes.
• Sell zone: 4300–4298 (premium reaction zone)
• Buy zone: 4144–4142 (discount accumulation zone)
Expect manipulation around mid-range levels before a clean directional move unfolds.
📍Follow @Ryan_TitanTrader for more Smart Money updates ⚡

Gold H1 – Gold Awaits U.S. PPI Data After 5-Wave Completion🟡 XAUUSD – Elliott Wave Intraday Outlook | 14/11
📈 Elliott Wave Context
Gold has completed a textbook 5-wave impulsive rally, peaking near 4250 before entering a corrective phase. The current retracement appears to be forming an ABC correction, with price now approaching the C-wave completion zone around 4145–4147.
Today’s focus shifts to the upcoming U.S. Producer Price Index (PPI) report — a crucial inflation indicator that may influence Fed policy expectations and short-term dollar momentum.
• A hotter PPI print could strengthen USD and trigger a brief sell-off from premium zones.
• A softer reading could weaken USD and fuel a renewed push from discount levels.
🔎 Wave Structure Breakdown (H1)
• Wave 1 → Initial breakout from liquidity trap (~4070).
• Wave 2 → Shallow retracement, respecting prior OB.
• Wave 3 → Strong extension into new highs (~4220+).
• Wave 4 → Sideways correction with internal liquidity grab.
• Wave 5 → Final push to ~4250 — marking potential top.
Now the market is tracing an A–B–C corrective structure, with wave C expected to finalize near the BUY ZONE 4145–4147 (SL 4138) before the next bullish leg resumes.
Intraday Trade Zones (Elliott-Based)
🟩 BUY ZONE: 4145 – 4147 | SL 4138
Looking for completion of wave C and bullish reversal confirmation (BOS or mitigation from demand block).
Targets: 4205 → 4230 → 4250
🟥 SELL ZONE: 4245 – 4243 | SL 4252
Scalp opportunity aligning with potential wave B retest or short-term overextension before larger correction.
Targets: 4180 → 4150
📌 Summary
Gold remains technically bullish after completing a 5-wave structure but is currently digesting gains through a corrective ABC phase. The 4145–4147 discount zone serves as a high-probability wave C completion area, especially if PPI data softens USD momentum.
Wait for structure confirmation before entering, and monitor the PPI release as it may dictate whether gold extends higher or deepens its correction.

GRMOVER Price ActionGRM Overseas Ltd is trading around ₹366 as of September 9, 2025, following a mild intraday uptrend after opening at ₹362 and reaching a high of ₹366.95. The market capitalization is close to ₹2,200 crore, with the share price well supported in the upper range of its yearly performance, having moved from a 52-week low of ₹175.90 to a high of ₹397.65.
The company’s core business in branded and non-branded basmati rice exports and domestic sales has delivered robust annual revenues of over ₹1,300 crore. Profitability metrics remain stable, with a price-to-earnings ratio of 35.5, slightly higher than the sector average, reflecting market optimism for growth. Operational leverage is evident from the healthy asset turnover ratio above 2, while debt levels remain negligible, supporting a strong balance sheet.
Shareholding patterns show promoter ownership at 70.8%, foreign institution participation rising over recent quarters, and retail holding close to 27%. Trading volumes and delivery percentages indicate active investor interest. Despite somewhat muted profit growth, GRM Overseas continues to invest in capacity and product expansion, positioning itself for steady sectoral growth. Technical indicators suggest support near current levels; however, volatility remains possible in the event of broader market swings.

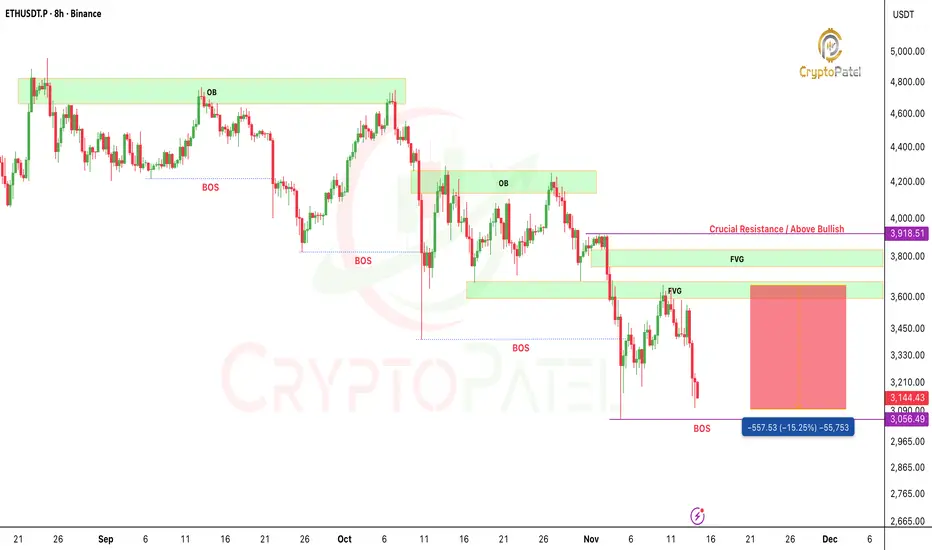
ETHEREUM Bearish Target achieved CRYPTOCAP:ETH has tapped the $3150–$3110 zone, a clean 15% move from our premium setup.
Perfect FVG fill + redistribution structure.
Huge profits for those who executed. Liquidity continues to lead.
NFA & DYOR
BUY TODAY SELL TOMORROW for 5%DON’T HAVE TIME TO MANAGE YOUR TRADES?
- Take BTST trades at 3:25 pm every day
- Try to exit by taking 4-7% profit of each trade
- SL can also be maintained as closing below the low of the breakout candle
Now, why do I prefer BTST over swing trades? The primary reason is that I have observed that 90% of the stocks give most of the movement in just 1-2 days and the rest of the time they either consolidate or fall
Resistance Breakout in
PARAS
BUY TODAY SELL TOMORROW for 5%

BUY TODAY SELL TOMORROW for 5%DON’T HAVE TIME TO MANAGE YOUR TRADES?
- Take BTST trades at 3:25 pm every day
- Try to exit by taking 4-7% profit of each trade
- SL can also be maintained as closing below the low of the breakout candle
Now, why do I prefer BTST over swing trades? The primary reason is that I have observed that 90% of the stocks give most of the movement in just 1-2 days and the rest of the time they either consolidate or fall
Round Bottom & Retested Breakout in
HEMIPROP
BUY TODAY SELL TOMORROW for 5%

BUY TODAY SELL TOMORROW for 5%DON’T HAVE TIME TO MANAGE YOUR TRADES?
- Take BTST trades at 3:25 pm every day
- Try to exit by taking 4-7% profit of each trade
- SL can also be maintained as closing below the low of the breakout candle
Now, why do I prefer BTST over swing trades? The primary reason is that I have observed that 90% of the stocks give most of the movement in just 1-2 days and the rest of the time they either consolidate or fall
Trendline Support in BORORENEW
BUY TODAY SELL TOMORROW for 5%
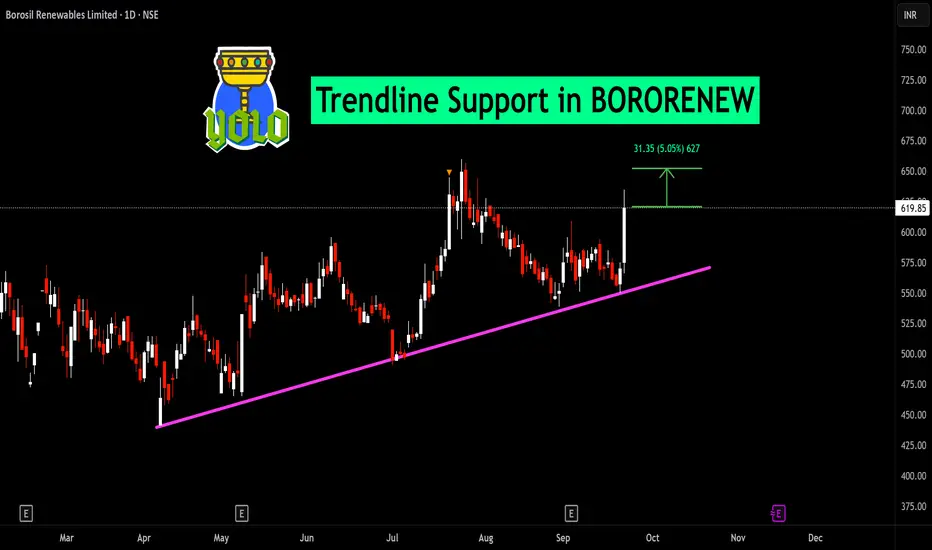
BUY TODAY SELL TOMORROW for 5%DON’T HAVE TIME TO MANAGE YOUR TRADES?
- Take BTST trades at 3:25 pm every day
- Try to exit by taking 4-7% profit of each trade
- SL can also be maintained as closing below the low of the breakout candle
Now, why do I prefer BTST over swing trades? The primary reason is that I have observed that 90% of the stocks give most of the movement in just 1-2 days and the rest of the time they either consolidate or fall
Trendline Breakout in MTARTECH
BUY TODAY SELL TOMORROW for 5%

BUY TODAY SELL TOMORROW for 5%DON’T HAVE TIME TO MANAGE YOUR TRADES?
- Take BTST trades at 3:25 pm every day
- Try to exit by taking 4-7% profit of each trade
- SL can also be maintained as closing below the low of the breakout candle
Now, why do I prefer BTST over swing trades? The primary reason is that I have observed that 90% of the stocks give most of the movement in just 1-2 days and the rest of the time they either consolidate or fall
Trendline Breakout in PRIVISCL
BUY TODAY SELL TOMORROW for 5%

BUY TODAY SELL TOMORROW for 5%DON’T HAVE TIME TO MANAGE YOUR TRADES?
- Take BTST trades at 3:25 pm every day
- Try to exit by taking 4-7% profit of each trade
- SL can also be maintained as closing below the low of the breakout candle
Now, why do I prefer BTST over swing trades? The primary reason is that I have observed that 90% of the stocks give most of the movement in just 1-2 days and the rest of the time they either consolidate or fall
Inverted Head & Shoulder Breakout in TATVA
BUY TODAY SELL TOMORROW for 5%

BUY TODAY SELL TOMORROW for 5%DON’T HAVE TIME TO MANAGE YOUR TRADES?
- Take BTST trades at 3:25 pm every day
- Try to exit by taking 4-7% profit of each trade
- SL can also be maintained as closing below the low of the breakout candle
Now, why do I prefer BTST over swing trades? The primary reason is that I have observed that 90% of the stocks give most of the movement in just 1-2 days and the rest of the time they either consolidate or fall
Trendline Breakout in KIRLOSENG

BUY TODAY SELL TOMORROW for 5% DON’T HAVE TIME TO MANAGE YOUR TRADES?
- Take BTST trades at 3:25 pm every day
- Try to exit by taking 4-7% profit of each trade
- SL can also be maintained as closing below the low of the breakout candle
Now, why do I prefer BTST over swing trades? The primary reason is that I have observed that 90% of the stocks give most of the movement in just 1-2 days and the rest of the time they either consolidate or fall
Trendline Breakout in RAJRATAN
BUY TODAY SELL TOMORROW for 5%
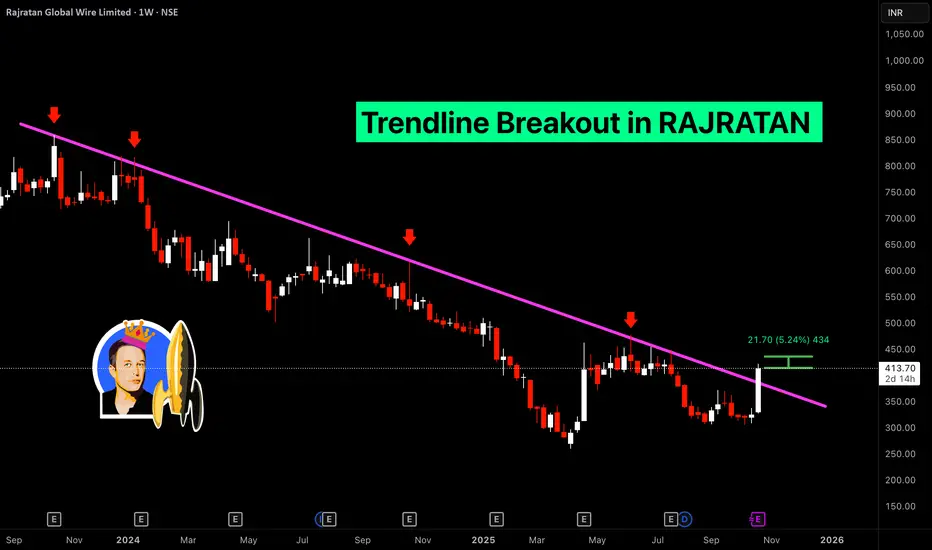
BUY TODAY SELL TOMORROW for 5%DON’T HAVE TIME TO MANAGE YOUR TRADES?
- Take BTST trades at 3:25 pm every day
- Try to exit by taking 4-7% profit of each trade
- SL can also be maintained as closing below the low of the breakout candle
Now, why do I prefer BTST over swing trades? The primary reason is that I have observed that 90% of the stocks give most of the movement in just 1-2 days and the rest of the time they either consolidate or fall
Resistance Breakout in PSPPROJECT
BUY TODAY SELL TOMORROW for 5%

Gold Faces Rejection at Resistance Zone – Potential Bearish CorrAnalysis:
The gold price (XAU/USD) is currently testing a strong resistance zone near $4,235–$4,240, where previous bullish momentum appears to be slowing down. Sellers are showing interest in this area, suggesting a potential bearish reversal or correction phase.
A clear support zone lies around $4,140–$4,150, which serves as the target for the expected downward move. If price breaks below this support, further declines could extend toward the next demand zone.
However, if gold breaks and closes above the resistance zone with strong volume, it could invalidate this bearish setup and open the path to new highs.
Key Points:
Resistance Zone: $4,235 – $4,240
Support Zone: $4,140 – $4,150
Short-term Bias: Bearish correction expected
Target: Support zone near $4,145

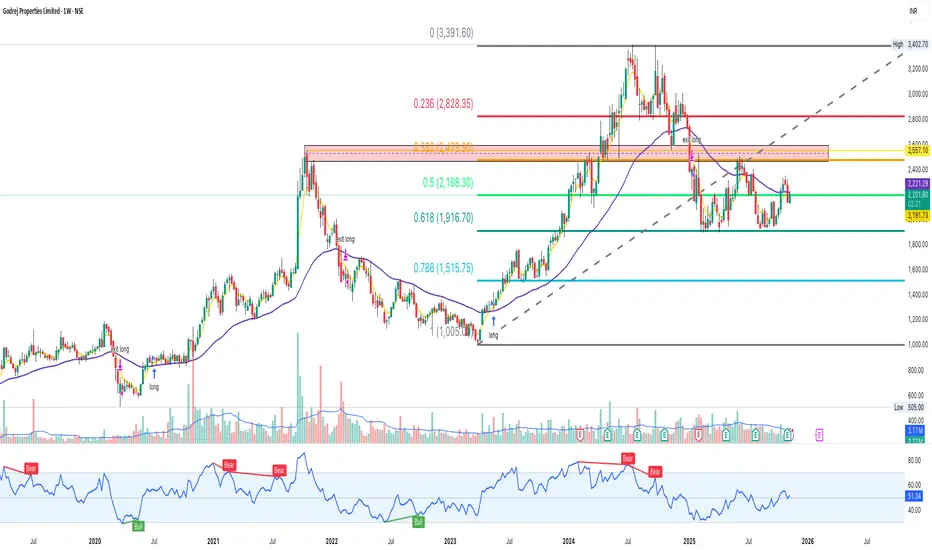
Godrej Properties #Screener — Hold Fib Levels After CorrectionGodrej Properties (NSE: GODREJPROP) is stabilising after a prolonged correction from the ₹3400 zone.
The stock has held key Fibonacci retracement levels and is now forming a base between ₹1900–₹2250 — a critical structure zone for trend continuation.
This behaviour is typical of strong mid-large caps that correct deeply, reset sentiment, and then rebuild a trend.
📌 Structure Highlights
Held 0.618 retracement (₹1916) perfectly — strong long-term support
0.50 level ₹2198 reclaimed → bullish sign
Price still below major supply around ₹2479–2557 (orange box)
Higher lows forming since the ₹1005 bottom
Trendline support from 2023 still valid (grey dotted line)
RSI showing slow momentum recovery after bearish cycle
📌 Key Levels to Track
Support Zones:
₹2190
₹1916 (major Fibonacci support)
₹1515 (0.786) — deeper trend support
Resistance Zones:
₹2221 (near-term resistance)
₹2479–2557 (strong supply zone)
₹2828 (0.236 retracement)
₹3390–3400 (major ATH resistance)
A clean weekly close above ₹2479–2557 would unlock higher trend continuation.
📌 Technical Snapshot
✅ Holding major Fibonacci structure
✅ Trendline support intact
✅ Slow volume expansion near base
✅ Higher lows forming
✅ Recovery setup, not breakout-chasing
Bias stays neutral to bullish above ₹1916, turning stronger above ₹2221.
📌 View
The stock is in a large consolidation zone after a strong multi-year rally.
Watching for a breakout from the ₹2479–2557 supply region to confirm trend continuation.
📒 Educational market structure analysis — not investment advice.
XAU/USD – Gold Slightly Adjusts, Monitoring Pullback to Support Hook: XAU/USD – Gold Slightly Adjusts, Monitoring Pullback to Support 4,151 USD
Body: 📊 Market Structure
After the Break of Structure (BoS) at the 4,208 USD region, gold confirms the continuation of the upward trend and is forming a technical adjustment.
The price has touched the Resistance Zone 4,208 – 4,237 USD and is currently adjusting as expected, heading towards the Support Zone 4,151 USD – which previously created an impulsive move.
Below Support 4,151, there is a strong OB at 4,104 USD.
As long as the price does not break deeply below 4,104 USD, the bullish structure remains intact.
💎 Key Technical Zones
• Resistance Zone: 4,208 – 4,237 USD → supply area + where a downward reaction occurs
• Support Zone: 4,151 USD → area awaiting upward reaction
• Strong OB + Support: 4,104 – 4,110 USD → base of the upward structure
• Liquidity Zone (Target): 4,260+ USD → next wave expansion area
🎯 Trading Plan
1️⃣ BUY Setup – Trend-following priority
If the price adjusts correctly to discount areas:
• Entry 1: 4,151 USD
• Entry 2: 4,104 USD (best area – confluence OB)
SL: below 4,090 USD
TP1: 4,208
TP2: 4,237
TP3: 4,260
→ Main strategy: wait for pullback → re-enter the upward wave → follow the strong trend.
2️⃣ SELL Scalp – Reaction at Resistance (counter-trend)
If the price retests the 4,208 – 4,237 area and creates a clear rejection:
Entry: 4,218 – 4,230
SL: 4,245
TP1: 4,180
TP2: 4,151
→ Setup only for flexible traders, short trades, no holding positions.
🧠 Vincent’s View
The current structure is very precise:
Impulsive Move → Short-term Distribution → Pullback to Support → Continue upward wave.
The 4,151 USD area is the focal point to observe.
The 4,104 USD area is the best BUY area if the market wants to hunt deeper liquidity.
As long as the price does not break 4,104 USD, buyers still hold the entire advantage.
