AXISBANK 1 Week Time Frame 📈 Current Price Context
Axis Bank is trading around ₹1,300–₹1,305 range recently.
🔑 1‑Week Pivot & Key Levels
These levels are commonly used by traders to identify likely reversal zones or breakouts for the week ahead:
🔥 Weekly Resistance (Upside Targets)
1. R1: ~₹1,317–₹1,320 – First resistance zone this week.
2. R2: ~₹1,341–₹1,342 – Next resistance zone if bullish momentum continues.
3. R3: ~₹1,370+ (approx) – Major higher resistance for breakout scenario.
👉 Bullish condition: Week closes above ₹1,317–₹1,320 with volume → look for extended upside moves toward ₹1,340+.
🛡️ Weekly Support (Downside Floors)
1. S1: ~₹1,262–₹1,265 – Near‑term support for the week.
2. S2: ~₹1,230 – Mid‑range support if breakdown below first support happens.
3. S3: ~₹1,206 – Broader downside support level.
👉 Bearish condition: Cleared break below ₹1,262–₹1,265 may accelerate downside toward ₹1,230 → ₹1,206.
📊 Support/Resistance (Pivot‑Based Technical)
From short‑term pivot derivations (daily/weekly calculations):
Resistance
R1: ~₹1,306–₹1,307
R2: ~₹1,319–₹1,320
R3: ~₹1,329–₹1,330
Support
S1: ~₹1,284–₹1,285
S2: ~₹1,274–₹1,275
S3: ~₹1,261–₹1,262
These extra pivot levels (especially R1/R2/S1/S2) help fine‑tune next day or mid‑week entries.
📌 How to Use This Weekly Level View
📈 Bullish Scenario
Hold above ₹1,317–₹1,320 zone
Short‑term resistance becomes support on breakout
Targets → ₹1,340 → ₹1,373+
📉 Bearish Scenario
Close below ₹1,262–₹1,265
Potential decline toward ₹1,230 → ₹1,206 zones
📊 Consolidation Range
If price stays between ₹1,262–₹1,320 → expect range‑bound trading for the week.
Chart Patterns

Chart PatternsChart patterns are visual formations on a price chart that reflect the collective behavior of market participants. These formations reveal the underlying psychology of buyers and sellers and help traders anticipate potential price movements. Whether you trade equities, derivatives, or index futures like Nifty or GIFT Nifty, chart patterns remain one of the most valuable tools for technical analysis. They help you read structure, recognize trend strength, identify reversals, and understand volume-based confirmation.
Broadly, chart patterns fall into three categories:
Reversal Patterns
Continuation Patterns
Bilateral Patterns

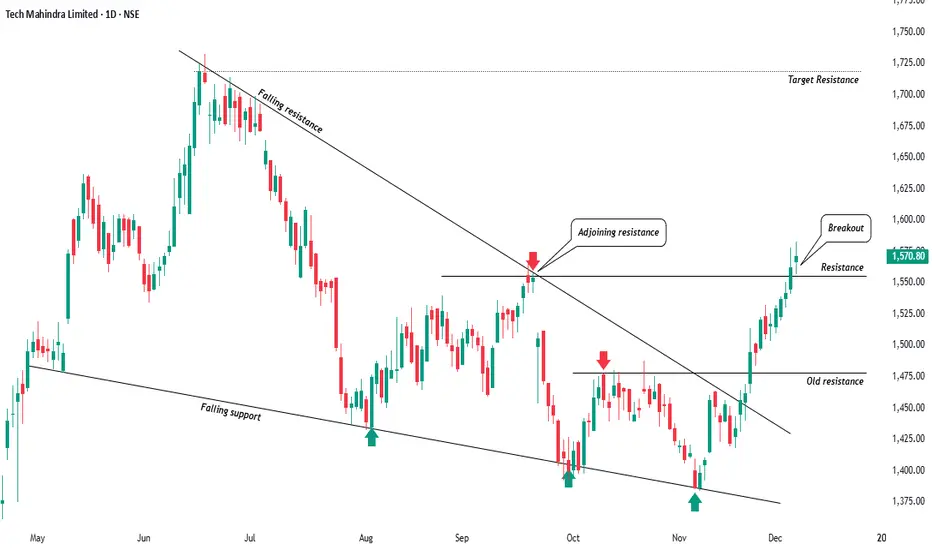
Techm Wakes Up! Reversal CandidateHi Traders! Hope all you are doing well and doing good trades, So today I am sharing a clean technical setup which I’ve been tracking for weeks Tech Mahindra has finally given breakout from a multi-month falling wedge along with a horizontal resistance flip. The structure is now turning bullish, and the chart tells a very clear story.
Chart Observations-:
Falling Wedge Structure (May–Nov).
Price continued making lower highs and lower lows inside a narrowing wedge.
Both falling resistance and falling support have been respected multiple times.
Repeated bounces from the lower trendline (green arrows) indicate accumulation.
First Breakout Attempt – Rejection-:
Price attempted a breakout near the adjoining resistance in September.
Sharp rejection followed (red arrow), keeping the wedge intact.
This rejection later acted as a reference level for the final breakout.
Final Breakout with Strong Momentum-:
In early December, price decisively broke above the wedge’s falling resistance.
Breakout candles are wide-bodied and supported by rising volumes a strong technical sign.
Horizontal Resistance Flip-:
The stock crossed the old resistance zone near 1475 and then sustained above it.
This zone has now flipped into support, confirming bullish continuation.
The next major Target Resistance sits in the 1680–1720 region the logical wedge target projected from pattern height and price resistance too.
Technical Summary-
Pattern: Falling Wedge (bullish reversal)
Breakout: Clean and decisive
Market Structure: Lower-highs broken → Higher-highs forming
Resistance target: 1720
View: Bullish as long as price sustains above recent breakout zone.
This is one of those setups where price action aligns perfectly with classical charting principles.
Target is nearby 11% from current price so 1:2 Risk to reward looks good for me, Rest I will update the idea accordingly guys.
Thanks for reading.
Regards- Amit.
Algorithmic Trading: The Future of Financial MarketsUnderstanding Algorithmic Trading
Algorithmic trading refers to the use of computer programs and predefined rules to automatically place buy and sell orders in financial markets. These rules are based on factors such as price, volume, time, technical indicators, statistical models, or even artificial intelligence and machine learning. Once the algorithm is deployed, it can monitor markets and execute trades without human intervention.
The core idea behind algo trading is efficiency. Computers can process vast amounts of data, identify patterns, and execute trades far faster and more accurately than any human trader. In markets where milliseconds can determine profit or loss, this speed provides a decisive edge.
Why Algo Trading Is Gaining Dominance
One of the main reasons algorithmic trading is shaping the future is its ability to eliminate emotional decision-making. Human traders are often influenced by fear, greed, overconfidence, or panic, especially during volatile market conditions. Algorithms, on the other hand, strictly follow predefined rules. They do not panic during market crashes or become overly optimistic during rallies, leading to more disciplined and consistent execution.
Another key factor is speed. Modern financial markets generate enormous volumes of data every second. Algo trading systems can scan multiple markets simultaneously, react instantly to price changes, and execute trades in fractions of a second. This speed is impossible for manual traders to match and is critical in strategies such as arbitrage and high-frequency trading.
Accuracy and precision also play a vital role. Algorithms can place orders at exact price levels, manage position sizes precisely, and adhere strictly to risk management rules. This reduces errors such as incorrect order sizes or missed entry and exit points, which are common in manual trading.
Cost Efficiency and Scalability
Algorithmic trading significantly reduces transaction and operational costs. By automating trade execution, firms and individual traders can minimize reliance on large trading teams. Lower costs translate into improved profitability, especially for institutions that execute thousands or millions of trades daily.
Scalability is another major advantage. Once an algorithm is developed and tested, it can be applied across multiple instruments, markets, and timeframes with minimal additional effort. A single strategy can be deployed simultaneously in equities, commodities, currencies, and derivatives, something that would be extremely difficult for a human trader to manage manually.
Data-Driven Decision Making
The future of trading is deeply rooted in data, and algorithmic trading thrives on it. Algorithms can analyze historical price data, order flow, news sentiment, macroeconomic indicators, and alternative data sources such as social media or satellite imagery. This data-driven approach allows traders to uncover patterns and opportunities that are invisible to the naked eye.
With the rise of artificial intelligence and machine learning, algo trading systems are becoming even more sophisticated. These systems can learn from past performance, adapt to changing market conditions, and continuously improve their strategies. This adaptability is crucial in markets that are constantly evolving.
Role of Algo Trading in Market Liquidity
Algorithmic trading has also improved overall market liquidity. By continuously placing buy and sell orders, algorithms ensure that there are always participants in the market. This leads to tighter bid-ask spreads, lower transaction costs, and smoother price discovery. For long-term investors and retail traders, this increased liquidity makes markets more efficient and accessible.
While there are concerns that algo trading can amplify volatility during extreme events, regulatory frameworks and risk controls have evolved to address these issues. Circuit breakers, position limits, and monitoring systems help ensure market stability while still allowing technological innovation.
Accessibility for Retail Traders
Earlier, algorithmic trading was largely the domain of large institutions and hedge funds due to high costs and technical complexity. Today, this barrier is rapidly disappearing. Online trading platforms, application programming interfaces (APIs), cloud computing, and open-source tools have made algo trading accessible to retail traders as well.
Retail traders can now build, test, and deploy strategies using technical indicators, price action, or quantitative models without needing massive infrastructure. This democratization of technology is another reason algo trading represents the future—it levels the playing field and allows skill and strategy to matter more than size alone.
Risk Management and Consistency
Effective risk management is at the heart of long-term trading success, and algorithmic systems excel in this area. Algorithms can enforce strict stop-loss rules, position sizing formulas, and portfolio diversification constraints. They can also monitor risk exposure in real time and adjust positions automatically when market conditions change.
Consistency is equally important. Human traders may deviate from their plans due to stress or overtrading, but algorithms execute strategies exactly as designed. This consistency makes performance more measurable, repeatable, and scalable over time.
Challenges and the Road Ahead
Despite its advantages, algorithmic trading is not without challenges. Poorly designed algorithms, over-optimization, and lack of proper testing can lead to significant losses. Markets are dynamic, and strategies that work today may fail tomorrow if not updated. Therefore, continuous monitoring, evaluation, and improvement are essential.
Cybersecurity, technological failures, and regulatory compliance are also critical considerations. As reliance on technology increases, so does the need for robust systems and ethical market practices.
Conclusion
Algorithmic trading is not just a trend—it is a fundamental shift in how financial markets operate. Its speed, efficiency, discipline, and data-driven nature make it ideally suited for modern markets characterized by high volumes, complexity, and competition. As technology continues to advance, algo trading will become even more intelligent, adaptive, and accessible.
For institutions, traders, and investors who embrace this transformation, algorithmic trading offers a powerful way to stay competitive and manage risk effectively. While human insight and oversight will always remain important, the future of trading clearly belongs to algorithms working alongside human intelligence.

Earnings Season Trading: Opportunities, Risks, and StrategiesWhat Is Earnings Season and Why It Matters
Earnings season typically occurs four times a year, following the end of each financial quarter. In India, major earnings seasons usually unfold in April, July, October, and January. During this period, companies announce their financial performance, including earnings per share (EPS), revenue, margins, debt levels, and management commentary. Markets react not only to whether results are good or bad, but also to how they compare with expectations already priced into the stock.
Stock prices are forward-looking. This means a company can report strong earnings and still see its share price fall if results fail to meet market expectations. Conversely, a company with weak numbers may rally if the outcome is “less bad” than anticipated or if guidance improves. This expectation-versus-reality dynamic makes earnings season particularly powerful for short-term traders.
Volatility: The Core Feature of Earnings Trading
The defining characteristic of earnings season trading is volatility. Stocks often experience sharp price gaps on the day results are announced, especially if the earnings surprise is significant. These gaps can occur upward or downward and may range from a few percent to double-digit moves in extreme cases. For intraday traders, this volatility creates momentum-based opportunities, while swing traders look to capture post-earnings trends that may last days or weeks.
However, volatility cuts both ways. Sudden adverse moves can trigger stop-losses or cause significant losses if risk is not controlled. Therefore, earnings trading demands disciplined position sizing, predefined exit strategies, and an understanding that outcomes can be unpredictable.
Earnings Expectations and Market Psychology
A critical element of earnings season trading is market psychology. Analysts issue earnings estimates well in advance, and these numbers shape investor expectations. Traders closely monitor consensus EPS, revenue forecasts, and “whisper numbers” circulating in the market. The stock’s price movement before earnings often reflects these expectations, with rallies signaling optimism and declines indicating caution.
During earnings season, traders focus on three major aspects: actual results, comparison with estimates, and management guidance. Among these, guidance often has the strongest influence because it affects future valuations. A company beating estimates but lowering future guidance may still face selling pressure, while a modest miss combined with strong forward outlook can trigger buying interest.
Common Earnings Season Trading Strategies
Several strategies are commonly used during earnings season. One approach is pre-earnings momentum trading, where traders ride the price trend leading up to the results, exiting positions before the announcement to avoid uncertainty. This strategy benefits from speculation and anticipation but avoids overnight risk.
Another method is post-earnings reaction trading, where traders wait for results and then trade based on the market’s reaction. This reduces uncertainty and allows traders to align with confirmed momentum, though the initial move may already be partially priced in.
Derivative traders often use options-based strategies such as straddles, strangles, or spreads to benefit from volatility rather than direction. These strategies aim to profit from large price swings regardless of whether the stock moves up or down, but they require a solid understanding of implied volatility and option pricing.
Sector and Index-Level Impact
Earnings season does not affect all stocks equally. Heavyweight companies in sectors like banking, IT, FMCG, and metals can significantly influence broader indices such as the Nifty 50 or Sensex. Strong results from large banks or IT firms can lift the entire market, while disappointments can drag indices lower even if other stocks perform well.
Traders often analyze sector-wide earnings trends to identify leadership or weakness. For example, if multiple companies in a sector report margin expansion and strong demand, traders may adopt bullish positions across that sector. Conversely, widespread earnings downgrades may signal structural issues, prompting defensive or short-selling strategies.
Risk Management During Earnings Season
Risk management is especially important during earnings season trading. Price gaps can bypass stop-loss orders, leading to slippage. To manage this, traders often reduce position sizes, avoid holding leveraged positions overnight, or hedge exposure using options. Clear risk-reward ratios and strict discipline help protect capital during unpredictable market reactions.
Another important practice is avoiding overtrading. The abundance of opportunities during earnings season can tempt traders to take excessive positions. Successful traders focus on high-quality setups rather than chasing every earnings announcement.
Long-Term Perspective vs Short-Term Trading
While earnings season is popular among short-term traders, long-term investors also use this period to reassess portfolio holdings. Consistent earnings growth, improving margins, and strong guidance reinforce long-term investment theses. For traders, understanding this long-term context helps interpret short-term price movements more accurately.
A stock that corrects sharply after earnings may offer opportunities if the long-term fundamentals remain intact. Conversely, a sharp rally driven purely by short-term enthusiasm may fade if earnings quality is weak.
Conclusion
Earnings season trading is a powerful but demanding aspect of the stock market. It offers unique opportunities driven by volatility, expectations, and market psychology, but it also carries heightened risks. Successful earnings traders combine fundamental understanding with technical analysis, focus on expectations rather than headlines, and practice strict risk management. Whether trading stocks, indices, or derivatives, mastering earnings season dynamics can significantly enhance a trader’s ability to navigate markets with confidence and discipline.

Algorithmic AI Trading Strategies: Transforming Modern Markets1. Meaning of Algorithmic AI Trading
Algorithmic AI trading refers to the use of computer programs powered by AI to execute trades based on predefined rules and adaptive learning models.
Unlike traditional algorithmic trading, AI-based systems can learn from historical and real-time data, improving decisions over time.
These strategies reduce emotional bias and enable data-driven decision-making.
2. Core Components of AI Trading Strategies
Data Collection: Market prices, volume, order book data, news, social media sentiment, and macroeconomic indicators.
Data Processing: Cleaning, normalization, and feature extraction for accurate analysis.
AI Models: Machine learning, deep learning, reinforcement learning, and neural networks.
Execution Engine: Automatically places, modifies, and exits trades at optimal prices.
Risk Management Module: Controls exposure, position sizing, and drawdowns.
3. Types of Algorithmic AI Trading Strategies
Trend-Following Strategies:
AI identifies price momentum and trends using historical patterns.
Trades are placed in the direction of the prevailing trend.
Mean Reversion Strategies:
AI assumes prices revert to historical averages.
Trades are triggered when prices deviate significantly from the mean.
Arbitrage Strategies:
AI detects price inefficiencies across markets or instruments.
Executes simultaneous buy and sell orders to lock risk-free or low-risk profits.
Market-Making Strategies:
AI places buy and sell orders continuously to capture bid-ask spreads.
Requires ultra-low latency and precise risk control.
Sentiment-Based Strategies:
AI analyzes news, earnings reports, and social media sentiment.
Trades are aligned with positive or negative market sentiment signals.
4. Role of Machine Learning in Trading
Supervised Learning:
Uses labeled data to predict price direction or volatility.
Unsupervised Learning:
Identifies hidden patterns, clusters, and market regimes.
Reinforcement Learning:
AI learns by trial and error, optimizing strategies through rewards and penalties.
Deep Learning:
Neural networks analyze complex, non-linear relationships in market data.
5. Strategy Development Process
Idea Generation: Identifying inefficiencies or repeatable patterns.
Backtesting: Testing strategies on historical data to evaluate performance.
Optimization: Fine-tuning parameters to improve risk-adjusted returns.
Paper Trading: Simulating trades in real-time without real money.
Live Deployment: Executing strategies in real market conditions.
6. Risk Management in AI Trading
Position Sizing: Limits capital allocation per trade.
Stop-Loss Mechanisms: Automatically exit losing trades.
Diversification: Trading across multiple assets and strategies.
Drawdown Control: Prevents excessive losses during adverse market phases.
Model Risk Monitoring: Detects when AI models stop performing effectively.
7. Advantages of Algorithmic AI Trading
Speed and Efficiency: Executes trades in milliseconds.
Emotion-Free Trading: Eliminates fear, greed, and hesitation.
Scalability: Can trade multiple markets simultaneously.
Consistency: Follows rules strictly without deviation.
Data Utilization: Analyzes vast datasets beyond human capability.
8. Limitations and Challenges
Overfitting Risk: Models may perform well historically but fail in live markets.
Data Quality Issues: Poor data can lead to inaccurate signals.
Market Regime Changes: AI models may struggle during unexpected events.
High Infrastructure Costs: Requires powerful hardware and low-latency systems.
Regulatory Constraints: Compliance with market regulations is essential.
9. Ethical and Regulatory Considerations
Market Fairness: High-frequency AI trading can disadvantage retail traders.
Transparency: Black-box AI models are difficult to interpret.
Risk of Flash Crashes: Rapid automated trading can amplify volatility.
Regulatory Oversight: Authorities monitor algorithmic trading to prevent manipulation.
10. Role of AI Trading in Retail vs Institutional Markets
Institutional Traders:
Use advanced AI systems with large datasets and capital.
Focus on high-frequency and statistical arbitrage strategies.
Retail Traders:
Use simplified AI tools, bots, and platforms.
Emphasize swing trading, trend-following, and signal-based automation.
11. Integration with Other Technologies
Cloud Computing: Enables scalable data processing and storage.
Big Data Analytics: Enhances pattern recognition and forecasting.
Blockchain Integration: Improves transparency and settlement efficiency.
APIs and Trading Platforms: Allow seamless execution and monitoring.
12. Future of Algorithmic AI Trading
AI systems will become more adaptive and self-learning.
Greater use of alternative data such as satellite images and web traffic.
Improved explainable AI models for better transparency.
Increased regulatory frameworks to ensure market stability.
Wider adoption among retail traders through user-friendly platforms.
13. Conclusion
Algorithmic AI trading strategies represent a major evolution in financial markets.
They enhance efficiency, accuracy, and scalability of trading operations.
Despite challenges, proper risk management and ethical practices can make AI trading sustainable.
As technology advances, AI-driven strategies will continue to redefine how markets operate and how traders participate globally.

Banknifty 15min TrendlineOn the 15-minute timeframe, Bank Nifty is forming a rising support trend line. Price is repeatedly taking support near this line, showing buying interest at lower levels. As long as this support holds, the short-term structure remains positive. A break below this support line may lead to quick downside, while holding above it can support a bounce or continuation move.

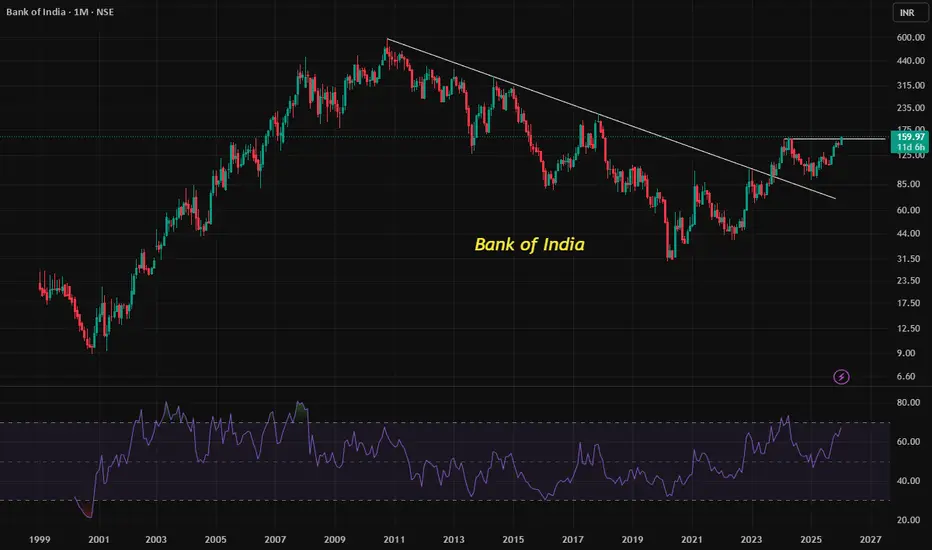
Understanding Long-Term Breakouts & RSI Strength in Stock TrendUnderstanding Long-Term Breakouts and RSI Strength in Stock Trends : Base Chart BANK OF INDIA (BANKINDIA)
📈 Long-Term Downtrend Breakout
A long-term downtrend line represents a period where a stock has consistently moved lower, connecting its major peaks over months or years.
When a stock breaks above this line, it signals a potential end to prolonged weakness.
This breakout often attracts new buyers, as it suggests the stock may be entering a fresh bullish phase.
Importantly, the breakout is not just about crossing the line—it must be sustained above it to confirm strength. Temporary moves above the line without follow-through are often false signals.
🔑 Importance of Sustaining Above the Breakout
Sustaining above the breakout level shows follow-up buying interest:
It means investors are not just reacting to the breakout but are continuing to accumulate the stock.
This sustained action builds confidence that the breakout is genuine and not a short-lived spike.
In technical analysis, this is often referred to as confirmation of breakout strength.
📊 Uptrend Formation in Interim Trends
After a breakout, the stock’s behavior in shorter-term trends (weekly or monthly swings) becomes crucial.
Formation of higher highs and higher lows in interim trends is a classic sign of an uptrend.
This pattern reflects consistent demand, where buyers step in at higher levels each time.
For traders, this is a positive sign that the stock is not just stabilizing but actively building momentum.
💡 RSI as a Strength Indicator
The Relative Strength Index (RSI) is a momentum oscillator that measures the speed and change of price movements.
RSI above 50 generally indicates bullish momentum, while below 50 suggests bearishness.
In this case, RSI has stayed above 50 since 2022, showing persistent strength.
Recently, RSI moving above 60 adds further conviction, signaling additional buying interest and stronger momentum.
Sustained RSI levels above 60 often align with healthy uptrends, reinforcing the bullish outlook.
📝 Key Takeaways
Breakout of a long-term downtrend marks a potential shift from weakness to strength.
Sustaining above breakout levels confirms genuine buying interest and reduces the risk of false signals.
Higher highs in interim trends reflect continued demand and a strong uptrend formation.
RSI above 50 and rising above 60 highlights persistent and growing buyer enthusiasm.
Together, these factors suggest that the stock is not only recovering but also building a strong foundation for continued upward movement.
$XRP PRICE PREDICTION | MULTI-YEAR BREAKOUT TOWARD $10+?CRYPTOCAP:XRP is trading above a confirmed multi-year breakout zone on the higher timeframe after completing a long accumulation phase.
Price has already delivered a strong expansion move and is now building structure for the next leg higher.
TECHNICAL OVERVIEW (HTF):
✔ Descending Wedge Breakout (2020–2024)
✔ 600%+ Expansion From $0.60 Breakout
✔ Fair Value Gap / Accumulation Zone: $1.30 – $1.90
✔ Higher-Timeframe Bullish Structure Intact
✔ Bullish Bias While Price Holds Above $1.30
TARGETS (CryptoPatel): $3.50 / $5.00 / $8.70 / $10+
INVALIDATION:
❌ HTF Close Below $1.30
Technical analysis only. Not financial advice. DYOR.

NIFTY 50 - PRE OPEN ANALYSISThe broader market looks weak and futures are trading discounted. Expecting a down move below the frames and retest 25475 today. Fingers crossed.

Nifty Trading Strategy for 19th January 2026📊 NIFTY Intraday Trade Setup (15-Minute Timeframe)
⚠️ Trade only after a 15-minute candle CLOSE confirms the level. Avoid premature entries.
🟢 BUY SETUP (Bullish Breakout)
➡️ Condition:
• Buy only if a 15-minute candle closes above 25,768
🎯 Targets:
• T1: 25,820
• T2: 25,845
• T3: 25,878
📌 Explanation:
• A close above 25,768 indicates strength and bullish continuation
• Momentum traders can trail SL after T1 is achieved
• Best suited when overall market sentiment is positive
🔴 SELL SETUP (Bearish Breakdown)
➡️ Condition:
• Sell only if a 15-minute candle closes below 25,603
🎯 Targets:
• T1: 25,570
• T2: 25,535
• T3: 25,499
📌 Explanation:
• A close below 25,603 confirms weakness and selling pressure
• Partial profit booking is advised at each target
• Watch for volatility during breakdown
⏰ Important Trading Notes:
• Trade with strict risk management
• Avoid trades during high-impact news events
• Use proper stop-loss based on your risk appetite
• This setup is for intraday traders only
⚠️ DISCLAIMER:
This analysis is shared for educational purposes only.
I am NOT a SEBI registered advisor.
Stock market investments are subject to market risk.
Please consult your financial advisor before taking any trade.
I am not responsible for any profit or loss arising from this view.
📈 Trade with discipline. Protect capital first.

RELIANCE : Analysis and Prediction
Timeframe: 1D
Structure: ABC corrective structure within a broader range
Current Price Zone: ~₹1,458
Market Phase: Post-distribution correction from extended retracement highs
🔍 Big Picture Market Structure (Educational View)
Reliance has completed a strong impulsive upmove, followed by profit booking from an extended Fibonacci retracement zone (113%–127%), which is clearly visible near the recent highs.
This behavior is textbook market psychology:
Smart money distributes positions near extended projections
Late buyers enter near highs
Price then corrects to value zones, where demand is reassessed
The chart now reflects a classic ABC correction:
Wave A: Sharp rejection from supply zone
Wave B: Temporary bounce (short covering + dip buying)
Wave C: Ongoing corrective leg testing demand
📐 Why These Levels Matter (Trading Psychology Explained)
🔴 Supply Zone: ₹1,580–1,610 (113%–127%)
This zone triggered strong selling because:
Long-term holders booked profits
Institutions reduced risk at stretched valuations
Breakout buyers were trapped
📌 Extended Fibonacci zones often act as exhaustion points.
🟡 Golden Support Zone: ₹1,398–1,476 (50%–78.6%)
This zone is critical because:
It represents fair value retracement of the prior rally
Dip buyers and positional traders look for re-entry here
Short sellers start covering partially
🧠 Markets frequently pause or bounce here due to a balance between fear (from longs) and greed (from value buyers).
🔵 Lower Extended Support: ₹1,267–1,305 (127%–113%)
If the golden zone fails:
Confidence of dip buyers weakens
Panic selling increases
Price seeks deeper liquidity
📉 This is where only high-conviction buyers step in.
🟢 Bullish Reaction Scenario (Base Case)
If price:
Holds above ₹1,398–1,420
Shows stabilization (small candles / higher lows)
Then:
First recovery toward ₹1,476 (50%)
Further bounce possible toward ₹1,580
Momentum buyers re-enter above broken VWAP zones
📈 This would be a corrective bounce, not a fresh trend yet.
🔴 Bearish Continuation Scenario (Risk Case)
If price:
Fails to sustain above ₹1,398
Closes decisively below this zone
Then:
Downside opens toward ₹1,305 → ₹1,267
Breakdown reflects loss of confidence by dip buyers
Sentiment shifts from “buy the dip” to “sell on bounce”
🎓 Educational Takeaways for Traders
Extended rallies end with distribution, not collapse
Fibonacci levels work because most traders watch them
Corrections test patience, not intelligence
Price reacts where emotions are highest, not where logic feels comfortable
🧠 Trading Psychology Behind This Chart
Zone Trader Behavior
Highs (1,580–1,610) Greed → Distribution
Pullback begins Hope → Dip buying
Golden zone Fear vs Opportunity
Breakdown Panic & Capitulation
📘 Markets move because people react — levels simply highlight where reactions cluster.
🔮 Price Outlook (Educational Projection)
Above ₹1,420: Range-bound recovery likely
Above ₹1,476: Momentum improves, bounce extension possible
Below ₹1,398: Deeper correction toward ₹1,305
Below ₹1,267: Structure turns weak on higher timeframe
🧾 Conclusion
Reliance is currently in a healthy corrective phase after profit booking from stretched levels.
The ₹1,398–1,476 zone is the most important area to watch — it will decide whether this correction ends as accumulation or turns into distribution continuation.
📌 Let price confirm intent; don’t predict emotions.
⚠️ Disclaimer
This analysis is for educational purposes only. I am not a SEBI registered analyst. Markets are uncertain, and I can be wrong. Please consult a financial advisor before trading or investing.

#NIFTY Intraday Support and Resistance Levels - 19/01/2026Based on the current structure of the Nifty 50 chart, a gap-down opening is expected, which clearly reflects cautious sentiment at the start of the session. The index is opening below the recent consolidation zone, indicating that sellers are still active and buyers are not yet confident to push prices higher at the open. This kind of opening generally leads to a range-bound to volatile first half, where the market tests nearby support and resistance levels before showing any clear directional bias.
From a technical perspective, the 25,700–25,750 zone is acting as an important short-term decision area. This level has previously behaved as both support and resistance, making it a critical region to watch today. If Nifty manages to hold above 25,700 and shows strength, there is a possibility of a reversal long setup. Sustained price action above 25,750–25,800 can attract buying interest, and in that case, the upside targets remain 25,850, 25,900, and 25,950+. Such a move would indicate short covering and intraday recovery after the gap-down opening.
On the downside, if the index fails to sustain above 25,700 and breaks down decisively below this level, selling pressure is likely to increase. A clean breakdown below 25,700 can open the door for further downside towards 25,650, 25,550, and 25,500. This would confirm that the gap-down opening is being accepted by the market and that bears remain in control for the session. Any rejection from the 25,950–26,000 resistance zone would further strengthen the bearish intraday outlook.
Overall, the market structure suggests a sell-on-rise or level-based trading approach rather than aggressive directional trades at the open. Traders should avoid early impulsive entries and instead wait for confirmation near the marked levels. If price stabilizes and forms a base near support, a controlled reversal trade can be planned. Otherwise, continued weakness below support levels may offer short-selling opportunities with strict risk management. The session is likely to remain volatile and level-driven, making patience and discipline crucial for today’s trades.

[INTRADAY] #BANKNIFTY PE & CE Levels(19/01/2026)Based on the current chart structure, Bank Nifty is indicating a gap-down opening below the 59,950 level, which is an important short-term pivot zone. This gap-down suggests early weakness and cautious sentiment at the opening, especially after the index failed to sustain above the previous resistance band. However, the broader structure still shows that the market is trading within a well-defined range, and the day’s direction will largely depend on how price behaves around the marked support and resistance levels.
Intraday Structure & Key Observations
- The 59,950–60,050 zone has acted as a crucial decision-making area in recent sessions. A gap-down below this zone indicates that sellers are active, but confirmation will only come if price sustains below this level after the first 15–30 minutes.
- The 60,050–60,110 region now becomes an immediate resistance. Any pullback towards this zone should be closely watched for rejection or acceptance.
- The upper resistance near 60,450 remains a major supply zone. Only a strong breakout and sustained move above this level would shift the intraday bias clearly towards bullish continuation.
Bullish Scenario (CE Side)
- If Bank Nifty manages to recover and sustain above 60,050, it may indicate that the gap-down was a false breakdown or an opening trap. In such a case:
- Buying opportunities can be considered above 60,050–60,100 with confirmation.
- Upside targets would be 60,250, 60,350, and 60,450+.
- Price acceptance above 60,110 with strong candles would strengthen the bullish case.
This scenario would reflect strong buying interest at lower levels and could lead to a short-covering move.
Bearish Scenario (PE Side)
- If the index fails to reclaim 59,950 and continues to trade below it:
- Selling pressure is likely to dominate.
- Below 59,950–59,900, downside targets open up at 59,750, 59,650, and 59,550.
- A deeper breakdown below 59,450 can accelerate the fall towards 59,250, 59,150, and 59,050.
- This would confirm that the gap-down opening is being accepted by the market, indicating a bearish continuation day.
Trading Approach & Risk Management
- Expect initial volatility due to the gap-down opening; avoid aggressive trades in the first few minutes.
- Wait for price confirmation near key levels rather than predicting direction.
- Trade with strict stop-losses and consider partial profit booking at intermediate targets.
- If price remains stuck between 59,950 and 60,050, the session may turn into a range-bound or whipsaw day.
Overall View
The immediate bias remains cautious to bearish due to the gap-down opening below 59,950. However, a quick recovery above 60,050 can neutralize this weakness. Today’s trade will be purely level-based, and discipline will be key. Let the market confirm direction before committing to larger positions.

Gold May RejectGold may Reject from 4610-4620. SL will be 4630 Level. Target will be 4475 zone. As shown in the chart.

XAUUSD 4HR T/F ANALYSIS---
xauusd 4hr t/f analysis----- formation of arc if breakdown we can see supply on target point let`s see how it`s work |

Gold Trading Strategy for 19th January 2026🟡 GOLD TRADING SETUP – INTRADAY / SHORT TERM 🟡
⚠️ Trade only after candle close confirmation. No early entries.
🟢 BUY SETUP (Bullish Momentum)
📈 Buy Above:
✔️ One Hour Candle High Break & Close Above ₹4619
🎯 Targets:
💰 T1: ₹4632
💰 T2: ₹4645
💰 T3: ₹4659
📌 Logic:
• One-hour candle close above ₹4619 indicates strong bullish continuation
• Momentum confirmation reduces false breakout risk
• Trail stop-loss once targets are achieved to protect profits 💵
🔴 SELL SETUP (Bearish Momentum)
📉 Sell Below:
✔️ 15-Minute Candle Low Break & Close Below ₹4572
🎯 Targets:
💰 T1: ₹4560
💰 T2: ₹4548
💰 T3: ₹4529
📌 Logic:
• 15-minute close below ₹4572 signals short-term weakness
• Suitable for quick intraday selling opportunities
• Book partial profits step-by-step and trail SL accordingly 💼
⛔ Important Risk Management Rules:
🛑 Always use Stop-Loss
🛑 Follow one trade at a time
🛑 Avoid over-leverage
🛑 Market volatility can change direction suddenly
⚠️ DISCLAIMER:
📢 This analysis is for educational and informational purposes only.
📉 Trading in commodities involves substantial risk and may not be suitable for everyone.
💸 Past performance does not guarantee future results.
🧠 Please consult your financial advisor before taking any trade.
🚫 I am not responsible for any profit or loss incurred. Trade at your own risk.
✨ Trade with discipline. Protect capital. Profits will follow. ✨

XAUUSD/GOLD 1H SELL LIMIT PROJECTION 19.01.26✅ XAUUSD / GOLD (1H) – SELL LIMIT PROJECTION (19.01.26)
Gold is currently respecting the 1H downtrend line, and price is moving in a bearish structure. Even though we saw a bullish engulfing reaction from demand, this move is likely a pullback before bearish continuation.
📌 Key Levels
🔴 Supply / Resistance Zone: 4615.608
This level is acting as a premium zone + resistance area.
⚫ Key Mid Support/Resistance: 4585.679
Important reaction level. Price must reclaim & hold above this for further upside push.
🔵 Demand / Support Zone: 4576 – 4578
Strong demand region where buyers previously entered and formed engulfing.
📍 Current Market Price: 4596.320
📉 Trade Idea (Sell Limit Setup)
✅ Sell Limit Entry: 4610 – 4615 (inside supply + trendline confluence)
🛑 Stoploss: 4628 – 4630 (above supply highs)
🎯 Targets:
TP1: 4585.679
TP2: 4576 – 4578 (Demand zone)
📊 Risk-Reward: 1:2
🧠 Setup Logic
✔ 1H trendline still bearish
✔ Entry at premium / supply zone (4615.608)
✔ Target into support/demand zone (4576 – 4578)
✔ High probability continuation after pullback
⚠️ Confirmation: Watch for bearish rejection / wick near 4615 zone


AUDJPYExpecting this scenario on AJ as after weekly supply was tapped price reacted bearish. Will be monitoring for possible shorts.

GA SHORTSPrice is in a downtrend. From a momentum standpoint this set up seems very reasonable for shorts. Let's wait and see.

EURUSD SHORTSAfter a drop in price on EU last week, EU is still clearly bearish. I am looking for sells as the picture shows.

XAUUSD Break in Structure Points to Continued Upward MomentumXAUUSD shows a clear bullish price structure supported by strong momentum and clean market behavior. After a sharp impulsive move, price shifted into an upward trend, forming consistent higher highs and higher lows. The breakout above the earlier resistance zone around 4,630–4,640 confirms a clear Break of Structure, indicating that buyers are in control and bullish strength remains active.
The earlier resistance area has now turned into a key support zone around 4,585–4,600. This zone is important because price reacted strongly from this level in the past, making it a potential buy-on-pullback area. As long as price holds above this support, the bullish structure stays valid. Small pullbacks into this zone may be part of a healthy continuation within the trend rather than a reversal.
On the upside, price is trading near recent highs, suggesting that liquidity may still be present above. If price continues to hold above the structure break level, further upside toward 4,670 and higher levels remains possible. A clear failure to hold above the support zone would indicate short-term weakness and may lead to a deeper correction.
Overall, the market bias remains bullish while price stays above support, with structure favouring continuation over reversal. This analysis is based purely on technical price action and is for educational purposes only.
