YESBANKYESBANK
bullish trend is Showing on the chart.
buy signals in
technical indicators and
cup with handle & ascending triangle chart pattern.
BUYING RANGE 20/22
Watch for a breakout above 32/35 to sustain the bullish trend. If the resistance holds, there could be a retest towards 9/10 and an uptrend from here.
Chart Patterns

Part 3 Technical Analysis VS. Institutional Trading Hedging Using Options
Hedging protects your capital.
Example:
You hold ₹10 lakh worth of Nifty stocks.
You can buy PE options to protect your portfolio from a fall.
This is why options were originally created—not for speculation, but for risk management.

BHARTIARTL (Airtel) – Daily Chart | Simple Long SetupBharti Airtel is currently pulling back after a strong up-move and has reached an important support area. Price is also near an upward trendline, which often acts as support.
🔹 Trend: Overall trend is up
🔹 Support Zone: Marked grey area
🔹 Entry Idea: Buy if price holds above support
🔹 Stop Loss: Below the red zone (support break)
🔹 Target: Previous highs / upper green area
📌 Why this setup makes sense (simple):
Price is in an uptrend
It came down to a support level
Trendline support is also present
Risk is small compared to reward
📈 If the price stays above support, it can move higher again.
⚠️ If it breaks and closes below support, avoid the trade.
💡 For learning purpose only. Always use stop loss.

Part 2 Candle Stick Patterns Strategies in Options Trading
Investors have a wide range of option trading methods at their disposal. Here are the most often-used option trading methods:
Covered Call Technique
In this somewhat cautious strategy, an investor purchases a stock and afterwards sells the call option for a profit. The investor can keep the additional gains if the share price increases.
Bull Spread
The bull call spread approach entails the purchase and sale of call options with various strike prices. The investor might potentially profit from the difference between the two options by purchasing the one with a lower strike price for a cheaper price.
Long Put Approach
The investor purchases a put option. The investor can earn from the difference in the prices of stocks at the time of buying and selling the options contract. Even if the stock price declines, the options holder has the right to sell the asset at the price prevailing at the time of purchase.
Iron Condor Approach
This sophisticated strategy entails the simultaneous purchase and sale of both put and call options having various strike prices by the investor. The investor can earn when the stock price remains inside the band of the strike price. Learn more about the PCR ratio and how it can help you trade stocks at Share India.

silver spot updateeyes on silver 92.80$ if mkt sustain abv or close abv 2 days than looks 95--97 ultimate 100$ in near terms no if and but. or blw 92.80$ sustain some down correction expect 92--91-90$-- over all looks bull mode buy on dip good way with support sl.

ICICIBANKICICIBANK
bullish trend is Showing on the chart.
buy signals in
technical indicators and
Ascending Channel chart pattern.
BUYING RANGE 1340/1350
Watch for a retest 1340/1350 to sustain the bullish trend. If the resistance holds, there could be a retest towards 1250/1260 and an uptrend from here.

Gold Reloads for the Next Move: Bulls Defend 4,650, Eyes on 4,70Market Structure
Gold remains in a broader bullish trend after defending the major demand zone near 4,550. The sharp rebound from that level confirms strong institutional buying and keeps the higher-high, higher-low structure intact on the intraday and short-term charts.
1H Timeframe
Trend: Bullish recovery within a larger consolidation range.
Price Action: Strong impulsive move up from 4,550 followed by controlled consolidation above 4,650.
Moving Averages: Price is holding above the short-term and mid-term MAs, indicating trend support.
Bollinger Bands: Expansion after a squeeze signals volatility expansion in favor of bulls.
RSI (~65): Bullish momentum, not yet extreme; room for continuation.
Volume: Expansion on the rally confirms genuine buying interest.
Key 1H Levels
Resistance: 4,675 → 4,700
Support: 4,650 → 4,620
Major Support: 4,550
5-Minute Timeframe
Intraday Bias: Bullish but slightly stretched.
Structure: Higher lows maintained after the breakout.
Momentum Indicators: Stochastic RSI is near overbought, suggesting short-term pullbacks are possible, but within a bullish context.
VWAP / EMA: Price respecting dynamic support, showing buyers still in control.
Scenario Outlook
Bullish Continuation
Sustained trade above 4,650 opens the path toward 4,690–4,700.
A clean break and hold above 4,700 could trigger acceleration toward fresh highs.
Corrective Pullback
A healthy retracement toward 4,620–4,650 would likely attract dip buyers.
Loss of 4,620 increases the probability of a deeper move toward 4,590, but trend remains bullish above 4,550.
Conclusion
Gold remains structurally bullish, supported by strong demand from lower levels. Short-term consolidation or shallow pullbacks are normal after the sharp rally, but overall bias stays bullish as long as 4,650 holds. Buyers remain in control unless price decisively breaks below key supports.

Tata Motors Passenger Vehicles Ltd weekly chart1. Trend: The stock is in a sharp downtrend after a major peak in mid‑2024, forming lower highs and lower lows. The EMA 21 (red line) and EMA 55 (blue line) are sloping downward, indicating bearish momentum.
2. Candlestick pattern: Recent candles exhibit a strong red bearish move with large bodies, signaling aggressive selling. The latest candle shows a potential exhaustion near ₹342.80.
3. Support & Resistance:
- Support: ₹221.08 (horizontal white line), which has acted as a strong base in 2022–2023 and is now a key floor.
- Resistance: The previous consolidation zone around ₹350–₹400 and the EMA 21 & 55 acting as dynamic resistance.
4. Volume analysis: Volume spikes on the down‑move, confirming strong selling pressure. Recent volume is moderate, suggesting reduced activity near the current low.
5. Key observation (white arrows): The chart highlights three similar support bounce zones (2022, 2023, and 2025), indicating the stock may test the ₹221.08 support again if the decline continues.
The View: The price at ₹342.80 is near a critical breakdown; watch for a bounce off ₹221.08 or a further slip below it for deeper weakness.If any bullish pattern occurs with fresh buying there can be reversal.

LongKey Points About Strategy
1. Identify breakouts using recent pivot highs and lows.
2. For entry or exit, wait for the candle to close above or below the given level; do not wait for the target.
3. Obey the risk–reward ratio strictly.
4. Do not create positions that you cannot manage, and avoid taking multiple positions beyond your capacity.
5. You cannot predict the market in advance—news, results, or corporate actions don’t matter.
Essential Disclaimer:
For education only—this is not financial advice. Always research and consult a licensed advisor.

ShortKey Points About Strategy
1. Identify breakouts using recent pivot highs and lows.
2. For entry or exit, wait for the candle to close above or below the given level; do not wait for the target.
3. Obey the risk–reward ratio strictly.
4. Do not create positions that you cannot manage, and avoid taking multiple positions beyond your capacity.
5. You cannot predict the market in advance—news, results, or corporate actions don’t matter.
Essential Disclaimer:
For education only—this is not financial advice. Always research and consult a licensed advisor.

Trump Imposes Tariffs on EU – Gold Creates a R Market Context
Trump’s announcement of new tariff measures on EU goods has triggered a strong risk-off wave, pushing capital out of risk assets and into Gold as a safe-haven.
The USD shows mixed reactions, while Gold rallies sharply and forms a rare bullish GAP, clearly reflecting defensive market sentiment.
The key question now is not whether Gold is strong or weak, but:
Will this GAP be filled, or held for trend continuation?
Technical Structure (H1)
The broader structure remains bullish, confirmed by multiple Breaks of Structure (BOS).
The latest impulsive move has created a bullish Fair Value Gap (GAP) above the equilibrium zone.
Price is currently holding above the FVG, with no clear acceptance back into lower levels.
➡️ In a geopolitical and trade-risk environment, GAPs are not required to be filled immediately.
Decision Zones
Upper FVG / GAP: 4,634.188
Equilibrium Zone: 4,619.928
Lower Support / GAP Base: 4,596.602
Scenarios (If – Then)
Scenario 1 – GAP Holds & Continuation
If price holds above 4,619.928, the GAP remains protected.
Bullish continuation toward higher levels becomes likely as safe-haven flows persist.
Scenario 2 – Technical GAP Fill
If price loses 4,619.928, a retracement toward 4,596.602 is likely for rebalancing.
Only a clear H1 close below 4,596.602 would confirm a deeper GAP fill.
Summary
Trade-related confrontation is changing price behavior, causing Gold to react more aggressively than usual.
At this stage, the GAP represents the decision point between continuation and correction.
Reaction at the GAP will define the next move.
Trade the reaction, not the headline.

CCLCCL
bullish trend is Showing on the chart.
buy signals in
technical indicators and
descending triangle pattern chart pattern.
BUYING RANGE 970/975
Watch for a breakout above 970/975 to sustain the bullish trend. If the resistance holds, there could be a retest towards 900/9110 and an uptrend from here.

Part 1 Candle Sticck Patterns Types of Options
There are basically two types of options; Call and Put.
Call: Call options give the buyer the right to buy an asset at a specific price on a fixed date.
Put: Put options give the buyer the right to sell an asset at a predetermined price. Similar to call options, Put options also have a certain expiration date.
To buy both calls and puts, the investors must pay a fee called the premium to the option seller.

WIPROWIPRO
bullish trend is Showing on the chart.
buy signals in
technical indicators and
cup with handle & ascending triangle chart pattern.
BUYING RANGE 230/235
Watch for a breakout above 270/275 to sustain the bullish trend. If the resistance holds, there could be a retest towards 190/200 and an uptrend from here.

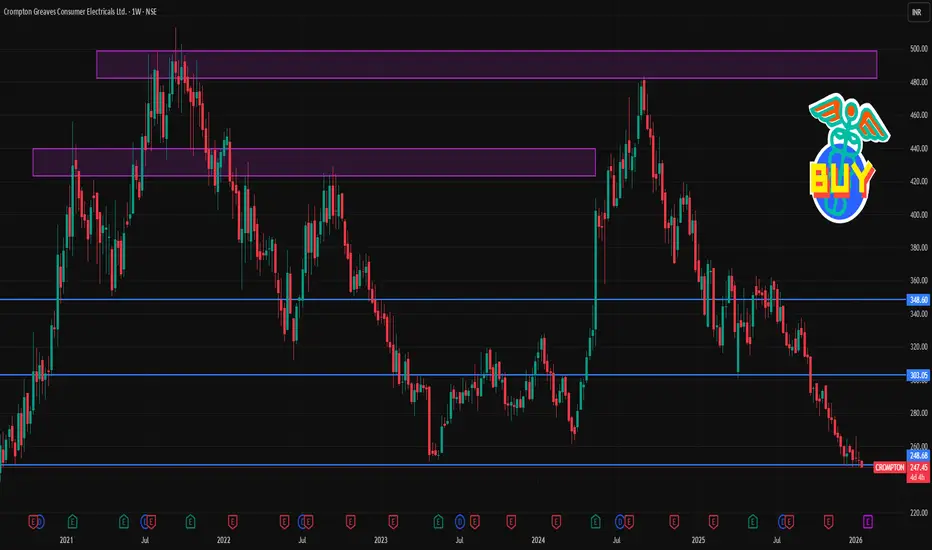
CROMPTON 1 Week Timw Frame 📊 Current Price Snapshot (Recent Close)
📌 Last traded price: ~₹251–₹255 range (as per latest market data).
📈 Key 1‑Week Technical Levels (Support & Resistance)
🔻 Support Levels — Where Buyers May Step In
Immediate support: ~₹248–₹252 (current level area)
Secondary support: ~₹245–₹247 (short‑term downside buffer)
Lower support: ~₹241–₹242 (deeper short‑term demand zone)
➡️ If price stays above ~₹248, short‑term weakness may stabilize.
🔺 Resistance Levels — Where Selling Might Appear
R1 (first resistance): ~₹255–₹256 (near immediate intraday hurdle)
R2 (next resistance): ~₹259–₹260 (near short‑term pivot barrier)
R3 (higher resistance): ~₹262–₹263 (short‑term rally target on strength)
➡️ A breakout above ~₹259–₹260 with volume could signal a short‑term bounce.
📅 1‑Week Scenario Outlook
➡️ Bearish scenario (higher probability given current momentum):
Price remains below ₹259–₹260 resistance → likely to trade lower toward ₹245 and possibly at ₹241–₹242 zone.
➡️ Bullish reversal setup (requires catalyst):
Price breaks and sustains above ₹259–₹260 with decent volume → could see rally toward ₹262+ within week.
⚠️ Important Notes
This is a technical perspective only (not investment advice).
Price movements can change rapidly with market news, volumes, and macro catalysts.
Use stop‑loss and risk management if planning any trades.
XAUUSD Consolidation Below Resistance!Chart Analysis (XAUUSD – 1H)
Market Structure:
Price is ranging just below a major resistance / supply zone (~4,630–4,640). Multiple rejections here show distribution rather than clean breakout strength.
Higher Time Frame Context:
A bullish higher-timeframe trendline is rising from below.
There is a higher-timeframe FVG (Fair Value Gap) resting beneath current price (~4,520–4,560 area).
This suggests bullish bias overall, but short-term pullback is likely before continuation.
Liquidity & POI:
Equal highs / resting liquidity above the range.
A marked POI (Point of Interest) sits just below current price inside the supply zone.
Red dotted path suggests a fake breakout or liquidity grab, followed by a drop into demand
Sell Scenario (Short-Term / Intraday)
Bias: Short-term bearish (pullback)
Sell Entry Options:
Rejection sell from supply zone
Entry: 4,625 – 4,640
Confirmation: bearish candle / long upper wick / momentum lo
Liquidity sweep sell
Price spikes above range highs → fails to hold → sell on breakdown back below 4,620
Stop Loss:
Above recent high: 4,660 – 4,680
Targets:
TP1: 4,590
TP2: 4,560
TP3: 4,520 (HTF FVG + trendline confluence)
Buy Scenario (High-Probability Swing Setup)
Bias: Medium- to higher-timeframe bullish
Buy Entry Zone:
4,520 – 4,560
HTF FVG
Rising trendline
Prior demand zone
Confirmation (Preferred):
Bullish engulfing / strong impulsive candle
Liquidity sweep of lows then reclaim
Stop Loss:
Below FVG & trendline: 4,480
Targets:
TP1: 4,600
TP2: 4,640
TP3: 4,680 – 4,700 (range highs / breakout extension)
Summary
Short-term: Expect rejection or fake breakout → sell opportunity.
Mid-term: Look for deep pullback into HTF FVG → strong buy setup.
Key Idea: Sell the premium, buy the discount in an overall bullish structure.

HINDPETRO 1 Day Time Frame 📊 Current Intraday Price (as of latest available)
📍 HPCL current price: ~₹456–₹458 per share (NSE/BSE) — trading around this level today.
🕐 Note: Prices are updated during market hours and may change quickly.
📈 Intraday Price Levels
Day’s High: ~₹460.00
Day’s Low: ~₹454.45
Upper Circuit (limit): ~₹503.65
Lower Circuit (limit): ~₹412.15
Previous Close: ~₹457.90
🔎 What This Means (Intraday Structure)
Current trading band: approximately ₹454–₹460 — tight range so far today.
Important near‑term zones:
Support (intraday): near the lower part of today’s range around ₹454–₹455.
Resistance (intraday): near the upper part of today’s range around ₹458–₹460.
🛠 Technical Snapshot (for context)
Short‑term technical oscillators are mixed to slightly bearish/neutral on intraday/daily charts (RSI ~ mid‑range, MACD slightly bearish).
📌 Quick Summary
HPCL is trading sideways today with limited volatility between ₹454 and ₹460 so far.
Break below ₹454 may open downside momentum intraday; above ₹460 could target broader intraday resistance.

BRNLBRNL
bullish trend is Showing on the chart.
Descending Triangle chart pattern.
INVESTORS MAY ACCUMULATE AT CURRENT LEVELS
Watch for a breakout above 26/30 to sustain the bullish trend. If the resistance holds, there could be a retest towards 15/18 and an uptrend from here.

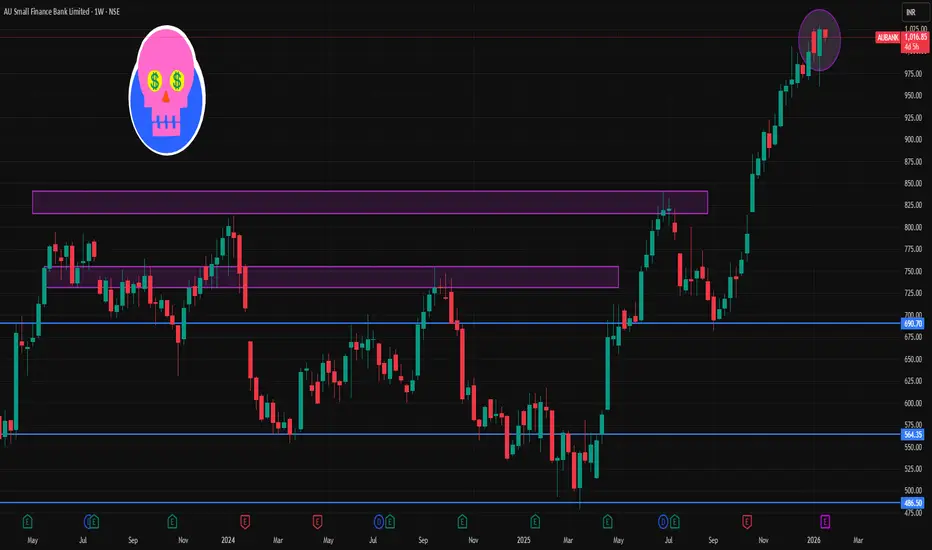
AUBANK 1 Week Time Frame 📌 1‑Week (Current) Key Levels
📍 Current Price Context
The stock has been trading around ₹1,020–₹1,030 area recently on NSE technical feeds.
🧱 Resistance Levels (Upside Targets)
1. Immediate Resistance (R1): ~₹1,050.35 – first barrier on the upside.
2. Major Resistance (R2): ~₹1,075.30 – next meaningful supply zone.
3. Higher Resistance (R3): ~₹1,120.65 – extended bullish breakout territory.
🛡️ Support Levels (Downside Defenses)
1. Immediate Support (S1): ~₹980.05 – crucial for weekly structure.
2. Major Support (S2): ~₹934.70 – deeper correction zone if S1 breaks.
3. Lower Support (S3): ~₹909.75 – extended bearish support for the week.
📊 Weekly Trading Range Projection
Bearish range: ~₹909–₹980
Bullish range: ~₹1,050–₹1,120 +
Price needs to hold above ₹980 weekly close to maintain bullish bias for the week.
📈 Trend & Indicators (Weekly)
Moving averages and oscillators on short‑term charts show neutral to mildly bullish momentum around ₹1,020–₹1,030.
EMA & SMA structures on daily charts support trend continuation if above key moving averages.
🔎 How to Use These Levels This Week
📌 Bullish setup:
Break and sustain above ~₹1,050 → potential run to ~₹1,075 → ₹1,120.
📌 Bearish setup:
Close below ~₹980 support → target ~₹935 → ₹910 on a deeper correction.
📌 Neutral / Swing range:
Between ₹980 and ₹1,050 → sideways action and range trades.
HAL 1 Week Time Frame 📌 Current Approximate Price
HAL’s latest price is around ₹4,440 – ₹4,480 on NSE (varies with live market moves).
📊 Weekly Technical Levels (1‑Week View)
📈 Resistance Levels (Upside)
These are levels where price may struggle to break above on the weekly timeframe:
R1 (Immediate): ~₹4,500 – ₹4,550 — first resistance zone.
R2 (Medium): ~₹4,540 – ₹4,580 — next resistance cluster.
R3 (Bullish / extended): ~₹4,580 – ₹4,670 — higher resistance if buyers take control.
Key breakout barrier to watch: sustaining above ₹4,580–₹4,600 may strengthen bullish bias for the week.
📉 Support Levels (Downside)
These are levels where price may find buying interest if it declines:
S1 (Immediate): ~₹4,420 – ₹4,380 — first support for this week.
S2 (Secondary): ~₹4,380 – ₹4,340 — deeper support if sellers push lower.
S3 (Lower): ~₹4,340 – ₹4,300 — key demand zone historically.
Key downside pivot: break below ~₹4,380 could extend selling into the ₹4,300 area.
📐 Weekly Pivot Reference
Pivot Point: ~₹4,460 – ₹4,470 — midpoint reference level for direction bias.
Above this pivot → bullish bias
Below this pivot → bearish/neutral bias
📝 Summary Weekly Levels Table
Level Price Zone
🟥 R3 ~₹4,580 – ₹4,670
🟧 R2 ~₹4,540 – ₹4,580
🟨 R1 ~₹4,500 – ₹4,550
⚪ Pivot ~₹4,460 – ₹4,470
🟦 S1 ~₹4,420 – ₹4,380
🟩 S2 ~₹4,380 – ₹4,340
🟪 S3 ~₹4,340 – ₹4,300

AXISBANK 1 Week Time Frame 📈 Current Price Context
Axis Bank is trading around ₹1,300–₹1,305 range recently.
🔑 1‑Week Pivot & Key Levels
These levels are commonly used by traders to identify likely reversal zones or breakouts for the week ahead:
🔥 Weekly Resistance (Upside Targets)
1. R1: ~₹1,317–₹1,320 – First resistance zone this week.
2. R2: ~₹1,341–₹1,342 – Next resistance zone if bullish momentum continues.
3. R3: ~₹1,370+ (approx) – Major higher resistance for breakout scenario.
👉 Bullish condition: Week closes above ₹1,317–₹1,320 with volume → look for extended upside moves toward ₹1,340+.
🛡️ Weekly Support (Downside Floors)
1. S1: ~₹1,262–₹1,265 – Near‑term support for the week.
2. S2: ~₹1,230 – Mid‑range support if breakdown below first support happens.
3. S3: ~₹1,206 – Broader downside support level.
👉 Bearish condition: Cleared break below ₹1,262–₹1,265 may accelerate downside toward ₹1,230 → ₹1,206.
📊 Support/Resistance (Pivot‑Based Technical)
From short‑term pivot derivations (daily/weekly calculations):
Resistance
R1: ~₹1,306–₹1,307
R2: ~₹1,319–₹1,320
R3: ~₹1,329–₹1,330
Support
S1: ~₹1,284–₹1,285
S2: ~₹1,274–₹1,275
S3: ~₹1,261–₹1,262
These extra pivot levels (especially R1/R2/S1/S2) help fine‑tune next day or mid‑week entries.
📌 How to Use This Weekly Level View
📈 Bullish Scenario
Hold above ₹1,317–₹1,320 zone
Short‑term resistance becomes support on breakout
Targets → ₹1,340 → ₹1,373+
📉 Bearish Scenario
Close below ₹1,262–₹1,265
Potential decline toward ₹1,230 → ₹1,206 zones
📊 Consolidation Range
If price stays between ₹1,262–₹1,320 → expect range‑bound trading for the week.

Chart PatternsChart patterns are visual formations on a price chart that reflect the collective behavior of market participants. These formations reveal the underlying psychology of buyers and sellers and help traders anticipate potential price movements. Whether you trade equities, derivatives, or index futures like Nifty or GIFT Nifty, chart patterns remain one of the most valuable tools for technical analysis. They help you read structure, recognize trend strength, identify reversals, and understand volume-based confirmation.
Broadly, chart patterns fall into three categories:
Reversal Patterns
Continuation Patterns
Bilateral Patterns

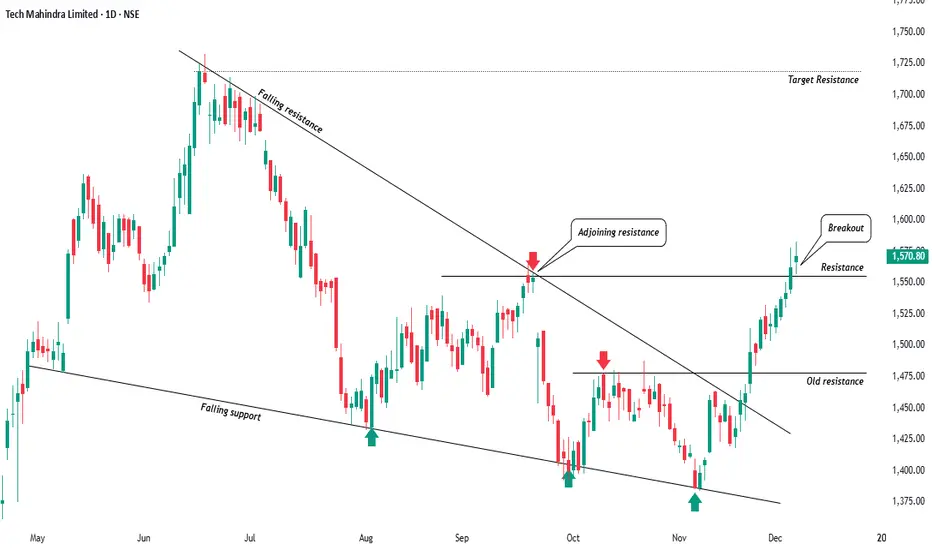
Techm Wakes Up! Reversal CandidateHi Traders! Hope all you are doing well and doing good trades, So today I am sharing a clean technical setup which I’ve been tracking for weeks Tech Mahindra has finally given breakout from a multi-month falling wedge along with a horizontal resistance flip. The structure is now turning bullish, and the chart tells a very clear story.
Chart Observations-:
Falling Wedge Structure (May–Nov).
Price continued making lower highs and lower lows inside a narrowing wedge.
Both falling resistance and falling support have been respected multiple times.
Repeated bounces from the lower trendline (green arrows) indicate accumulation.
First Breakout Attempt – Rejection-:
Price attempted a breakout near the adjoining resistance in September.
Sharp rejection followed (red arrow), keeping the wedge intact.
This rejection later acted as a reference level for the final breakout.
Final Breakout with Strong Momentum-:
In early December, price decisively broke above the wedge’s falling resistance.
Breakout candles are wide-bodied and supported by rising volumes a strong technical sign.
Horizontal Resistance Flip-:
The stock crossed the old resistance zone near 1475 and then sustained above it.
This zone has now flipped into support, confirming bullish continuation.
The next major Target Resistance sits in the 1680–1720 region the logical wedge target projected from pattern height and price resistance too.
Technical Summary-
Pattern: Falling Wedge (bullish reversal)
Breakout: Clean and decisive
Market Structure: Lower-highs broken → Higher-highs forming
Resistance target: 1720
View: Bullish as long as price sustains above recent breakout zone.
This is one of those setups where price action aligns perfectly with classical charting principles.
Target is nearby 11% from current price so 1:2 Risk to reward looks good for me, Rest I will update the idea accordingly guys.
Thanks for reading.
Regards- Amit.