XAUUSD – INTRADAY🔴 Market Structure
Overall trend: Bearish
Price making lower highs
Current bounce = pullback into resistance
✅ ENTRY (BEST AREA)
Sell between: 5085 – 5100
Or sell on rejection below 5105
🎯 TARGETS
Target 1: 🎯 5045
Target 2: 🎯 5000
Target 3 (extension): 🎯 4945
🛑 STOP LOSS (STRICT)
SL: ❌ 5140
Chart Patterns

Bharat Electronics Limited Weekly Chart
4 EMA Analysis: The stock is trading above the 21, 55, 100, and 200 EMAs(Red, Blue, Green & Orange respectively) indicating a bullish trend. The EMAs are also in a positive alignment, suggesting a strong uptrend.
Volume Analysis: The breakout was supported by healthy volume expansion, validating the move. There's no major selling pressure visible near the breakout zone.
RSI Indicators: The RSI has crossed 60, reflecting healthy strength without signs of exhaustion.
Based on these indicators, the technical analysis suggests:
The trend is bullish, with buyers maintaining control above key demand zones.
The stock is likely to continue its uptrend, with potential targets at ₹460-₹480 (positional).
Support levels to watch: ₹428 - ₹420.
Further prediction:
A daily close above ₹422 could trigger stronger moves, opening room for fresh highs.
If the resistance holds, there could be a retest towards ₹340-₹360, followed by an uptrend.
Keep an eye on the volume and RSI for any signs of exhaustion or reversal. Majorly trend looks positive .

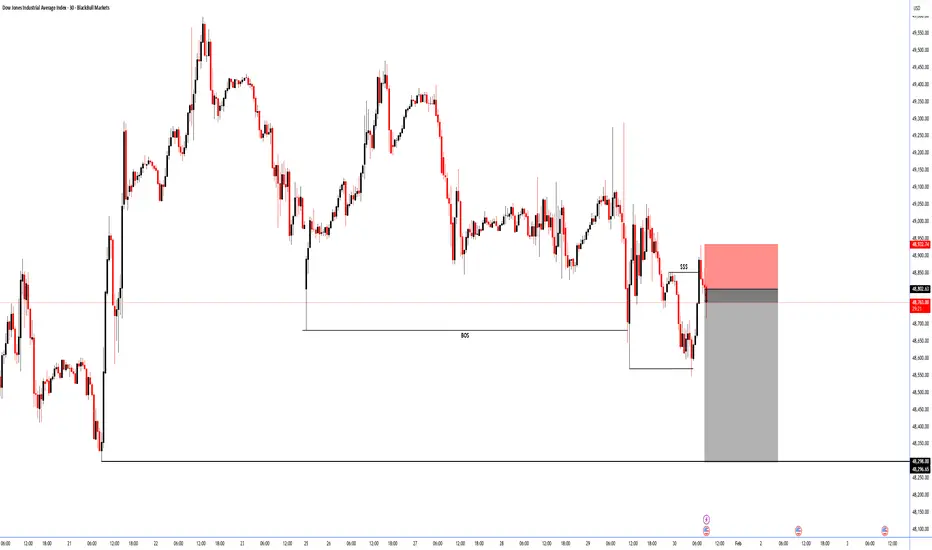
US30Greetings!
Welcome traders.
By choosing to "Follow", you can stay updated with the latest information promptly. Kindly consider clicking "Boost" as well.
Wishing you a pleasant day.
🎯Risk 1% per trade
🎯Risk management is the key to be successful in this game
BTCUSD Demand Zone in Focus After Strong Bearish MoveBTCUSD is currently trading after a strong bearish move, where price broke below the earlier sideways structure with high selling momentum. The market clearly respected a downward trend, forming lower highs and showing consistent selling pressure. The resistance area around 89,800–90,400 worked as a strong selling zone, where price faced rejection and sellers regained control, leading to a sharp fall.
After this decline, price has now reached a major demand zone near 83,500–84,000. This area is supported by earlier buying activity and base formation, making it an important support level. The present reaction from this zone indicates that sellers are slowing down and buyers are trying to hold price. As long as BTCUSD stays above this demand, short-term stability or a corrective move can be seen.
The risk area below demand shows where downside pressure may increase if support breaks. A clear move below this zone would strengthen the bearish trend further. For now, price is consolidating near support, and volatility is expected around these levels. Overall market bias remains cautious, with bearish control still active, but short-term recovery chances remain while demand holds.
Disclaimer: This analysis is for educational purposes only. It is not financial advice. Trading involves risk and uncertainty.

GOLD MARKET VOLATILITY - REALITY CHECK Noise is high around XAUUSD with headlines like “trillions wiped out” and “gold crashing”.
Let’s keep it factual.
Gold is volatile due to profit-booking after a historic rally, geo-political uncertainty, and US policy expectations.
This is correction + consolidation, not a confirmed crash.
💡 “Trillions wiped out” = notional intraday value swings, not permanent losses.
Key Levels to Watch (XAUUSD)
Resistance: 5250 – 5300
Support: 5080 – 5000 (major demand zone)
Below 5000: Only if volatility expands with strong volume
Key Takeaway for Traders 🎯
High volatility ≠ clear direction
Avoid revenge or blind trades
Let price settle → trade with risk control
🛑 Staying out is also a strategy
📊 Focus on Forex / Crypto / Indices if Gold is unstable
Risk management > FOMO
Part 2 Intraday Institutional TradingBest Practices for Retail Traders
1. Start with Buying Options
Risk is limited.
2. Prefer ATM or Slight ITM
Better stability, realistic probability.
3. Avoid Holding Overnight
Unless you understand IV, theta, and event risk.
4. Track Implied Volatility
Buy when IV is low, sell when IV is high.
5. Use a Trading Plan
Entry levels
Stop loss
Target
Position size
6. Don’t Chase Cheap OTM Options
They expire worthless most of the time.

Part 5 Advance Option Trading Strategies Risks in Option Trading
Options offer high rewards, but also involve risks if not used carefully.
1. For Option Buyers
High time decay (theta loss daily)
Need strong, fast movement
2. For Option Sellers
Unlimited risk (if naked selling)
High margin requirement
Volatility spikes kill profits
3. Liquidity Risk
Wide bid-ask spreads reduce profit potential.
4. Event Risk
News announcements can cause unpredictable moves.

STAR Price Action1. Set up - Breakout
2. Trend - Bullish
3. Entry is late by a day, but missed this chart yesterday, so RR is reduced with todays gain
4. Probable rounding pattern formation

BUY TODAY SELL TOMORROW for 5% - BTST STOCK OPTIONyesterday
DON’T HAVE TIME TO MANAGE YOUR TRADES?
- Take BTST Stock Option trades at 3:25 pm every day
- Try to exit by taking 4-7% profit of each trade
-Resistance Breakout in ABB
BUY TODAY, SELL TOMORROW for 5%

BUY TODAY SELL TOMORROW for 5% - BTST STOCK OPTIONDON’T HAVE TIME TO MANAGE YOUR TRADES?
- Take BTST Stock Option trades at 3:25 pm every day
- Try to exit by taking 4-7% profit of each trade
-Cup and Handle Breakout in NESTLEIND
BUY TODAY, SELL TOMORROW for 5%

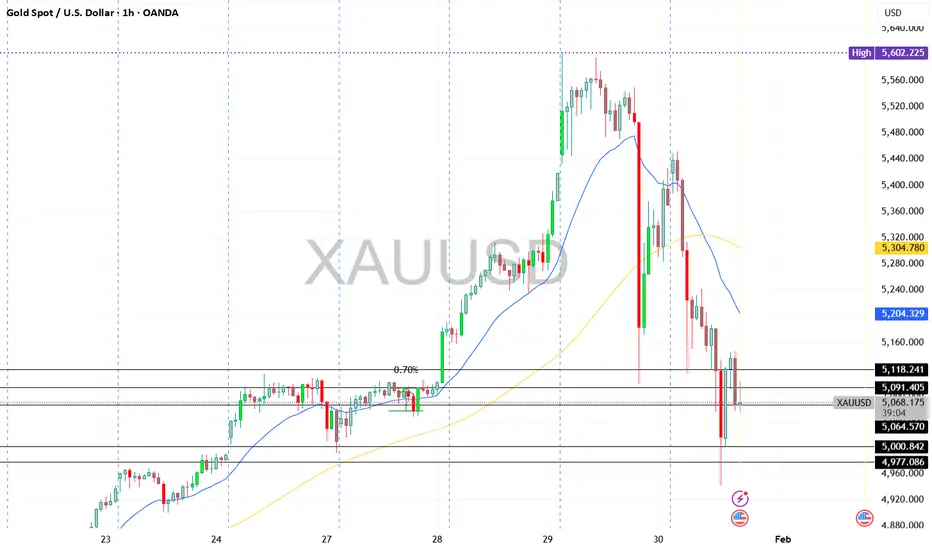
XAUUSD – H2 Technical AnalysisXAUUSD – H2 Technical Outlook: Short-Term Sell Pressure as Liquidity Gets Cleared | Lana ✨
Gold is showing signs of short-term weakness after an aggressive upside expansion. Price action suggests the market may continue to move lower in the near term, not as a trend reversal, but as a liquidity-driven correction within a broader bullish structure.
At this stage, the focus shifts from continuation to how price behaves while liquidity is being taken below structure.
📈 Market Structure & Price Behavior
The recent vertical rally has left the market overextended, making a corrective phase technically healthy.
Price has broken below short-term support and is now trading under a descending corrective trendline, signaling short-term bearish pressure.
This type of structure often develops when the market needs to clean buy-side positions before rebuilding for the next leg.
While the higher-timeframe trend remains bullish, the intraday bias has shifted to corrective / bearish until liquidity objectives are met.
🔍 Key Liquidity Zones on the Chart
Short-term sell zone: the descending trendline near current price As long as price reacts below this trendline, rallies are more likely to be sold.
Scalping buy liquidity: around 5050–5070 This area may generate temporary bounces, but reactions here should be treated as short-term only.
Key bullish order block: 4825 – 4830 A critical zone where stronger buyer participation may appear if the sell-off extends.
Major swing liquidity zone: 4613 – 4625 This is a high-confidence liquidity pocket where the market could complete a deeper correction and reset the broader bullish structure.
🎯 Trading Scenarios
Primary scenario – Continuation of the pullback: As long as price remains below the descending trendline, gold may continue to move lower to sweep liquidity below recent lows. This favors sell-on-rallies rather than buying strength.
Secondary scenario – Temporary reaction: Short-term bounces may occur around the 5050–5070 area, but without structural reclaim, these moves are more likely corrective than trend-changing.
Structural defense scenario: If price reaches the 4825–4830 or 4613–4625 zones, watch closely for signs of stabilization and absorption, which would signal that the liquidity objective has been completed.
🧠 Lana’s View
This move lower is best seen as liquidity cleanup, not panic selling. Lana stays patient during corrective phases, avoiding early longs and waiting for price to reach clear liquidity zones before reassessing bullish continuation.
✨ Let the market take what it needs, then look for structure to rebuild.


MTAR Tech – Monthly Chart View (Breakout Note)MTAR Tech – Monthly Chart View (Breakout Note) 📈
MTRA Tech has moved out of its horizontal consolidation channel on the monthly timeframe, indicating a potential trend reversal / fresh bullish phase.
✅ Key Highlight:
Horizontal range breakout confirmed on monthly chart
Volume expansion during breakout adds strong credibility, showing institutional participation and genuine buying interest
📌 What it means technically:
Earlier, price was time-wise consolidating (sideways range = accumulation zone)
Now breakout suggests buyers have taken control
If price holds above the breakout zone, it can act as a new support in coming months
🎯 Bullish continuation signs to watch:
Monthly close sustained above the channel top
Next 1–2 months should show higher high – higher low structure
Volume should remain above average on up candles
⚠️ Risk / invalidation:
If price slips back inside the channel, it becomes a false breakout trap

Gold 4900/4hJust like silver, i see gold coming down to check 5000 levels or maybe 4900. Logic is simple too bullish too soon, without forming base. 8 continuous green candles on 1D, now finally a red doji and today broke that doji. So there might be some fake bullishness.
Be vigilant but remember everything is possible.
#All this is my view not a financial advise.

Silver Down to 90/4hAlthough we saw a good correction here, around -10% today. Somewhat somewhere i see silver moving further down to 90 levels (might come to check the old channel).
Well we could also see some buying here as it is bottom of its yellow channel(current), just to trap people in fomo bullishness.
My long term view is, I am still bullish, year end 200$+. But right now dont go all in, keep risk management and money management tight. Remember, Anything can happen.
#My views not a financial advice.

INDIANB 1 Month Time Frame 📌 Current Price Context (as of latest trading)
Indian Bank is trading near ₹910–₹920 levels on NSE.
📈 1‑Month Key Resistance Levels (Upside)
These are the levels where price may face selling pressure or reversal if bulls weaken:
R1 — ₹918–₹920 — immediate resistance area just above current trade.
R2 — ₹927–₹930 — secondary resistance zone.
R3 — ₹935–₹940 — further upside resistance zone for continuation moves.
Summary: Immediate upside capped around ~₹918–₹930. Break and close above this band can signal stronger bullish continuation.
📉 1‑Month Key Support Levels (Downside)
Important levels that can act as rebound zones on pullbacks:
S1 — ~₹880–₹885 — first meaningful support near recent swing lows.
S2 — ~₹860–₹865 — secondary support from broader short‑term structure.
S3 — ~₹830–₹835 — major zone where bigger trend buyers may step in.
Summary: Minor supports start ~₹880, stronger support cluster around ~₹860‑₹835.
📊 Pivot / Neutral Reference
Pivot around ~₹907–₹910 — current central reference area.
Price above pivot suggests bullish bias, below could tilt neutral to bearish within the month.
📌 Interpretation For 1‑Month View
Bullish scenario:
Holds above ₹900–₹910 pivot → targeting ₹927–₹940 zone.
Neutral / consolidation:
Trading between ₹880–₹910.
Bearish risk:
Break below ₹860–₹845 could open deeper correction toward ₹830.

TDPOWERSYS 1 Day Time Frame 📊 Live/Intraday Summary (Today’s Trading)
• Current price: ~₹735 – ₹745* (showing a strong upside on the day).
• Day’s high: ₹767.95.
• Day’s low: ₹642.30.
• Previous close: ₹676.90.
• Range (1‑day): ₹642.30 – ₹767.95.
• Volume: Several million shares traded (indicating active intraday participation).
• Circuit limits: Upper ₹812.25 / Lower ₹541.55.
📈 Intraday Price Behavior (1‑Day Chart Insight)
Although I can’t draw the live chart, major market data sources show the stock rising significantly above its previous close, with intraday volatility spanning over ₹125+, suggesting strong buying interest today.
🔎 What this means for your 1‑day view
The stock opened lower near ₹661 and trended up strongly, testing higher intraday levels toward ₹767+ — a bullish intraday range.
Today’s range and levels are useful for intraday support/resistance as:
• Support: ~₹640 – ₹660 (earlier day lows).
• Resistance: ~₹760 – ₹770 (near today’s high).
⚠️ Notes
• Market prices intraday change rapidly — data above reflects the latest available snapshot for today’s session.
• If you’re planning trades, check real‑time charts from your broker or a live market platform (e.g., NSE/BSE or charting tools like Chartink).

Trump speaks tonight — Gold at decision point.Market Context (H1–H4)
Gold remains in a broader bullish structure, but short-term price action has shifted into a decision phase after rejecting ATH. The sharp drop created a displacement leg, followed by a corrective bounce — typical post-event behavior.
Structurally:
HTF trend is still upward (ascending channel intact)
No confirmed HTF bearish reversal yet
Current move looks like rebalancing, not trend failure
Fundamental Context
Trump’s speech tonight is the key volatility trigger
Any geopolitical / USD-impacting rhetoric can cause:
A liquidity sweep before direction
Or a direct continuation if risk-off sentiment returns
Market is likely positioning → expect fake moves before clarity
Technical Breakdown
ATH: recent distribution, not yet reclaimed
FVG (upper): potential reaction zone for sellers if price rallies
Mid Zone (~5090–5120): short-term decision / balance area
Strong Demand (~4980–5000): HTF buy zone, aligns with trendline & prior BOS base
Trading Scenarios (If–Then)
If price holds above 5090–5120 → look for continuation into FVG, then ATH test
If price sweeps below 5090 but reclaims → classic liquidity grab → BUY continuation
If price breaks and holds below 5000 (H1 close) → deeper pullback, bullish bias pauses (not flips yet)
Key Takeaway
This is not the place to chase.
Trade reactions, not headlines.
Let Trump speak → let liquidity show → then follow structure.
Bias: Bullish continuation unless strong demand fails.

Gold Rejected at High – Sellers Take Control🔴 What the chart is saying NOW
Big rejection from 5600
Sharp breakdown below 5500
Structure shifted from bullish flag → bearish continuation
Current price ~5196
Lower high + lower low = trend flip intraday
This is distribution → breakdown, not a dip-buy anymore.
🧠 Market Bias (important)
Below 5250 = Sell on rise
Bulls invalidated for intraday
Only bounce trades, no blind buys
✅ If you want a FRESH TRADE idea (optional)
Sell below 5230
Targets: 5150 → 5080
SL: 5285

Part 3 Institutional VS. TechnicalHow Option Premium Works
The premium is the price of the option. It has two parts:
1. Intrinsic Value
The real value if exercised today.
For calls:
Intrinsic = Spot Price – Strike Price
For puts:
Intrinsic = Strike Price – Spot Price
2. Time Value
Extra value due to remaining time before expiration.
Options with more time left are more expensive because:
There’s more chance the trade will go in your favor.
Volatility increases the uncertainty (and potential profit).

Part 2 Institutional VS. TechnicalWhat Are Options?
Options are derivative contracts whose value is derived from an underlying asset—such as stocks, indices, commodities, currencies, or ETFs. There are two basic types of options:
1. Call Option
A call option gives you the right to buy the underlying asset at a fixed price (called the strike price) within a specified period.
Traders buy calls when they expect price to rise.
Profit increases as the underlying price moves above the strike price.
2. Put Option
A put option gives you the right to sell the underlying asset at the strike price within a specified period.
Traders buy puts when they expect price to fall.
Profit increases as the underlying price moves below the strike price.
Every option has two key components:
Strike Price: The price at which the asset can be bought/sold.
Expiration Date: When the option becomes invalid.

Part 1 Institutional VS. Technical
Key Components of Options- Underlying Asset: The security (stock, index, etc.) the option is based on.
- Strike Price: The price at which the underlying asset can be bought or sold.
- Expiry Date: The last day the option can be exercised.
- Premium: The price of the option contract.

VEDL 1 Day Time Frame 📊 Key Daily Price Levels (NSE)
(Current price context — road-tested from multiple live feeds)
⛳ Pivot & Intraday Reference (Daily pivot is the key bias level)
• Daily Pivot: ~₹685 – ₹719 region (major pivot range varies by source)
📈 Resistances (Upside Levels)
• R1: ~₹725 – ₹730 zone — initial resistance for bulls today
• R2: ~₹738 – ₹751 — stronger barrier area where sellers may step in
• R3: ~₹760 – ₹803 (higher overhead zone) — breakout target if momentum is strong
📉 Supports (Downside / Bounce Zones)
• Immediate Support: ~₹700 – ₹710 (near today’s intraday low mid-range)
• Next Support: ~₹689 – ₹690 (lower circuit boundary / near recent low)
• Deeper Support Zones: ₹665-₹660 cluster — a demand zone if price slips further
📌 What Today’s Price Action Looks Like
• Currently trading in a wide intraday range ~₹695–₹755 today on NSE — volatile with a broadened circuit range of ₹689.75 (LC) to ₹842.95 (UC).
• The stock has been in strong short-term uptrend, but faces selling pressure near upper resistances — this suggests cautious profit-booking near R1-R2 unless breakout with volume confirms strength.
📊 Technical Indicator Context (Daily)
⚡ RSI/oscillators on some providers show overbought conditions on short timeframe, indicating possible pullbacks if resistance holds.
Key Levels to Use for Stops/Entries:
Stop-loss (for long trades): below ₹689 (intraday structural support).
Aggressive breakout entry: above ₹738-₹750 (for momentum play).
Support test entry: near ₹700-₹690 (with tight stop).
