BUY TODAY SELL TOMORROW for 5%DON’T HAVE TIME TO MANAGE YOUR TRADES?
- Take BTST trades at 3:25 pm every day
- Try to exit by taking 4-7% profit of each trade
- SL can also be maintained as closing below the low of the breakout candle
Now, why do I prefer BTST over swing trades? The primary reason is that I have observed that 90% of the stocks give most of the movement in just 1-2 days and the rest of the time they either consolidate or fall
Resistance Breakout in OIL
BUY TODAY SELL TOMORROW for 5%
Chart Patterns

BUY TODAY SELL TOMORROW for 5% - BTST STOCK OPTIONDON’T HAVE TIME TO MANAGE YOUR TRADES?
- Take BTST Stock Option trades at 3:25 pm every day
- Try to exit by taking 4-7% profit of each trade
-Cup & Handle Breakout in SOLARINDS
BUY TODAY, SELL TOMORROW for 5%

KIRLOSENG Healthy Pullback After Strong RallyKIRLOSENG continues to trade inside a well-defined rising channel. After a strong impulsive move to the upside, the stock is now consolidating near channel support — a sign of healthy price action rather than weakness.
The structure remains bullish as long as price respects the lower trendline. A bounce from this zone could lead to another move toward the upper channel resistance around previous highs.
Trend remains intact unless the channel support breaks decisively.

MTARTECH Near Multi-Year Resistance After Strong RallyMTARTECH has made a sharp recovery from lower levels and is now moving back toward a major multi-year resistance zone that has capped price since 2021.
This resistance trendline has acted as a strong supply area in the past, leading to multiple rejections. The current move shows strength and momentum, but price is still below the long-term breakout level.
A decisive weekly close above this resistance with volume would confirm a structural breakout and open room for further upside.
Until then, this zone remains a critical area where profit booking or consolidation can occur.

GVT&D Strong Bounce From Trendline — Key Resistance AheadGVT&D has taken strong support from the falling trendline, which has acted as a key demand zone in the past.
From this support area, price has bounced sharply and is now approaching the major horizontal resistance zone where sellers have previously stepped in multiple times.
This resistance remains a crucial level to watch.
A strong breakout and close above this zone would open the door for further upside momentum.
However, if price faces rejection again from this area, consolidation or a pullback could follow.
For now, the trendline support has done its job — next move depends on how price reacts at resistance.

CRUDE is approaching crucial zoneCrude is moving up near the critical 65–65.50 decision making zone.
I anticipate considerable supply there, but more upside is anticipated if the price moves beyond 65.50.
After entering, book profits at all levels of gains.

ANET | No Fireworks, Just Higher Prices to 178 target📡 Arista Networks, Inc. (ANET)
Calm Pullback, Serious Business | Bullish Continuation Setup
🧠 Let’s be honest…
Not every stock needs fireworks to make money.
Some just do the work quietly — and ANET is one of them.
After a healthy reset, Arista is back above key value and VWAP, telling us something simple but important: big money didn’t leave — it waited.
📊 What the Chart Is Saying (No Drama)
✔ Higher-timeframe uptrend still intact
✔ Pullback respected demand (no panic selling)
✔ VWAP reclaimed → acceptance, not rejection
✔ Overhead supply mostly chewed through
Translation: This is digestion, not distribution.
🎯 Trade Plan (Clean & Disciplined)
🟢 Buy Zone
$138 – $145
Where value lives, risk is defined, and emotions stay out.
🎯 Upside Targets
Target 1: $165
Target 2: $178
Stretch Target: $195 (if momentum keeps its foot on the gas)
🔴 Stop Loss
Below $128 (daily close)
If it breaks demand, we walk away — no hero trades.
⚖️ Risk–Reward Snapshot
Risk: ~8–9%
Upside potential: 20–28%
High-confidence upside: 10–14%
Not flashy. Just efficient.
🏢 Company Profile (Why Institutions Care)
Arista Networks builds high-performance networking gear that keeps modern data centers running at scale.
🧩 Core Products
Cloud networking switches
High-speed Ethernet platforms
EOS (software-driven network OS)
🤝 Customers
Hyperscale cloud providers
AI & data-center operators
Large enterprises moving serious data
If AI is the brain, ANET is part of the nervous system.
💼 Business Model in One Line
High-margin hardware + sticky software + exploding data demand
= repeat customers with deep pockets
No gimmicks. No hype cycles. Just infrastructure that has to work.
🧭 Final Take
ANET doesn’t need to scream to move higher.
As long as price holds above the $128–130 demand zone, the path of least resistance remains up. Pullbacks are opportunities, not warnings.

Applied Materials, Inc. (AMAT) — Bullish Continuation Setup🏢 Company Snapshot
Applied Materials is a global leader in semiconductor manufacturing equipment, providing critical tools used in:
Advanced logic chips
Memory (DRAM & NAND)
Foundry and AI-driven chip production
The company sits at the center of the semiconductor supply chain, benefiting from:
AI infrastructure expansion
Advanced node transitions
Long-term global chip demand
This is not a speculative name — it’s a core industry compounder.
📌 Trade Bias: BULLISH (Trend Continuation)
Applied Materials remains one of the strongest semiconductor equipment leaders, trading in a clear higher-high / higher-low structure on both the daily and weekly charts. Price is holding above key volume acceptance zones and VWAP, indicating continued institutional participation rather than late-stage distribution.
📊 Technical Overview
Strong weekly uptrend with clean structure
Price holding above prior breakout value
Volume Profile shows acceptance above previous resistance
No major overhead supply on the higher timeframe
Pullbacks remain shallow and controlled → trend strength intact
This is a buy-the-dip environment, not a chase.
🎯 Trade Plan (Swing / Positional)
✅ Buy Zone
$330 – $345
Pullback into prior value area
Near VWAP / demand zone
Best risk-to-reward area
🎯 Targets
Target 1: $380
Target 2: $405
Extended Target: $430 (trend continuation scenario)
🛑 Stop Loss
Below $300 (daily close basis)
Loss of value acceptance
Breakdown of higher-low structure
📈 Risk–Reward
Risk: ~8–10%
Upside potential: 18–25%
High-confidence upside: 12–15%
Well-aligned for institutional-style swing trades.

DLF going to touch 613DLF is currently entering a critical price cluster between 611 – 620. This zone will likely dictate the trend for the coming days.
The Pivot Point: 613 (Mean Level)
Bullish Scenario: A sustained move above 613 backed by strong volume confirmation and a breakout of the descending trendline could trigger a rally toward 637.
Bearish Scenario: If the price fails to clear the trendline and slips below 613, expect a retracement toward the support at 596.
Note: Watch for a clean break of the converging trendlines for additional confirmation if you need.

ABB :Supply Zone Battle or Breakout?ABB is currently the talk of the town after a 7.3% intraday surge today! The stock successfully defended support at 4650 and is now testing a critical technical junction.
Fundamentals ☛
Big Win: ABB just secured a major contract from Titagarh Rail Systems to supply propulsion and control systems for Mumbai Metro Lines 5 & 6.
Milestone: This marks ABB's strategic entry into India's 25 kV AC metro segment, significantly boosting their future revenue visibility in the urban mobility sector.
Backlog Strength: The company continues to ride on a robust order backlog (last reported at ₹9,895 Cr), providing a strong cushion against market volatility.
Technically ☛
The "Supply Wall": 5080 – 5134. This zone has historically seen selling pressure. Expect a fierce battle between bulls and bears here.
The Bearish Case: If supply overwhelms at this zone, we could see a healthy retracement back to the 4785 support level.
The Bullish Case: A clean breakout and sustain above 5133 (with volume confirmation) clears the path for a "moon mission" toward 5330.
Intraday: Keep targets tight at 1% (It's my ultimate strategy for 20 years) to account for high intraday volatility (currently ~39%).
Volume Check: Look for rising volume bars on any 15-min candle breaking the 5134 mark for a safer entry.
Sentiment: Overall sentiment is turning positive as the stock has now crossed its short-term 5-day moving average.
I am not sebi registered advisor.

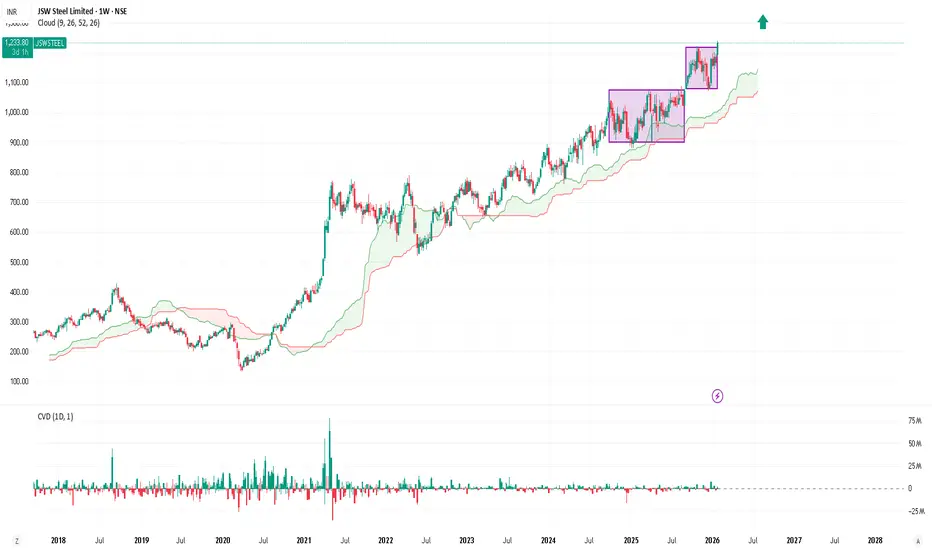
JSW Steel | Bull Continuation After Range Breakout target 1450🏭 Business Snapshot
JSW Steel is one of India’s largest integrated steel producers
Key beneficiary of infrastructure, construction, and capex-led growth
Strong domestic presence with improving capacity utilisation
Steel cycle + government infra spending provide sector tailwinds
(Business context added for background only; trade is purely technical.)
🔍 Technical Structure
Weekly chart shows a clear HH–HL staircase
Price broke out above ₹1160–1180 multi-week range
Breakout followed by healthy consolidation (no distribution)
Price holding above VWAP & EMA cluster
Volume stable → no exhaustion signs
✅ Ideal Buy Zone
₹1180 – ₹1210
Prior resistance turned support
VWAP + value area support
Avoid chasing above ₹1240
🎯 Targets
Target 1: ₹1380
Target 2: ₹1450
(Trail stop after T1 if price holds above VWAP)
❌ Stop Loss / Invalidation
₹1145 (Daily closing basis)
Below support zone
Breakdown of HL structure invalidates setup
📐 Risk–Reward
Risk: ~₹35–45
Reward: ₹160–240
R:R ≈ 1:3+
🧠 TradingView Disclaimer
This chart is shared for educational purposes only.
Levels are based on price action and market structure.
Trade only if aligned with your own risk managemen
BEL | HH–HL Structure | Swing Continuation Setup🏭 Business Snapshot
BEL is a Navratna PSU under the Ministry of Defence
Core business: defence electronics, radar systems, avionics, communication & EW systems
Strong presence in indigenisation and defence modernization programs
Order book visibility and government capex provide long-term earnings stability
(Business view added for context only; trade is based on technicals.)
🔍 Technical Structure
Weekly HH–HL structure intact
Range breakout above ₹420
Prior resistance turned demand zone
Price holding above VWAP & short-term EMAs
Breakout supported by volume expansion
✅ Ideal Buy Zone
₹410 – ₹420
Demand + high volume node
Retest zone of breakout
Avoid chasing strength above ₹445
🎯 Targets
Target 1: ₹480
Target 2: ₹520
(Trail stop after T1 if momentum sustains)
❌ Stop Loss / Invalidation
₹398 (Daily close)
Breakdown below demand
Structure invalid if HL fails
📐 Risk–Reward
Approx Risk: ₹15–20
Reward: ₹60–100
R:R ≈ 1:3 to 1:4
🧠 TradingView Disclaimer
This chart is shared for educational purposes only.
Levels are based on price action and market structure.
Trade only if aligned with your risk management.

Part 5 Best Trading Strategies Simple Example to Understand
Scenario
Nifty at 21500
You expect it to go to 21650.
Call Option Buy
Buy 21500 CE
If Nifty moves up → premium increases → profit
If Nifty falls → premium collapses → loss
Put Option Buy
Not useful in this scenario
Option Seller’s View
If seller expects market to remain sideways:
Seller sells 21600 CE
Seller sells 21400 PE
Both sides decay → seller profits

XAUUSD/GOLD CORRECTION BUY PROJECTION 29.01.26XAUUSD / Gold – Correction Buy Setup (29-01-2026)
Market View:
Gold is in a strong bullish trend. The current move is a normal correction, not a trend reversal.
Buy Zone:
Support S2 + Fair Value Gap (FVG)
0.618 Fibonacci Golden Ratio
Area around 5396 – 5400
Trade Plan:
Look for buy confirmation in the marked support zone.
Expect price to respect the uptrend line and move higher.
Targets:
First target: Resistance R1
Main target: 5600+
Stop Loss:
Below Support S2 / below recent structure low.

IPCA Labs – Trend Reversal After Long ConsolidationNSE:IPCALAB has successfully transitioned from a downtrend into a bullish structure after months of sideways consolidation. The breakout above the falling trendline followed by a controlled pullback suggests accumulation.
As long as price holds above ₹1450, the trend remains positive and a fresh breakout above ₹1500 can open the door for further upside.

XAUUSD (GOLD) | BREAKOUT VS BREAKDOWN LEVEL | 29th Jan'2026XAU/USD (Gold) Outlook | 29 Jan 2026
Gold (XAU/USD) is trading near 5513, maintaining a strong bullish structure across daily, weekly, and monthly timeframes. Price is holding well above key moving averages, indicating sustained buying momentum. As long as gold stays above the 5515–5495 support zone, the upside bias remains intact with potential continuation toward 5555–5590. A decisive break below 5495 may trigger short-term corrective pressure, but the broader trend remains positive.
Breakout & Breakdown Levels
Bullish Breakout: Above 5555 | Bearish Breakdown: Below 5495
Disclaimer: This content is for educational purposes only and not financial advice. Trading involves risk; manage your position size wisely.

ZENTECH Bullish Breakout: Falling Wedge Resolves Within Long-TerZENTECH is currently trading within a long-term triangle structure, indicating prolonged consolidation before a directional move.
On the intermediate timeframe, price has broken out of a falling wedge pattern, which is a classic bullish reversal setup.
The breakout is confirmed above the ₹1384 zone, which now acts as an important support.
If price sustains above this breakout level, the structure suggests a continuation towards higher levels.
📈 Minimum projected target: ₹1600
As always, watch for volume confirmation and price holding above the breakout zone for further strength.
#ElliottWave #ChartPatterns #FallingWedge #Triangle #BullishBreakout #TechnicalAnalysis

Gold at Make-or-Break Zone | Channel Support Under TestGold is currently trading inside a rising channel and has pulled back toward the lower side of the structure. This move looks more like a healthy correction rather than a breakdown, as long as price continues to hold the marked support area.
If buyers step in near channel support, upside continuation remains possible toward the higher zone. A clear break below support, however, would weaken the structure and shift the bias to the downside. For now, this is a wait-and-react zone, not a chase.
⚠️ Disclaimer
This analysis is for educational purposes only and should not be considered financial advice. Trading involves risk. Please do your own research and use proper risk management.

TATASTEEL C&H WEEKLY BREAKOUTTatasteel breaking c&h pattern weekly basis
trading at ATH,metal sector doing well
good volume last few weeks
RSI above 60,macd crossover seen
immediate target 206,after breaking 206 can lead toward 227
NO BUY/SELL RECOMENDATION

Part 4 Technical Analysis Vs Institution Option TradingA. When to Buy Options
Breakout from consolidation
High volume at breakout
Trend confirmed
IV low → premiums cheap
Clear direction available
B. When to Sell Options
Range-bound market
No trending structure
IV high → premiums expensive
Event after event → IV crash expected

GOLD MAINTAINS BULLISH TREND POST-FOMC; VOLATILITY RISKS📰 FOMC Update (Jan 29)
The Fed kept rates unchanged, as expected.
Powell remained data-dependent, avoiding any aggressive hawkish shift.
Markets read this as no urgency to tighten further, keeping real yields capped.
Result: USD hesitates → Gold volatility expands, but trend stays intact.
This is not “buy the news” — it’s flow reacting to policy clarity.
📊 Technical Structure (H1–H4 Context)
Clear bullish Break of Structure before FOMC → trend already established.
Post-FOMC impulse pushed price into ATH territory, followed by a healthy pullback.
No bearish Change of Character confirmed → structure remains bullish continuation, not distribution.
Price is correcting within trend, not reversing.
🔑 Key Zones to Watch
ATH / Premium Reaction: ~5560
FVG 1 (shallow pullback): ~5436
FVG 2 (deeper rebalancing): ~5353
These are reaction zones, not FOMO levels.
🧠 Scenarios (If – Then)
Primary Scenario – Continuation (≈70%)
If price holds above 5436, expect continuation toward new highs after rebalancing.
Alternative Scenario – Deeper Pullback (≈30%)
If 5436 fails, price may rebalance into 5353 FVG.
Only a clear H1 close below 5353 would weaken the bullish bias.
✅ Summary
FOMC created volatility, not a trend change.
Gold is respecting structure, absorbing liquidity, and preparing for the next leg.
Trade the reaction, not the headline.
Buy pullbacks. Respect structure. Let price confirm.

Part 3 Technical Analysis Vs Institution Option TradingImportant Tools for Option Trading
Option Chain (NSE)
TradingView
Volume Profile
Market Structure
Open Interest
India VIX
PCR
Institutional flow
Heatmaps

hind copper crucial update after breakout hind copper trading in close range if break 578 or sustain abv than will see 630--700+++ soon or blow 500 level can we see 465++++ in short term these are in terms of short term . where copper demand looks like zoom
