Nifty spot 25320.65 by Daily Chart view - Weekly UpdateNifty spot 25320.65 by Daily Chart view - Weekly Update
- Support Zone 24775 to 25075 for Nifty Index
- Resistance Zone 25325 to 25625 for Nifty Index
- Nothing major Domestically except for the unwarranted Geo-Political scenario affecting our Stock Markets
Chartpatternanalysis

CCL Products cmp 970.50 by Daily Chart viewCCL Products cmp 970.50 by Daily Chart view
- Support Zone 890 to 930 Price Band
- Resistance Zone 970 to 1015 Price Band
- Volumes in close sync with avg traded qty
- Rising Price Channel seem been well sustained
- Descending Triangle pattern breakout anticipated
- Technical Indicator trending positively thru Jan 2026

Axis Bank Ltd Daily Chart. Chart Pattern1. The chart pattern : Rounding Bottom Pattern:
Indicates a gradual reversal from a downtrend to an uptrend.
The white‑outlined area shows the consolidation phase forming the “bowl” shape.
A breakout above the resistance (upper rim of the bowl) would confirm the reversal and trigger a bullish move.
2. EMA Analysis:
EMA 21 (purple line) is crossing above EMA 55 (green line), showing short‑term momentum shift to bullish.
EMA 55 is above EMA 100 (blue line) and EMA 200 (orange line), indicating medium‑term bullish alignment.
Price is above all EMAs, suggesting strong support from the moving averages.
3. Volume:
Volume spikes during the decline into the bottom and increases near the breakout zone, confirming interest and potential strength in the reversal.
Watch for higher than average volume on the breakout to validate the move.
4.The View :
Measure the depth of the rounding bottom (from the lowest point to the rim) and project that distance upward from the breakout level.
Stop‑Loss: Place the SL below the recent swing low of the rounding bottom to protect against a false breakout.

Bank Nifty spot 59610.45 by Daily Chart view - Weekly UpdateBank Nifty spot 59610.45 by Daily Chart view - Weekly Update
- Support Zone 58850 to 59350 for Bank Nifty
- Resistance Zone 59900 to ATH 60437.35 for Bank Nifty
- Bank Nifty seems more matured then Nifty to contain the unwarranted Geo-Political scenario and trending up for New ATH

TDPOWERSYS 1 Day Time Frame 📊 Live/Intraday Summary (Today’s Trading)
• Current price: ~₹735 – ₹745* (showing a strong upside on the day).
• Day’s high: ₹767.95.
• Day’s low: ₹642.30.
• Previous close: ₹676.90.
• Range (1‑day): ₹642.30 – ₹767.95.
• Volume: Several million shares traded (indicating active intraday participation).
• Circuit limits: Upper ₹812.25 / Lower ₹541.55.
📈 Intraday Price Behavior (1‑Day Chart Insight)
Although I can’t draw the live chart, major market data sources show the stock rising significantly above its previous close, with intraday volatility spanning over ₹125+, suggesting strong buying interest today.
🔎 What this means for your 1‑day view
The stock opened lower near ₹661 and trended up strongly, testing higher intraday levels toward ₹767+ — a bullish intraday range.
Today’s range and levels are useful for intraday support/resistance as:
• Support: ~₹640 – ₹660 (earlier day lows).
• Resistance: ~₹760 – ₹770 (near today’s high).
⚠️ Notes
• Market prices intraday change rapidly — data above reflects the latest available snapshot for today’s session.
• If you’re planning trades, check real‑time charts from your broker or a live market platform (e.g., NSE/BSE or charting tools like Chartink).

HMVL 1 Month Time Frame 📊 Current Price Snapshot (Latest Close)
- Approximate latest price: ₹70.9 – ₹72.2 per share (data from multiple live sources on 23 Jan 2026) showing HMVL trading around ~₹71–₹72 levels.
- Intraday range: ₹69.00 – ₹72.00 recently observed.
- 52‑week range: ₹61.76 (low) to ₹103.40 (high).
📈 1‑Month Performance
- Over the past 1 month, the stock’s performance shows a slight decline or mild sideways move: approx −1 % to −3 % change depending on the exact start/end dates used (TradingView indicated ~‑2.75 % monthly fall).
- Other data suggests very modest monthly change (slight positive/negative depending on source).
📅 Recent Daily Price Levels (Indicative)
From historical price data for the first half of January 2026:
01 Jan 2026: ~₹68.5
06 Jan 2026: ~₹70.4
09–12 Jan 2026: ~₹66‑₹69
16–23 Jan 2026: ~₹69‑₹72
→ This shows a 1‑month trading range roughly between ~₹65 and ~₹72.
📍 1‑Month Key Levels to Watch
Support zone: ~₹65 – ₹67 (recent lows).
Near‑term resistance: ~₹72 – ₹74 (recent highs).
Mid‑range pivot: ~₹69 – ₹71 — recent close vicinity area.

Cummins India cmp 3930.40 by Daily Chart viewCummins India cmp 3930.40 by Daily Chart view
- Support Zone 3885 to 3965 Price Band
- Resistance Zone 4165 to 4250 Price Band
- Support Zone reversal observed for stock price
- Volumes need to increase to push price on upside trend
- Price consolidation seen within 3885 to 4110 since mid Jan 2026

Bank Nifty spot 58473.10 by Daily Chart view - Weekly UpdateBank Nifty spot 58473.10 by Daily Chart view - Weekly Update
- Support Zone 57665 to 58250 for Bank Nifty
- Resistance Zone 58850 to 59350 for Bank Nifty
- Since a while the indicative Support and Resistance Zone are just an eyewash as they hardly sustain by the unprecedented Geo-Political happenings

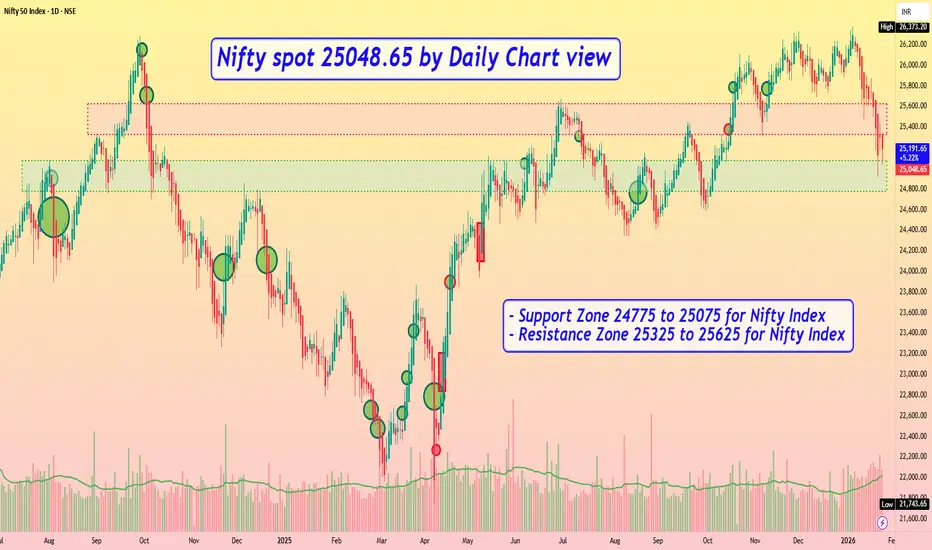
Nifty spot 25048.65 by Daily Chart view - Weekly UpdateNifty spot 25048.65 by Daily Chart view - Weekly Update
- Support Zone 24775 to 25075 for Nifty Index
- Resistance Zone 25325 to 25625 for Nifty Index
- Since a while the indicative Support and Resistance Zone are just an eyewash, as they hardly sustain by the unprecedented Geo-Political happenings
Nifty spot 25694.35 by Daily Chart view - Weekly UpdateNifty spot 25694.35 by Daily Chart view - Weekly Update
- Support Zone 25425 to 25725 for Nifty Index seems grounded
- Resistance Zone 26000 to 26200 >>> ATH 26373.20 for Nifty Index
- Nifty is facing the fear factor syndrome shadowed by clouds of caution
- Positive ripples trying to enable Nifty regain up-move with hopes for continuity

Bank Nifty spot 60095.15 by Daily Chart viewBank Nifty spot 60095.15 by Daily Chart view
- Support Zone 59125 to 59525 for Bank Nifty
- Resistance Zone 60110 to ATH 60437.35 for Bank Nifty
- Positive ripples enabling Bank Nifty regain up-move and hope for continuity

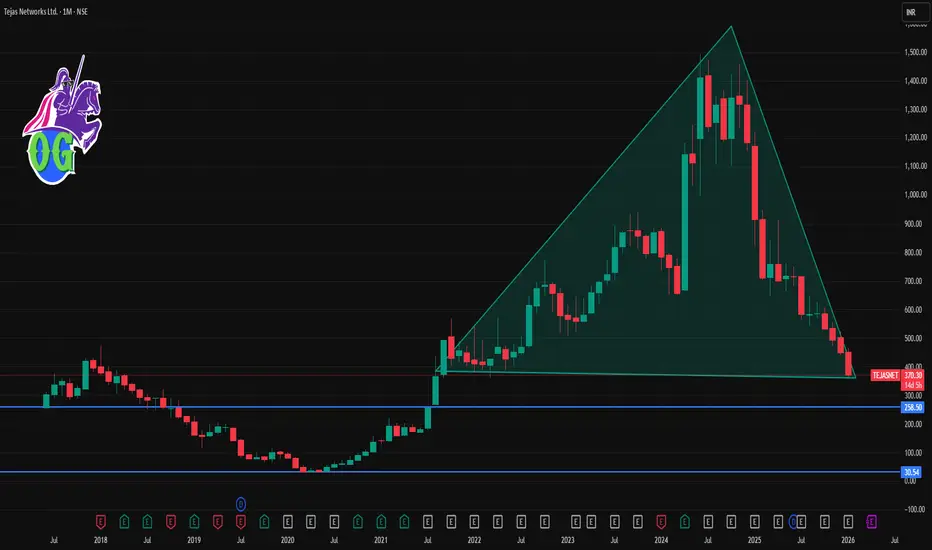
TEJASNET 1 Month Time Frame 📊 Current Price Context (as of mid‑January 2026)
Tejas Networks is trading around ₹370‑₹375 on NSE/BSE.
The stock recently hit a 52‑week low near ₹364 after weak quarterly earnings and sales decline.
📉 Short‑Term Technical Levels (1‑Month View)
🔻 Immediate Support Zones
These are levels where the stock could find buyers or stall further declines:
₹366‑₹370 — current short‑term support (intraday pivot & recent low).
₹362‑₹366 — lower pivot/secondary intraday support.
~₹356‑₹362 — deeper support if momentum remains weak.
📈 Resistance Levels (Upside Hurdles)
For any bounce or recovery attempt:
₹377‑₹380 — near current pivot/resistance range.
~₹390‑₹395 — next resistance zone (prior price congestion).
₹405‑₹410+ — stronger resistance (short‑term target for recovery).
🧠 Trading/Price Action Tips (1‑month)
Bullish Scenario (countertrend bounce):
A break above ₹380‑₹390 with good volume could shift short‑term sentiment and target ₹405‑₹410+.
Bearish/Continued downtrend:
If support at ₹366‑₹370 breaks convincingly, the next zone near ₹362 then ₹356–₹360 becomes focus.
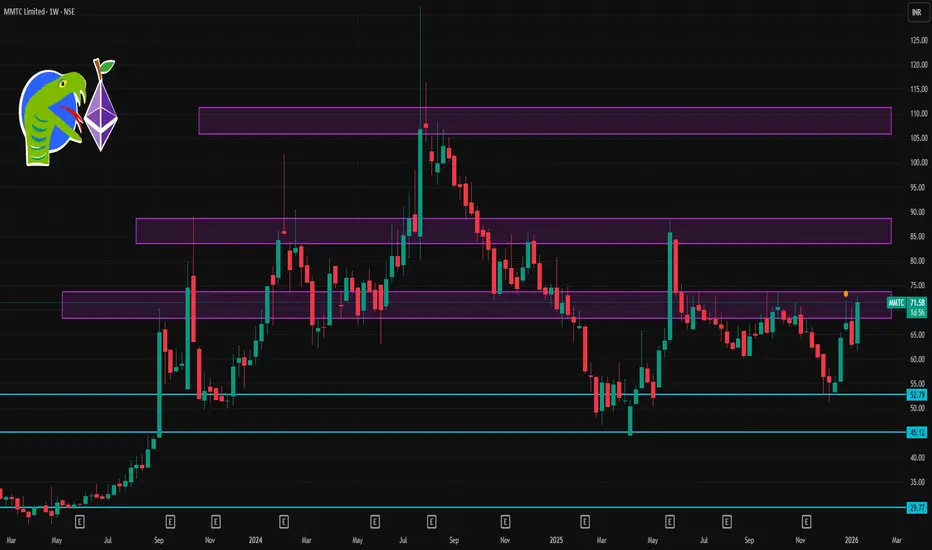
MMTC 1 Week Time Frame 📌 Current Price Snapshot
Latest traded price: ~₹71.5 – ₹72.7 on NSE today with strong intraday volatility. Daily high ~₹72.70 and low ~₹63.86.
This wide daily range suggests higher volatility this week — at least through the next few sessions.
📊 Short‑Term Weekly Levels
🔹 Resistance (Upside)
These are levels where price may face selling pressure or slow gains:
1. ₹72.5 – ₹73.0 — Immediate resistance area (today’s local high).
2. ₹75.0 – ₹76.0 — Next bullish pivot region if the stock holds above ₹72.5 (based on momentum models).
3. ₹78.0 – ₹80.0 — Stronger weekly upward pull target if bullish continuation holds.
👉 Closing above ₹75 on the weekly timeframe would indicate stronger short‑term bullish structure.
🔻 Support (Downside)
Levels where buyers may step in on pullbacks:
1. ₹66.0 – ₹67.0 — First dynamic support (near shorter moving averages).
2. ₹62.0 – ₹63.5 — Key lower support zone (recent daily lows).
3. ₹60.0 – ₹61.0 — Deeper weekly support — important to watch if breakdown accelerates.
👉 A break below ₹62 on weekly closes would weaken the bullish outlook and could open the door toward deeper supports.
📈 Technical Indicator Context
Technical breadth is largely bullish/momentum supportive:
📌 Moving Averages:
5, 10, 20, 50, 100, and 200‑day MAs all skew Buy — suggesting bullish trend alignment.
📌 RSI (14): ~65 — trending up but not yet extremely overbought.
📌 Stoch/RSI: Overbought on shorter timeframes — may hint at near‑term consolidation before higher breakout.
Summary: Momentum still skewed bullish overall, but short‑term traders should watch for near‑term pullbacks or consolidations due to overbought signals.
BSE cmp 2790.60 by Daily Chart viewBSE cmp 2790.60 by Daily Chart view
- Support Zone 2570 to 2670 Price Band
- Resistance Zone 2790 to 2915 Price Band
- Bullish "W" Double Bottom by Support Zone base
- Rising Support Trendline well sustained and respected
- Falling Resistance Zone Trendline Breakout been attempted
- Volumes spiked today with good sync with the avg traded qty

NACL Inds cmp 167.40 by Daily Chart viewNACL Inds cmp 167.40 by Daily Chart view
- Support Zone 150 to 160 Price Band
- Resistance Zone 174 to 184 Price Band
- Considerate Darvas Box Setup with Bullish Rounding Bottoms
- Technical Indicators seems like turning to a positive momentum

HLE Glascoat cmp 436.50 by Daily Chart viewHLE Glascoat cmp 436.50 by Daily Chart view
- Support Zone 406 to 433 Price Band
- Resistance Zone 467 to 494 Price Band
- Volumes in close sync with average traded quantity
- Falling Resistance Trendline Breakout seems sustained
- Darvas Box setup repeated, hope for price trend upside

Madras Fertilizers cmp 80.25 by Daily Chart viewMadras Fertilizers cmp 80.25 by Daily Chart view
- Support Zone 76.25 to 79.25 Price Band
- Resistance Zone 83.50 to 87.50 Price Band
- Bullish *W* upwards inclined by the Resistance Zone neckline
- Falling Resistance Trendlines, 1st Breakout done, next coming soon
- Volumes spiked heavily last week Thursday by demand based buying

Bank Nifty spot 59251.55 by Daily Chart view - Weekly UpdateBank Nifty spot 59251.55 by Daily Chart view - Weekly Update
- Support Zone 58575 to 58900 for Bank Nifty
- Resistance Zone 59550 to 59850 for Bank Nifty
- Deep rooted Fear plus Geo-Political events dampening Domestic Markets

Nifty spot 25683.30 by Daily Chart view - Weekly UpdateNifty spot 25683.30 by Daily Chart view - Weekly Update
- Support Zone 25425 to 25725 for Nifty Index
- Resistance Zone 26000 to 26200 >>> ATH 26373.20 for Nifty Index
- Deep rooted Fear plus Geo-Political events dampening Domestic Markets

SOLARINDS - STWP Equity Snapshot📊 STWP Equity Snapshot – SOLARINDS
(Educational | Chart-Based Interpretation)
Solar Industries India Ltd
________________________________________
📌 Intraday Reference Levels (Structure-based | Observational)
Reference Price Zone: 13,739
Risk Reference (Structure Invalidation): 13,089
Observed Upside Zones (Supply Ahead):
14,518 → 15,039
________________________________________
📌 Swing Reference Levels (Hybrid Model | 2–5 Days | Observational)
Reference Price Zone: 13,739
Risk Reference (Structural Breakdown): 12,764
Higher Range Projection (If structure sustains):
15,689 → 17,151
________________________________________
🔑 Key Levels – Daily Timeframe
Support Zones:
13,290 | 13,129 | 12,904
Resistance Zones:
13,766 | 13,901 | 14,062
________________________________________
🔍 STWP Market Read
SOLARINDS is displaying a strong recovery structure from a well-defined demand zone, following an extended corrective phase. Price has reclaimed intermediate resistance with impulsive candles and expanding volume, suggesting renewed buyer dominance rather than a weak pullback bounce.
Momentum indicators remain supportive, with RSI near 64.7, indicating strength without immediate exhaustion. Volume participation is decisively above average (Vol X ~2.11), highlighting institutional involvement during the recovery leg. Overall structure reflects trend continuation potential, while risk remains elevated due to prior overhead supply zones.
________________________________________
📊 Chart Structure & Indicator Summary
Structure: Demand-led recovery with breakout attempt
Trend: Upward bias developing
Momentum: Strong and expanding
RSI: Bullish zone, not overextended
Volume: High, confirming participation
Volatility: Expanding (normal in trend resumption phase)
________________________________________
📈 Final Outlook (Condition-Based)
Momentum: Strong
Trend: Up
Risk: High (wide range & supply overhead)
Volume: High
________________________________________
💡 STWP Learning Note
Strong moves are sustained by structure and participation, not predictions. The edge lies in risk calibration, patience, and clean post-trade reviews—not forecasting outcomes.
________________________________________
⚠️ Disclaimer
This content is an educational market interpretation based on chart structure and publicly available data. It does not constitute investment advice, a recommendation, or solicitation. Markets involve risk. Please consult a SEBI-registered financial advisor before making any trading or investment decision.
📘 STWP Approach
Observe momentum. Respect risk. Let structure guide decisions.
🚀 Stay Calm. Stay Clean. Trade With Patience.
💬 Did this add value?
🔼 Boost to support structured learning
✍️ Share your views or questions in the comments
🔁 Forward to traders who value disciplined analysis
👉 Follow for clean, probability-driven STWP insights
🚀 Stay Calm. Stay Clean. Trade With Patience.
Trade Smart | Learn Zones | Be Self-Reliant 📊

REDINGTON 1 Week Time Frame 📌 Weekly Pivot‑Based Levels (from Moneycontrol weekly pivots)
(These are derived from weekly price action, giving support & resistance zones used by chart traders)
Resistance (Weekly)
R1: ~ ₹282.77
R2: ~ ₹289.23
R3: ~ ₹300.12
Pivot (Weekly Reference):
Pivot Point: ~ ₹271.88
Support (Weekly)
S1: ~ ₹265.42
S2: ~ ₹254.53
S3: ~ ₹248.07
📊 Interpretation:
Above ₹282–₹289 zone → broader weekly bullish bias if sustained toward ₹300+.
Below ₹265–₹271 pivot/support zone → weekly downside risk increases.
📊 Current Price Reference
NSE live price is trading around ~ ₹289–₹290+ on 8 Jan 2026.
📊 Summary – Key Weekly Levels to Watch
Level Price (Approx) Significance
Weekly Resistance 3 (R3) ₹300.12 Bullish breakout region
Weekly Resistance 2 (R2) ₹289.23 Near current price – short‑term hurdle
Weekly Resistance 1 (R1) ₹282.77 First weekly resistance
Weekly Pivot ₹271.88 Trend reference – bulls above
Weekly Support 1 (S1) ₹265.42 Key downside support
Weekly Support 2 (S2) ₹254.53 Deeper support
Weekly Support 3 (S3) ₹248.07 Extended downside support
📌 Bullish weekly bias is intact as long as price stays above the weekly pivot (~₹271‑₹272) and clears ₹282‑₹289 convincingly. Below ₹265, the next support zone becomes active.

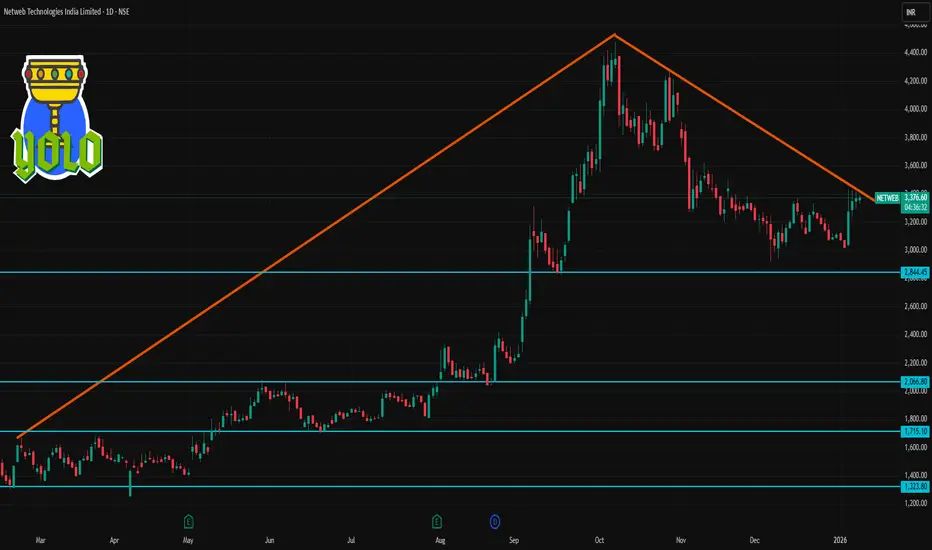
NETWEB 1 Day Time Frame 📌 Current Price (Approx)
NETWEB ~ ₹3,347–₹3,368 on NSE (latest market price) — this is the recent traded range as markets open/continue today.
📊 Daily Technical Levels (1-Day Chart)
Pivot Point (Key Reference)
Pivot: ₹3,335–₹3,359 area — central decision zone for bulls vs bears.
🔥 Resistance Levels (Upside)
1. R1: ₹3,436–₹3,437 — first resistance zone.
2. R2: ₹3,525–₹3,526 — next upside hurdle.
3. R3: ₹3,626–₹3,627 — extended breakout target.
📉 Support Levels (Downside)
1. S1: ₹3,246–₹3,247 — immediate support.
2. S2: ₹3,145–₹3,145 — intermediate support line.
3. S3: ₹3,056–₹3,056 — deep support level.
📌 How to Use These Levels Today
Bullish bias: If price stays above pivot (~₹3,350) and breaks R1 ~₹3,436, next targets are R2 and R3.
Bearish bias: If price drops below S1 (~₹3,246), watch S2 and S3 for possible pullbacks/support zones.
📊 Short-Term Technical Mood
Pivot levels suggest an active trading range today — traders often use these references for intraday entry/exit.
RSI/MACD short-term signals are mixed to neutral, indicating a balanced fight between bulls and bears (not strongly overbought nor oversold on daily).
ITC 1 Day Time Frame 📌 Current Price Context (approx):
ITC is trading around ₹340–₹342 on the NSE — near recent multi-year lows (52-week low ~₹337.75).
📊 Daily Pivot / Support & Resistance Levels (Based on Recent Technical Data)
📈 Pivot Reference
Since live pivot recalculation varies by platform, here’s a reliable contemporary pivot zone used by many traders around this range:
Pivot (reference level): ~₹349.90
🚧 Resistance Levels (Upside)
R1: ~₹353.75
R2: ~₹357.80
R3: ~₹361.65
These levels are based on the latest intraday pivot analysis and represent potential upside hurdles if price attempts a bounce.
🛡 Support Levels (Downside)
S1: ~₹345.85
S2: ~₹342.00
S3: ~₹337.95
These supports coincide closely with the recent 52-week low area and nearby price action where demand may re-emerge.
📉 Typical Daily Trading Range (Indicative)
Immediate Range for Today: ~₹337.9 — ₹361.6 (approx)
This zone gives a sense of where daily swings might play out before breakout/breakdown action.
📌 What This Means for Traders
📍 Above pivot / R1 (₹353-₹355): Bullish attempt; could push toward R2/R3 if volume supports.
📍 Between support range (₹342-₹346): Choppy / consolidation zone — watch for breakout direction.
📍 Below S2 (~₹342): Bearish pressure; if price dips below ~₹338, sellers may dominate short term.
