ANANTRAJ 1 Week Time Frame 📌 Live Price Snapshot (Today)
Current price: ~₹516 – ₹521 on NSE (prices vary slightly by source)
Day range so far: ~₹506 – ₹533
52-week range: ₹376.15 (low) to ₹947.90 (high)
📉 Nearby Intraday Levels (Daily Pivots)
Daily Pivot: ~₹514
Resistance today: ~₹523–₹529
Support today: ~₹499–₹493
📍 How to Use These Levels This Week
Bullish Scenario
✅ If price closes above ₹545 (weekly pivot) — momentum may pick up toward ₹565 → ₹603 zones.
Neutral / Range
➡ Price staying between ₹506 ~ ₹545 → likely sideways consolidation this week.
Bearish Scenario
❌ Break below ₹506 support — targets slide toward ₹486 → ₹448.
Chartpatternanalysis

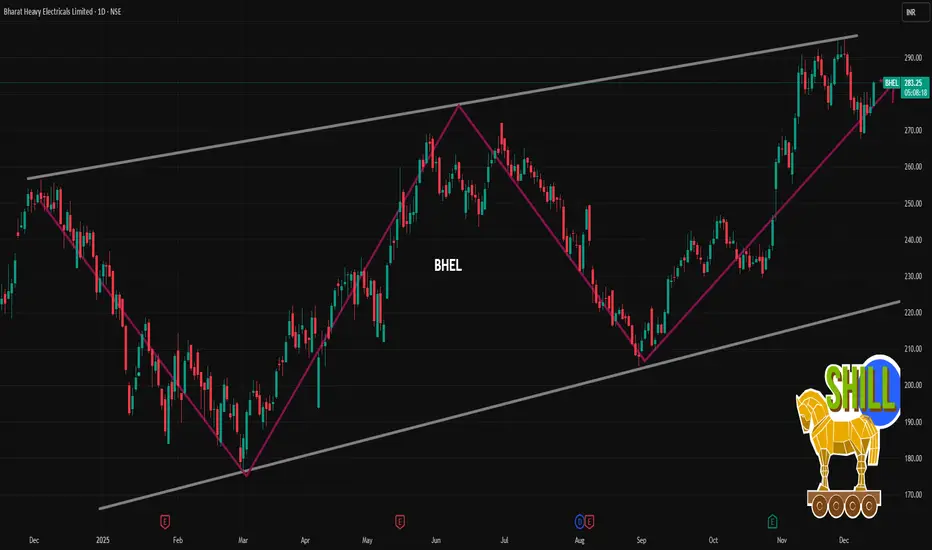
BHEL 1 Day Time Frame 📈 Live/Latest Price (1-Day View)
Current Price (approx): ~₹280.50–₹283.30 per share on NSE (latest intraday range) based on market data today.
Today’s Intraday High/Low: Roughly ₹273–₹279+ so far.
Previous Close / Today Open:
• Previous close near ₹277.75.
• Open around ₹275–₹286 depending on platform/time.
52-Week Range: Low ~₹176, High ~₹291–₹295+.
📊 1-Day Price Change
Recent trading shows relatively small daily movement indicating modest volatility typical of larger PSU stocks.
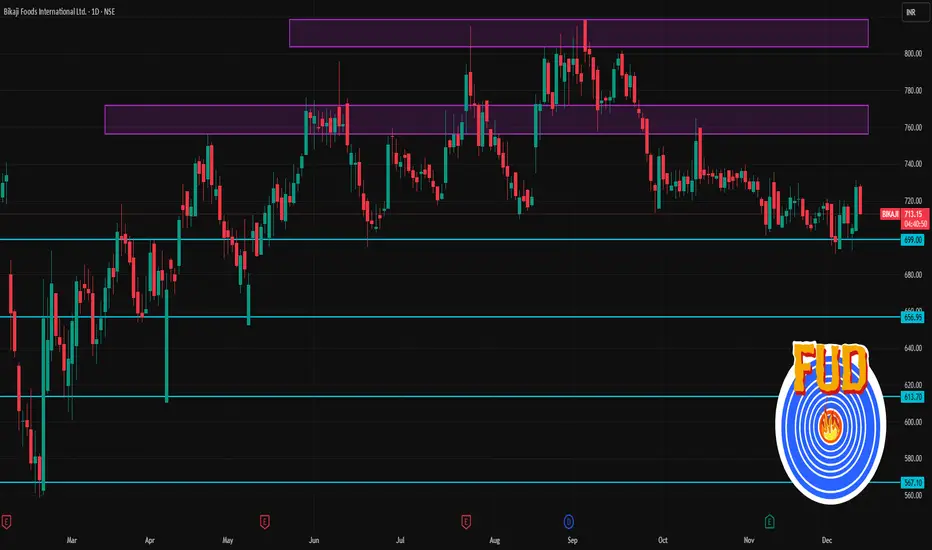
BIKAJI 1 Day Time Frame 📈 Recent Price & Basic Info
Latest price (NSE / BSE) ~ ₹725.60 (close on 10-Dec-2025)
Day’s range: ~ ₹703.90 to ₹731.15.
52-week range: ₹558.80 (low) to ~ ₹864.00 (high)
🧭 Support / Resistance / Pivot-based Levels (Daily)
From pivot-analysis (classic / Fibonacci / others) :
Pivot / Level Price (₹) / Range
Pivot (daily) ~ ₹724.95
Support 1 (S1) ~ ₹722–723 — near pivot
Resistance 1 (R1) ~ ₹727–728
Upper zones / Higher resistances (R2/R3) ~ ₹729–732
Indicative lower support zones (if price dips) ~ ₹699–¥690+
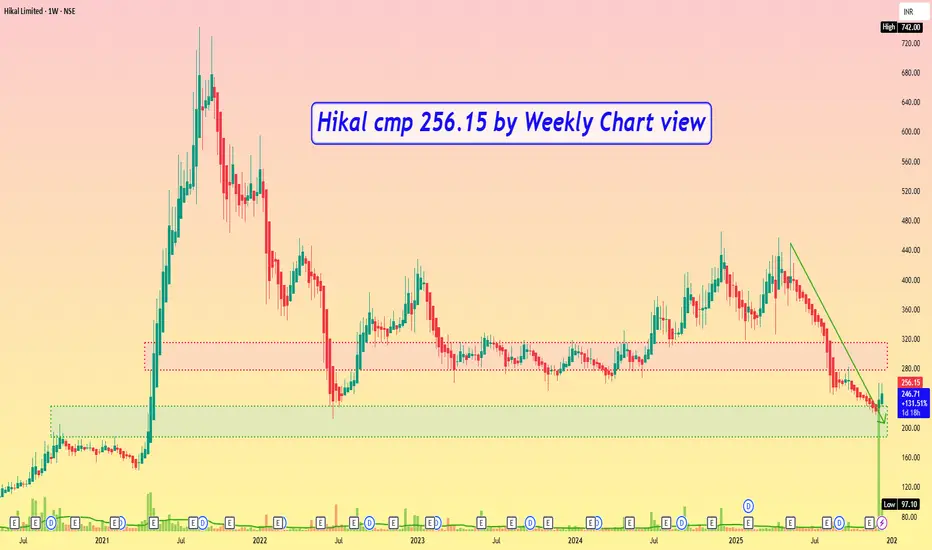
Hikal cmp 256.15 by Weekly Chart viewHikal cmp 256.15 by Weekly Chart view
- Support Zone 188 to 229 Price Band
- Resistance Zone 278 to 315 Price Band
- Support tested retested over past 4 weeks
- Falling Resistance Trendline Breakout done
- Volumes surge by demand based buying in last 2 weeks
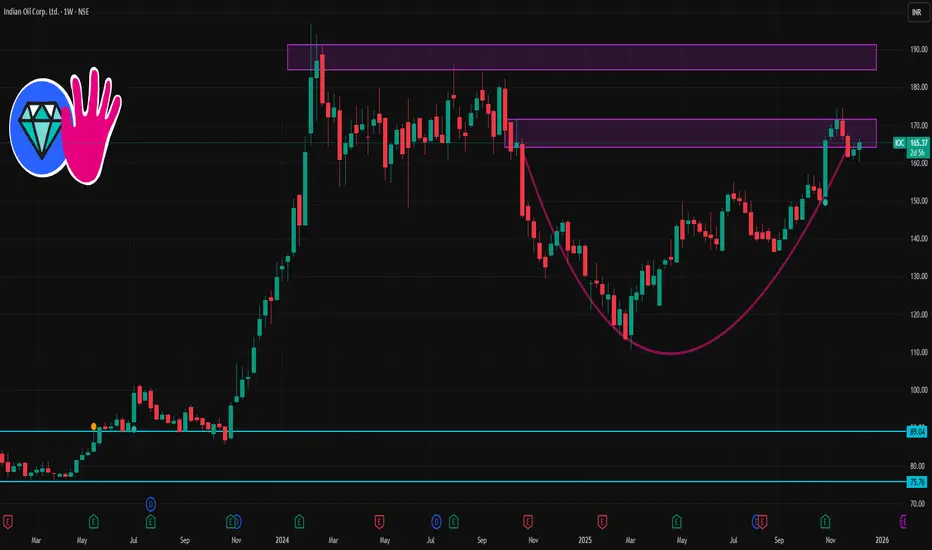
IOC 1 Week Time Frame 🔎 Current Snapshot
Latest price on NSE: ~ ₹163.00–₹163.50.
52‑week trading range: ₹110.72 (low) ⇒ ₹174.50 (high).
On moving averages: price is above 50‑day, 100‑day and 200‑day MA — a bullish structural sign, though short‑term oscillators are mixed/neutral.
Recent 1‑week performance: modest gains (price near upper of recent short‑term range) — suggests a cautious bullish bias, not a runaway rally.
✅ My “Base‑Case” 1‑Week Scenarios
Scenario A – Mild Bullish (likely): Price hovers between ₹160–165, bouncing off support ~₹160 and possibly testing ₹165–166.
Scenario B – Bullish Breakout (if catalysts align): Break above ₹165–166 → move toward ₹167–168 (maybe touching ₹170).
Scenario C – Weak/Neutral (in adverse market): If oil/market turns negative & price breaks below ₹160, watch for dips toward ₹158–159.
COALINDIA 1 Week Time Frame 📊 Key Context
Current price is ~ ₹379–380.
52‑week high/low: ~ ₹425–426 high, ~ ₹349–349.5 low.
Recent technical reports show a shift to a more “bearish/neutral” momentum—weekly MACD / moving‑average signals are negative.
🎯 Short‑Term (1‑Week) Levels to Watch
Level Role / Significance
₹374–376 Support zone — near recent intraday lows; a break below may
signal further downside.
₹370 Secondary support — close to the lower end of recent
consolidation; a strong bounce from here could attract buyers.
₹385–388 Near‑term resistance / range ceiling — in line with recent
intraday highs and short‑term moving averages.
₹390–392 Key resistance breakout zone — if price sustains above this,
short‑term bullish momentum may resume.
₹400 (round‑number mark) Psychological / tactical upside target — a breakout push toward
this will likely draw interest from swing traders.

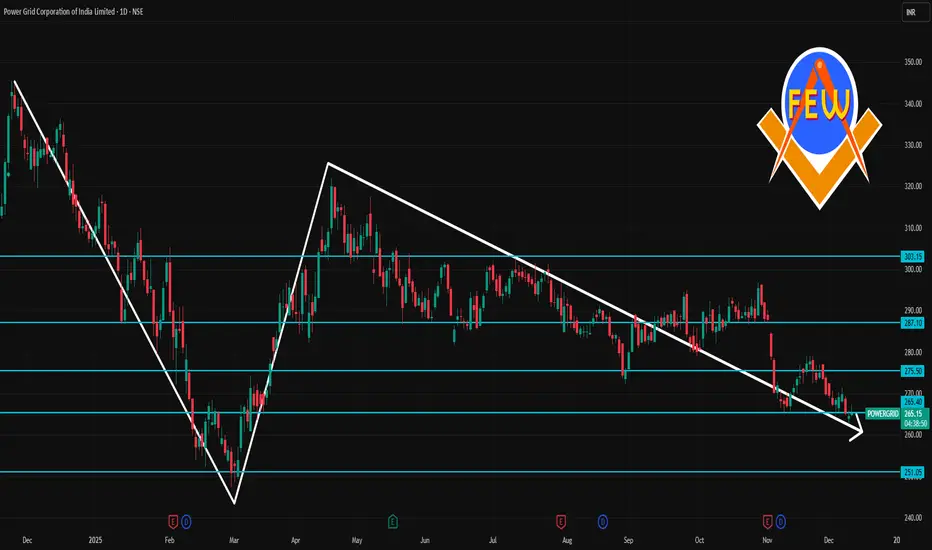
POWERGRID 1 Day Time Frame 📊 CURRENT PRICE (Approx, Live Intraday)
₹263 – ₹266 approx range today as of latest data.
These are derived from today’s price movements and expected intraday behaviour:
✅ Pivot Point (Central Reference)
Pivot: ~ ₹264.4 – ₹265.9
📈 Resistance Levels
R1: ~ ₹265.9 – ₹266.0
R2: ~ ₹267.25
R3: ~ ₹268.75
📉 Support Levels
S1: ~ ₹263.05
S2: ~ ₹261.55
S3: ~ ₹260.20
These reflect short-term intraday pivot support & resistance derived from price movement and are useful for 1-day trading decisions (breakouts or pullbacks).
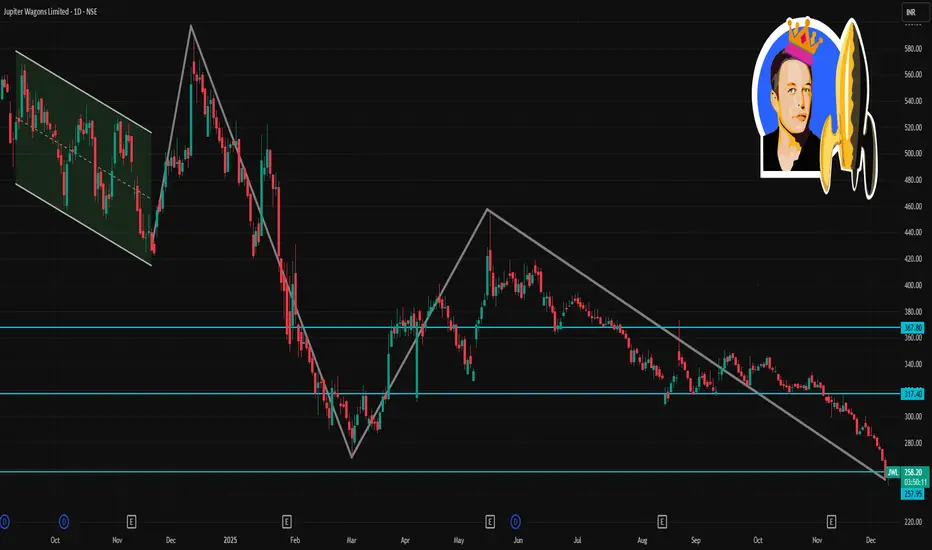
JWL 1 Day Time Frame 📌 Key recent price and context
Recent quoted share price of JWL is ~ ₹254–267 (on NSE/BSE, depending on source/time).
The 52‑week high / low range for JWL has been roughly ₹588 (high) and ₹266 (low).
🔧 Key 1‑Day Support / Resistance / Pivot Levels
Based on most recent public pivot‑point / support‑resistance breakdowns:
Level Approximate Price / Range
Immediate Support (S1) ~ ₹263.6
Lower Support (S2 / S3) ~ ₹260.2 and ~ ₹254.3
Pivot / Intra‑day Reference ~ ₹269.5
First Resistance (R1) ~ ₹272.9
Second Resistance (R2) ~ ₹278.9
Third / Upper Resistance (R3) ~ ₹282.3
Interpretation (for 1‑day horizon):
On a decline, watch ₹263.5–₹260 as first support zone — a drop below ₹254–₹255 could open up downside risk.
On a bounce/recovery, ₹272–273 may act as first resistance zone; ₹278–282 as the key target or supply zone.
If price trades near the pivot (~₹269), price action and volume around that will decide intraday bias (whether sellers or buyers dominate).
KAYNES 1 Day Time Frame 📉 Current Price & Recent Context
Current (latest) price is around ₹ 4,132 – ₹ 4,141.
On 8 Dec, the stock’s intraday high was ~ ₹ 4,531.15, and intraday low ~ ₹ 4,125.55.
The 52‑week range remains ₹ 3,825.15 (low) to ₹ 7,822.00 (high).
🔎 Key Short‑Term Support & Resistance Zones
Based on intraday price action, pivot–point analysis (as per publicly available technical data) and recent trading range:
Support Zone (near‑term): ~ ₹ 4,120 – ₹ 4,130 (the intraday low touched ~ ₹ 4,125.55)
Lower Support (next): ~ ₹ 3,825 – ₹ 3,900 (near 52‑week low)
Resistance / Pivot Zone: ~ ₹ 4,770 – ₹ 4,950 (near intraday high + recent day’s upper range)
Higher Resistance Zone (if market recovers strongly): ~ ₹ 5,200–₹ 5,400+ (but note: much of this is well above current range — would require strong bullish breakout)
Interpretation (near‑term):
The ₹ 4,120–₹ 4,130 level is a critical short‑term support — a breakdown below this could test the 52‑week‑low zone near ₹ 3,825–₹ 3,900.
On the upside, the first hurdle is near ₹ 4,770–₹ 4,950. Clearing that convincingly could open up a move toward the ₹ 5,200–₹ 5,400 area — but given current bearish pressure, that seems a medium‑term scenario only.

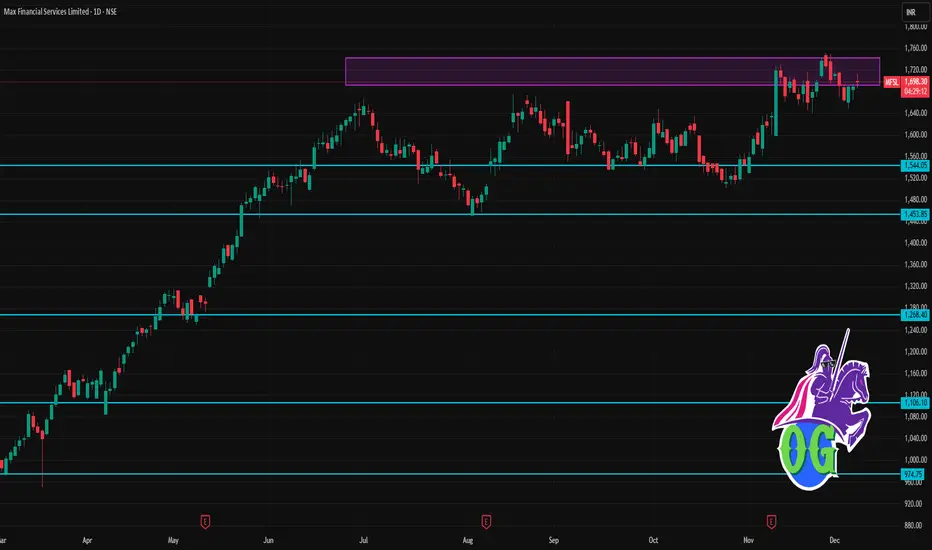
MFSL 1 Day Time Frame 📌 Current status
Latest quote for MFSL is ≈ ₹1,690.20.
52‑week range: Low ~ ₹950 — High ~ ₹1,751.40.
According to one technical‑analysis provider, the short‑term/mid‑term/long‑term bias remains bullish, though price is currently a few percent below recent resistance.
🎯 What this implies (on 1‑day timeframe)
As long as MFSL stays above S1 (~₹1,670), the short‑term trend remains stable; dips toward S2/S3 (~₹1,646 / ₹1,622) could offer re‑entry opportunities if price action stabilizes.
A breakout above R1 (~₹1,716–1,737) and sustained move toward R2 (~₹1,740–1,764) could open up upside potential toward R3 (~₹1,764–1,794).
If price falls below S2/S3, risk of a deeper correction rises — possibly pulling back toward lower support zones or consolidating.
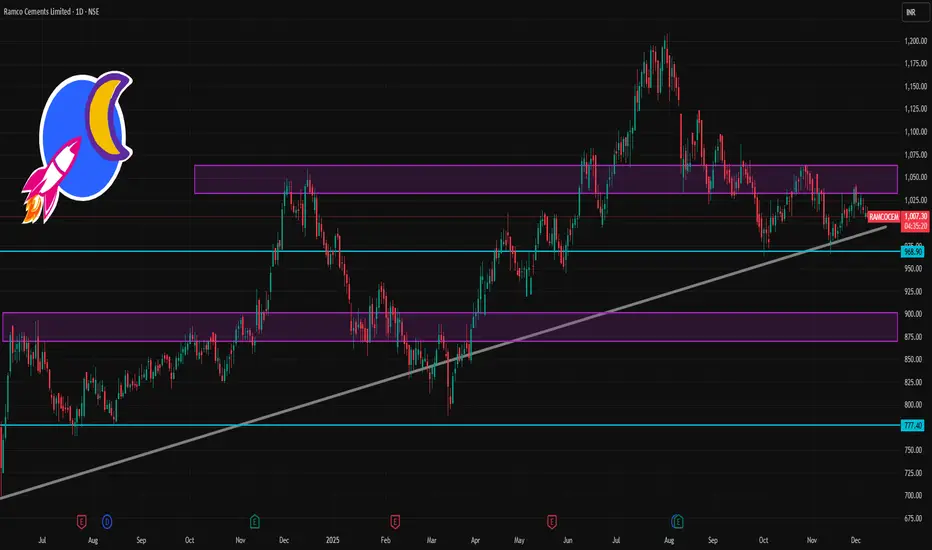
RAMCOCEM 1 Day Time Frame 📌 Current Price (Approx)
₹1007–₹1011 range on NSE during today’s session. Live market shows price around this zone (previous close ~₹1,011).
📊 Daily Pivot & Support/Resistance Levels (Updated)
(from reliable intraday pivot data)
Daily Pivot Zone
Central Pivot Point (CPR): ~₹1,011.4–₹1,011.8 (key equilibrium level)
Resistance Levels
R1: ~ ₹1,019
R2: ~ ₹1,027
R3: ~ ₹1,034–₹1,035
(above these levels can imply stronger upside if sustained)
Support Levels
S1: ~ ₹1,011–₹1,003
S2: ~ ₹996–₹992
S3: ~ ₹988–₹980
(broken support zones may accelerate downside)
✅ Key ODI pivots (Standard daily):
S1 ~ ₹1003.7
Pivot ~ ₹1019.1
R1 ~ ₹1027.3 (minor breakout level)
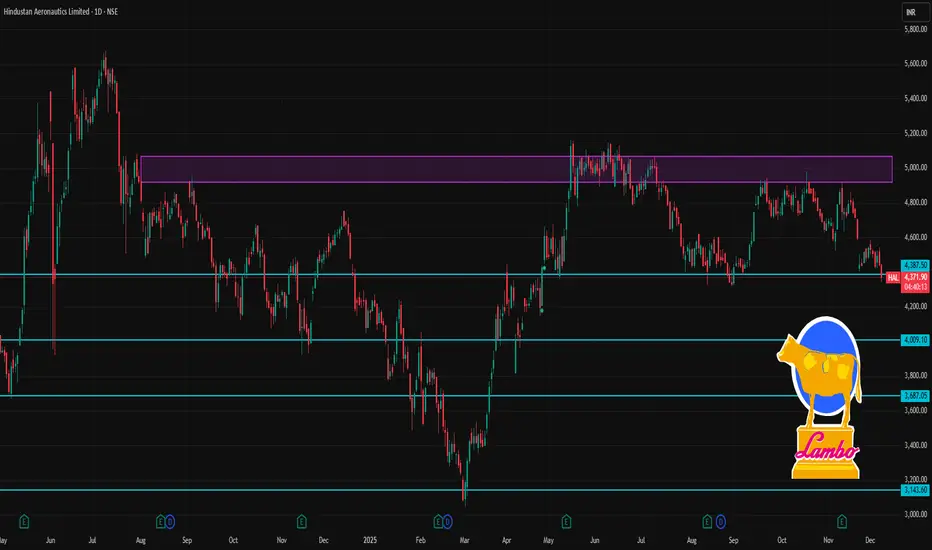
HAL 1 Day Time Frame 📈 Current Live Price (Approx)
HAL stock trading around ~₹4,360-₹4,440 on NSE today (08-Dec-2025) depending on real-time movement during session.
📊 Daily Pivot & Intraday Levels (Key Support / Resistance)
(Derived from live pivot screener showing today’s pivot scenario)
Daily Pivot Pivot Levels
Level Price (Approx)
R3 ₹4,583
R2 ₹4,558
R1 ₹4,533
Pivot Point ₹4,508
S1 ₹4,483
S2 ₹4,458
S3 ₹4,433
✅ Today’s view: Current price is trading near or slightly below the pivot zone (~₹4,507) — indicating neutral/slightly bearish bias if below pivot. Break above R1/R2 (~₹4,533-₹4,557) strengthens bullish intraday bias; breakdown below S2/S3 (~₹4,458-₹4,433) increases downside risk intraday.
🧠 How to Interpret These Intraday Levels
📌 Bullish (Buy) Scenario
Above Pivot (~₹4,508) → intraday bias turns bullish.
Break above ₹4,533-₹4,558 zones → could lead to further upside towards R3 ~₹4,583+.
📉 Bearish (Sell) Scenario
Below S1 (~₹4,483) → short-term weakness.
If price slips below ₹4,458-₹4,433 (S2/S3) → stronger bearish momentum intraday.
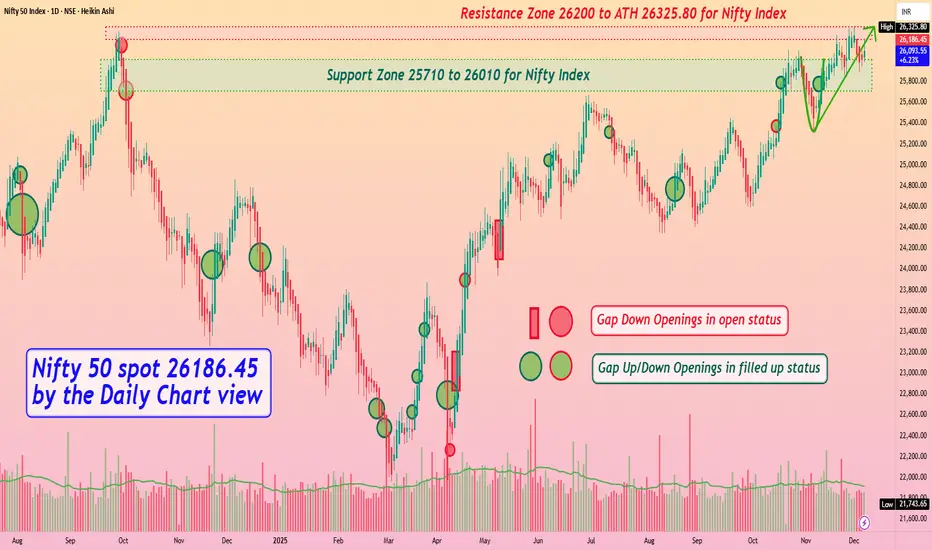
Nifty 50 spot 26186.45 by Daily Chart view - Weekly updateNifty 50 spot 26186.45 by Daily Chart view - Weekly update
- Support Zone 25710 to 26010 for Nifty Index
- Resistance Zone 26235 to ATH 26310.45 for Nifty Index
- Anticipate the subdued Bullish momentum to continue for Nifty 50
- Moreso Geo-Political tariff tricklers with certain Domestic factors creating weakness
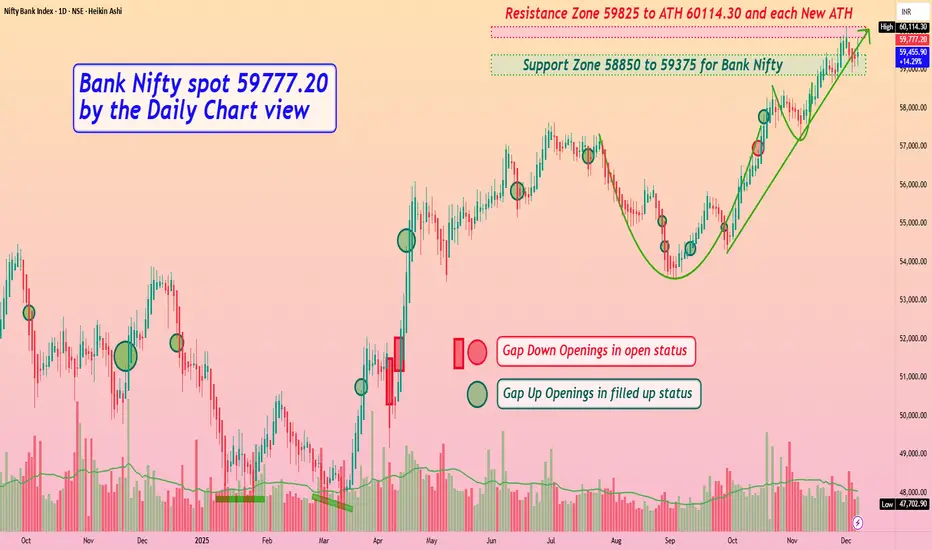
Bank Nifty spot 59777.20 by the Daily Chart view - Weekly updateBank Nifty spot 59777.20 by the Daily Chart view - Weekly update
- Support Zone 58850 to 59375 for Bank Nifty
- Resistance Zone 59780 to ATH 59897.50 and each New ATH
- Bullish momentum seems intact but Rising Support Trendline is Broken down
- Moreso Geo-Political tariff tricklers with certain Domestic factors creating weakness
Zuari Agro Chemicals cmp 294.80 by Monthly Chart viewZuari Agro Chemicals cmp 294.80 by Monthly Chart view
- Support Zone 239 to 274 Price Band
- Resistance Zone 325 to 362 Price Band
- Rounding Bottom by Resistance Zone neckline
- Breakout well sustained above dotted Falling Resistance Trendlines
- 3rd Falling Resistance Trendline from ATH level Breakout maybe made
- Rising Support Trendlines are well respected by upside price momentum
- Volumes with heavy spikes in between by close sync with avg traded quantity

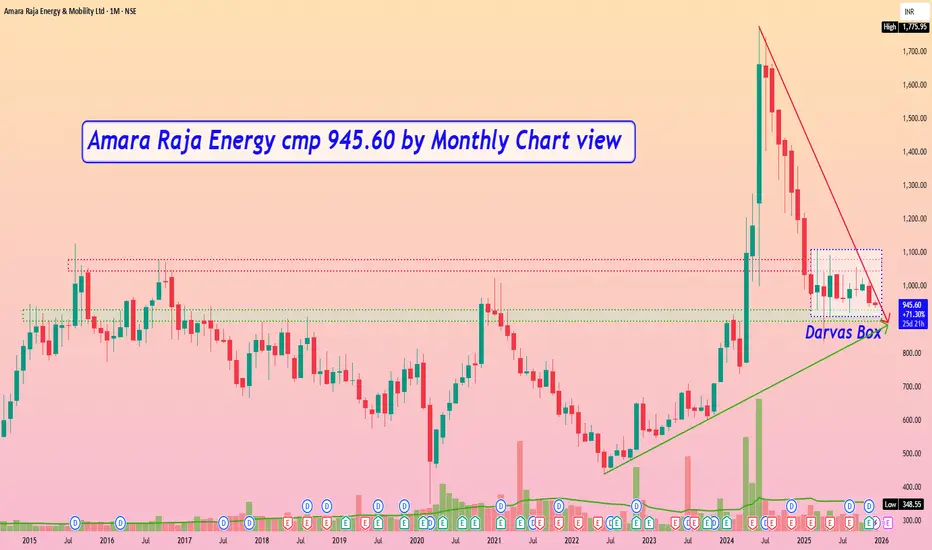
Amara Raja Energy cmp 945.60 by Monthly Chart viewAmara Raja Energy cmp 945.60 by Monthly Chart view
- Support Zone 895 to 930 Price Band
- Resistance Zone 1045 to 1080 >> 1110 Price Band
- Volumes seen closely flat to falling since hitting ATH in June 2024
- Volumes indicate consolidation and accumulation since February 2025
- Darvas Box : Price trending within 910 to 1110 range since February 2025
- Support Zone well respected over past few months but Price retracing at the Resistance Zone
TATASTEEL 1 Day Time Frame 📌 Current status
Price is hovering around ₹166–167.
52‑week range: low ≈ ₹122.6, high ≈ ₹186.9.
✅ What This Means for Near‑Term Trading / Observation
As of now, the stock is in a neutral / consolidation phase — price sitting between support (~ ₹165) and resistance (~ ₹170–172).
A break below ~ ₹165 might open path toward ~₹163–164, or lower, depending on volume and market sentiment.
A break above ~ ₹170–172 — especially on good volume — could trigger upward movement toward ~₹180+ zones (with key watch on 52‑wk highs around ₹185–187).
Because we are closer to middle of the 52‑wk range rather than extremes, price volatility remains possible — so risk management (stop‑loss, position sizing) matters.

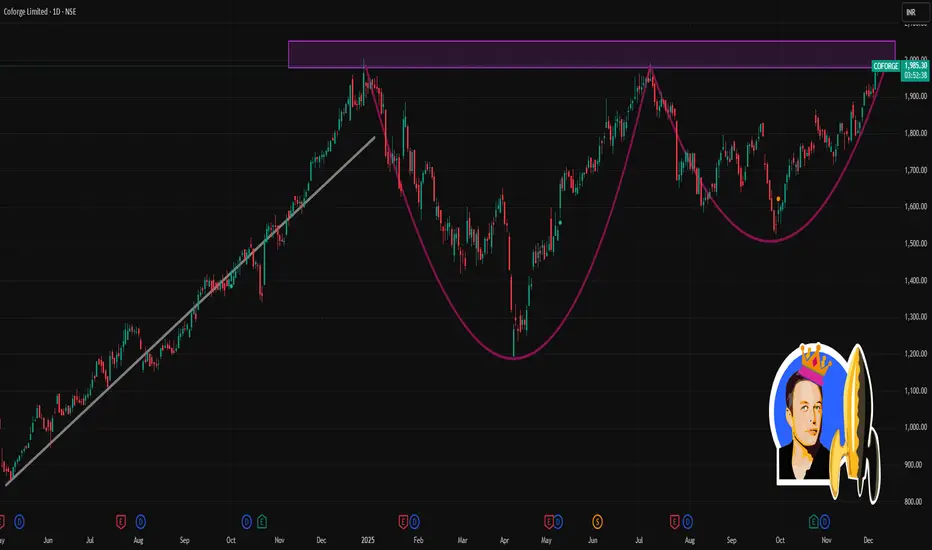
COFORGE 1 Day Time Frame 📈 Current Price & Range (as on recent close)
Last traded price: ~ ₹1,966.20
Day’s low–high: ~ ₹1,917.80 – ₹1,986.00
🧭 Key Moving‑Average & Technical Context
On daily chart, short‑ and medium‑term SMAs/EMAs (5‑, 10‑, 20‑, 50‑, 100‑, 200‑day) are all in “outperform” configuration — indicating bullish bias.
Other indicators on daily chart — RSI, MACD, Stochastic, ROC, CCI etc — are also showing strength (many in “outperform” zone).
⚠️ What to Monitor / What Can Happen
If Coforge breaks above ~₹1,986 with good volume — could extend higher, possibly retesting upper ranges near ₹2,000 (52‑week highs ~₹2,005).
If price falls below ~₹1,915 and fails to hold, next support zones around ~₹1,900 — and if that breaks, ~₹1,840‑₹1,850 becomes the important cushion.
Given strong moving‑average alignment plus bullish oscillator values, trend bias remains upward — but day‑to‑day volatility can still cause swings, so intraday trades should use tight stop‑loss.
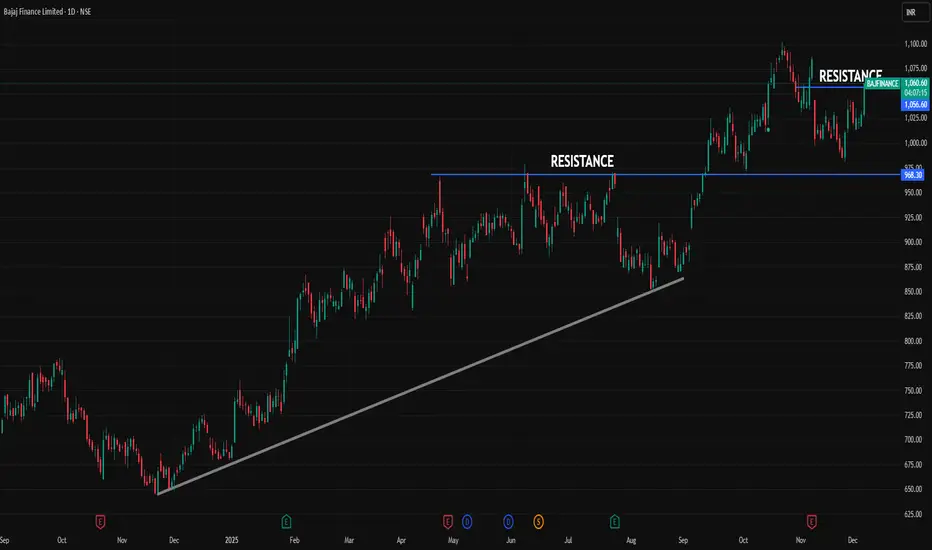
BAJFINANCE 1 Day Time Frame 📌 Latest Price Snapshot
Last quoted price: ~ ₹ 1,029.05
Today’s trading range: ~ ₹ 1,016.00 (low) to ₹ 1,032.30 (high)
52‑week high / low: ~ ₹ 1,102.50 / ₹ 668.55
⚠️ What to Watch / Trade‑Caveats (Intraday)
Pivot and support/resistance levels are dynamic — price could react differently depending on volume, broader market sentiment, and macro factors.
Since current price is already near resistance zone (~₹ 1,044 – 1,056), upside room may be limited — breakouts should be watched carefully, and risk of pullback exists.
On the downside, if price dips below ~₹ 1,019‑1,025, then the next support zone (~₹ 997‑₹ 978) becomes relevant.
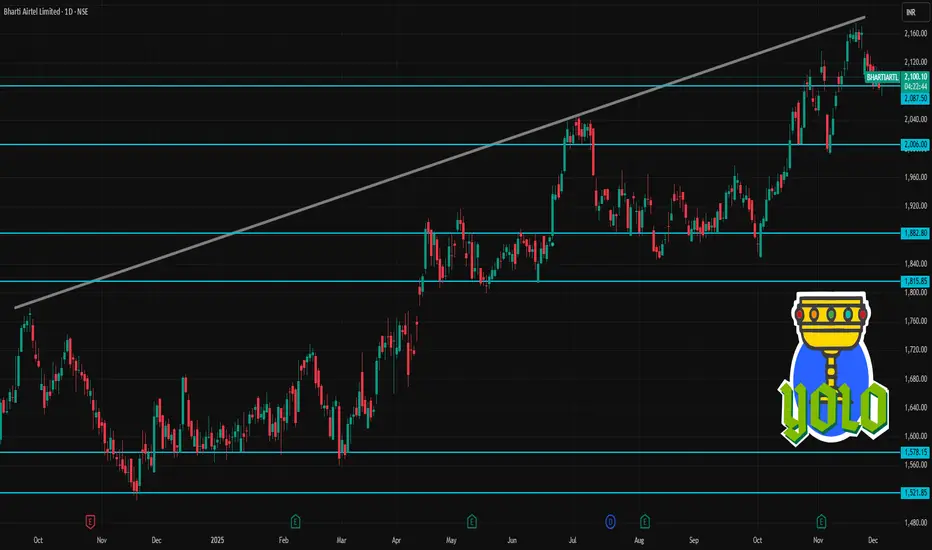
BHARTIARTL 1 Day Time Frame 📊 Current status
The latest price is about ₹ 2,103.8 (NSE/BSE) for Bharti Airtel.
Day’s trading range so far: roughly ₹ 2,090.00 – ₹ 2,106.10.
52‑week range: Low ≈ ₹ 1,559.50, High ≈ ₹ 2,174.50.
⚠️ What to watch out for / risk factors (intraday/trade‑view)
The stock has recently rallied a lot (52‑wk high not far behind), so upside may be limited unless there’s strong buying — there might be profit‑booking or consolidation.
Short‑term volatility could be high; intraday ranges are fairly wide.
External factors — broader index movements (Nifty / Sensex), sector sentiment, broader telecom/market news — could sway direction more than technicals.
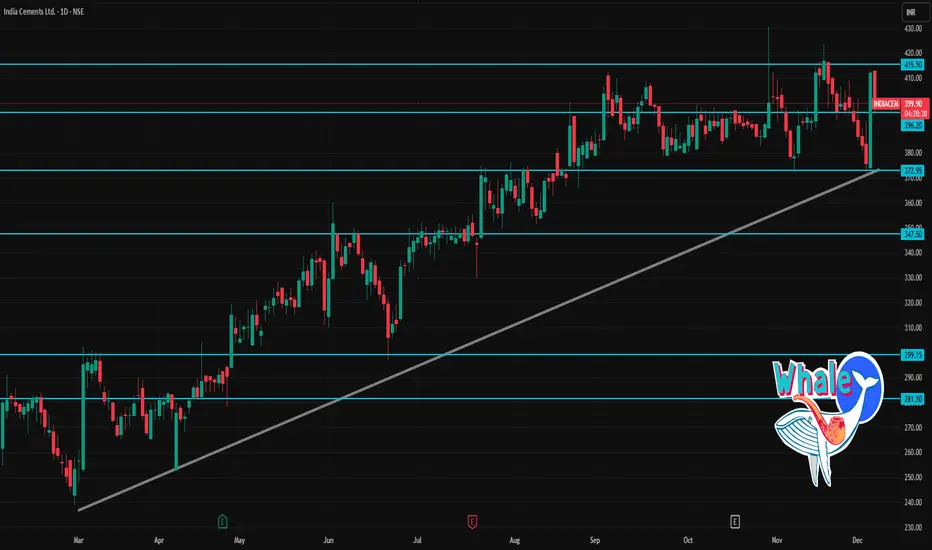
INDIACEM 1 Day Time Frame 📈 Key Recent Data & Context
Recent closing price was ~ ₹412.15, with VWAP ~ ₹402.10. That means price closed above VWAP — often seen as a short-term bullish signal.
The stock has experienced a significant volume spike recently (much higher than its 2-week average), which may suggest stronger conviction in current move.
According to one daily technical indicator set, the stock shows “neutral to slightly bullish” — RSI near mid-range, MACD modestly positive.
🔎 1-Day Pivot & Support / Resistance Levels
Using standard pivot-point calculations for INDIACEM:
Level Type Price (₹)
Daily Pivot 364.95
Support 1 (S1) 359.90
Support 2 (S2) 351.00
Support 3 (S3) 345.95
Resistance 1 (R1) 373.85
Resistance 2 (R2) 378.90
Resistance 3 (R3) 387.80
Interpretation:
If price retraces, the pivot ~ ₹365 may act as first “balancing” zone.
Key supports below are between ₹346–351 — failure below could weaken short-term bullishness.
Upside resistances from today’s pivot are ₹374 → ₹379 → ₹388 — crossing these may signal stronger bullish momentum for the day.
✅ My Trading-day “Game Plan” (Hypothetical)
If I were trading INDIACEM today (intraday or short-term):
Could consider a long entry if the stock sustains above ₹402–405, with stop-loss near ₹377–380 (just below R2/R3).
If price slips back and tests pivot ~ ₹365 or support ~ ₹350–355, that could be a buy-on-dip zone.
On the upside, a move beyond ₹388 could open up short-term upside toward ₹395–405 (given stock’s recent volatility).
MAS Financial cmp 313 by Daily Chart viewMAS Financial cmp 313 by Daily Chart view
- Support Zone 275 - 295 Price Band
- Resistance Zone 325 to 345 Price Band
- Falling Resistance Trendline Breakout seems been sustained
- Repeat Bullish Rounding Bottoms done with last in making process
- Volumes are seen to be in decent sync with the average traded quantity
- Good accumulation since August 2025 within Support and Resistance Zone

ZYDUSWELL 1 Day Time Frame 🔎 Current snapshot
Recent quoted share‑price: ~ ₹419.7 as on close of market.
52‑week high / low ~ ₹530.9 / ₹298.6.
✅ What this implies (for today / next trading session)
If price moves upward and clears ₹456–₹463, next target zone could be ₹470–₹475 — and if momentum persists, maybe up to ₹485–₹487.
If price falls, keep an eye on ₹441–₹453 as first support; a break below ₹420–₹422 could open risk of deeper slide.
Given current price (~₹420), the stock is nearer to support side — so a modest bounce is possible if broader market or sector sentiment improves.
⚠️ What to watch out for
Daily technicals work best with volume confirmation — weak volume may render levels less reliable.
Mid‑term factors (earnings, fundamentals, market news) can overrule technical‑only moves.
Given the stock’s 52‑week high/low spread, volatility remains significant — so manage risk (stop‑loss, position sizing) carefully.
