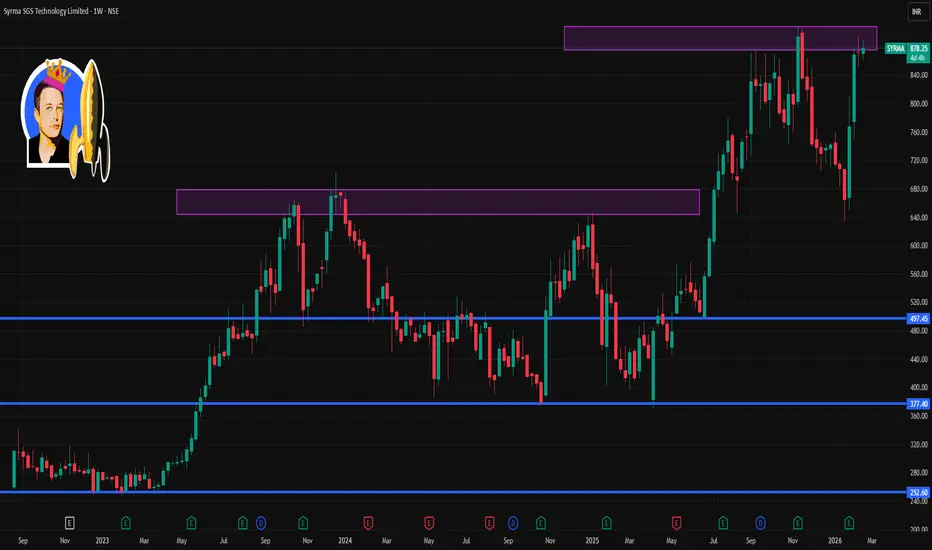
SYRMA 1 Week Time Frame 📌 Current Price: ~₹872–₹878 on NSE (recent trading range).
📈 Weekly Technical Levels (Support & Resistance)
🔹 Resistance Levels
R1: ~₹876 – immediate short-term upside hurdle (near recent high).
R2: ~₹892 – next resistance zone where selling pressure can appear.
R3: ~₹916 – bullish breakout target if price sustains above R2.
🔸 Pivot / Neutral Zone
Weekly Pivot ~₹849–₹873 area – this zone acts as reference for bullish vs bearish bias:
– Above pivot → bias turns mildly bullish
– Below pivot → bias is neutral/weak
🔻 Support Levels
S1: ~₹834 – first key support on weekly frame.
S2: ~₹806 – stronger downside support zone if S1 breaks.
S3: ~₹791 – deeper support level (next major cushion).
📊 These are the key weekly price barriers based on recent pivot and volume nodes — they help you gauge where buyers/sellers might step in over the next 5–7 days.
🧠 Short-Term Technical Context
Trend: Around range-bound to slightly bullish in the very short term — recent price is near weekly pivot/resistance area.
👉 Sustained break above ~₹892 would suggest momentum toward higher weekly levels (₹900+)
👉 Breakdown below ~₹806 could tilt short-term bias bearish.
Note: True weekly pivots adjust each trading week; the above is latest near-term reference based on technical sources.
Chartpatternsanalysis
ENGINERSIN 1 Month Time Frame 🟡 Current Price Context (as of mid-Feb 2026)
The stock has recently traded around ₹200–₹215 on NSE — a volatile move higher in the past few sessions.
📊 1-Month Support & Resistance Levels
(These are weekly-to-monthly pivot & technical levels to watch if you’re looking at a 1-month timeframe.)
🔼 Resistance Zones
~₹208 – ₹214: Near current short-term highs / recent pivot ~R1 zone.
₹215 – ₹221: Upper resistance cluster where price may see supply / reversal pressure.
~₹225 – ₹230+: Secondary resistance if trend accelerates.
🔽 Support Zones
~₹195 – ₹200: Immediate support / prior pivot area.
₹187 – ₹190: Mid-range support from recent moving averages & pivot structures.
₹180 – ₹185: Lower support zone, often seen as demand area in a pullback.
📉 Technical Indicators (Short-Term Bias)
Moving averages (like 20/50/100 DMA) often act as dynamic support/resistance — current data suggests 50-day/200-day near ₹180-₹190 (neutral to positive).
Momentum indicators like RSI can help confirm strength — if above 60 + rising, short-term bullish; if falling below ~50, risk of deeper pullback.
📌 Quick Summary (1-Month Frame)
Bullish breakout if price sustains above ~₹215-₹221 — could target higher resistance ~₹225-₹230.
Neutral / sideways near current levels (~₹200-₹208) — price may trade in that band.
Strong support ~₹180-₹195 — breakdown below this can signal deeper correction.

BSE 1 Day Time Frame 📈 Current Price & Daily Price Range (Latest)
Current / Last traded price: ~₹3,025.30 INR
Day’s trading range: ₹3,017.90 – ₹3,127.00
📌 How to Interpret Today’s 1-Day Levels
📍 Bullish levels (upside pressure):
✔ Above Pivot 3,056–3,095 suggests intraday buyer strength
✔ Break & hold above 3,165–3,204 may open upside momentum continuation
📍 Bearish levels (downside risk):
✔ Loss of S1 ~2,986 could drag price to S2 ~2,947
✔ Below S2 ~2,947 increases odds of deeper pullback toward S3 ~2,877
📍 Summary for Today’s 1-Day View
Neutral–Bearish bias near current price as BSE trades below recent high and pivot
Key intraday bias pivot: ~₹3,056
Above pivot: bullish bias
Below pivot: bearish/neutral consolidation
Immediate resistance: ~3,095–3,165
Immediate support: ~2,986–2,947
Deeper support: ~2,877

GODREJPROP 1 Moth Time Frame 📌 Current approximate price context (as of mid-Feb 2026): around ₹1,800–1,820 on NSE/BSE.
📊 Short-Term (1-Month) Key Levels
🔹 Support Zones
These are levels where price may find buying interest on dips:
1. ~₹1,800–1,780 — short-term near support (pivot / S1 area).
2. ~₹1,750–1,720 — lower support if weakness continues.
3. ~₹1,670 (and below) — deeper support seen on other screens.
These are approximate and dynamic — minute-to-minute charts can vary. But near ₹1,750–1,800 is often watched as the immediate defense for bulls.
🔺 Resistance Zones
Levels where selling pressure may emerge:
1. ~₹1,830–1,850 — near short-term pivot/resistance.
2. ~₹1,870–1,900 — next area of supply above that.
3. ~₹1,950–2,000 — a round psychological/resistance region if strength returns. (Derived from broader structure and pivot studies)
🟡 Technical Bias (1-Month)
Some scanners show a neutral-sell bias on the 1-month view, with recent price underperformance relative to broad indices.
Moving averages (like 50/100 DMA) are around ₹1,850–2,000 which can act as dynamic resistance.
Summary (1-Month Levels):
Immediate Support: ~₹1,800 → ~₹1,750
Key Support Below: ~₹1,670
Immediate Resistance: ~₹1,830–1,850
Higher Resistance: ~₹1,870–1,900 → ~₹2,000+

BHARATFORG 1 Week time Frame 📈 Current Price (Market Close)
• ~₹1,739–₹1,743 on NSE/BSE.
🧠 1-Week Technical Levels (Short-Term)
These derive from recent pivot/S/R studies and typical chart behavior:
🔹 Immediate Support
1. ₹1,715–₹1,720 zone — first defensive floor on recent pivot levels.
2. ₹1,690–₹1,700 — a stronger intermediate support if broader weakness appears.
3. ₹1,645–₹1,655 — deeper support band where buyers historically step in.
👉 Bearish break below ~₹1,690 could lead to more downside pressure in the coming week.
🔸 Immediate Resistance
1. ₹1,770–₹1,780 — first upside barrier (near recent pivot resistance).
2. ₹1,805–₹1,810 — next resistance cluster above current price.
3. ₹1,830+ — if bulls get strong follow-through, this is the next supply area.
👉 Bullish breakout above ~₹1,780–₹1,800 could extend upside over the next few sessions.
📌 1-Week Trading Range Expectation (based on levels)
Likely band this week:
➡️ Downside range: ~₹1,690–₹1,700
➡️ Upside range: ~₹1,780–₹1,810
If price stays within these levels, expect range-bound trading. A decisive move beyond either zone could dictate the next short-term trend direction.

CUMMINSIND 1 Day Time Frame 📌 Latest Price (approx): ~₹4,429–₹4,453 range (Feb 13, 2026)
🔹 Intraday Support & Resistance Levels (1-Day Time Frame)
Classic (Pivot) Levels — Today
Support 3 (S3): ~₹4,198
Support 2 (S2): ~₹4,273
Support 1 (S1): ~₹4,318
Pivot: ~₹4,394
Resistance 1 (R1): ~₹4,439
Resistance 2 (R2): ~₹4,515
Resistance 3 (R3): ~₹4,559
Short-Term Day Levels from Volume Profile
Near-term Support: ~₹4,391–₹4,392 (major short-term support)
Minor Support: ~₹4,343–₹4,305
Near-term Resistance: ~₹4,449–₹4,468
Upper Range Resistance: ~₹4,479
Intraday Low/High Range Observed Today
Day’s Low: ~₹4,413.6
Day’s High: ~₹4,491.9
📊 Trend Indicators (Daily View)
Price is above 50-day and 200-day averages — generally positive longer bias.
RSI on daily chart around mid-range (close to 60), indicating some bullish bias but not overbought yet.
How to use these levels (1-day):
Buy near support zones (~₹4,391 / ₹4,343) with tight targets if momentum turns up.
Watch pivot (~₹4,394) — breakout above pivot toward R1/R2 suggests intraday bull momentum.
Resistance zone (~₹4,439–₹4,479) could cap upside — a clear move above offers further short-term gains.
Stop-loss / breakdown below strong support (~₹4,305) can signal bearish intraday pressure.

BAJFINANCE 1 Week Time Frame 📌 Latest Price (as of 13 Feb 2026)
Current trading level: ~₹999 – ₹1,012 range (varies intraday) based on NSE/BSE data.
📊 Weekly Key Levels (Approximate)
These support/resistance zones are relevant for the 1-week chart perspective:
🔹 Resistance (Bullish zones)
₹1,012 – ₹1,020 – Current short-term resistance cluster (near recent highs)
₹1,035 – ₹1,048 – Next extension target area if breakout occurs (based on past Fibonacci/price projection levels)
₹1,050 – ₹1,060 – Longer range weekly resistance (psychological round number & historical higher pivot)
🔻 Support (Bearish / downside cushions)
₹975 – ₹980 – Major weekly support zone — bulls must defend this for uptrend to hold
₹950 – ₹960 – Secondary support cluster and weekly pivot area
₹900 – ₹915 – Deeper support range if broader correction accelerates
📈 Current Price Context
Recent price is near ₹990 - ₹1,000 levels, with stocks bouncing from weekly support and showing mixed momentum. Latest close was around ₹999.80 on 12 Feb 2026.
Volatility around ₹970–980 is significant; this zone is considered a line in the sand from a weekly structure POV.
🔔 Weekly Trend Notes
Bullish bias if price holds above ~₹980 and breaks above ₹1,020 with good volume — opens path toward ~₹1,030–₹1,050+.
Bearish risk if price decisively breaks below ~₹975 on weekly close — could pull price toward ~₹950 then ₹900.
Moving averages (e.g., 50-week/100-week) are long-term supports — generally near ~₹900–₹950 levels on weekly charts.

ABDL 1 Day Time Frame 📌 Current Price (approx): ~₹528 – ₹513 (varies with session)
📉 Intraday / 1-Day Technical Pivot Levels
(from yesterday’s high/low range — useful for today’s trading view)
📌 Pivot Calculation (Classic):
🔁 S3: ₹497.98
🔁 S2: ₹501.77
🔁 S1: ₹507.43
⚪ Pivot: ₹511.22
🟢 R1: ₹516.88
🟢 R2: ₹520.67
🟢 R3: ₹526.33
👉 Current price near these levels will determine short-term direction.
📌 How to Use These Levels Today
Bullish bias (upside moves):
• A break and sustain above Pivot ~₹511–512 suggests strength going into R1 ~₹516–₹520.
• If price gets above R2 (~₹520.7), possible move toward R3 (~₹526-₹528).
• Watching R3 (~₹526-₹528) — if broken with volume, it can turn into support.
Bearish bias (downside moves):
• Loss of Pivot (~₹511) may push price back to S1 ~₹507 and S2 ~₹502.
• A break below S2 (~₹501) can open deeper pullbacks toward S3 (~₹497-₹495).
⚙️ Contextual Indicators (Neutral/Mixed)
📊 RSI near neutral (~50) — not strongly overbought/oversold.
📊 Moving averages show short-term caution vs longer-term levels.

STARHEALTH 1 Week Time Frame 📊 Current Price Context
Latest share price is around ₹460–₹470+ in early Feb 2026 trading sessions.
📈 Key Short-Term Levels (1-Week Timeframe)
🔹 Pivot / Central Reference
Pivot Point: ~ ₹459 – this is the mid reference for the week.
📌 Resistance Levels (Upside)
R1: ~ ₹464
R2: ~ ₹470–₹472
R3: ~ ₹476
These act as potential upside barriers where prices could stall. Higher resistance levels mean stronger short-term selling pressure usually appears there.
📉 Support Levels (Downside)
S1: ~ ₹453
S2: ~ ₹447
S3: ~ ₹442
Support zones where buying interest could re-emerge on weakness.
📌 Short-Term Momentum & Indicators
1-week performance: Slightly negative/slightly lower → indicates mild short-term weakness.
Oscillator and moving average summary on TradingView shows more of a neutral to mixed bias without a decisive short-term signal.
📊 52-Week Range (for reference)
52-week high: ~ ₹533–534
52-week low: ~ ₹327–330
This gives context for broader strength/weakness beyond the 1-week frame.
📌 How to Use These Levels
Bullish scenario: Break above ₹470–₹472 with volume suggests shift toward stronger short-term strength.
Bearish scenario: Failure below ₹453 could lead to test of lower supports like ₹447–₹442.
Range: Between ₹453–₹472 often acts as the 1-week trading zone unless strong catalysts emerge.

STANLEY 1 Week Time Frame 📊 Current price context
• Share price is trading around ~₹180-₹210 range recently (~close to the 52-wk low) with volatility.
📌 Weekly Support Levels
These are zones where the price may find buying interest on dips:
✔ Support 1: ~₹172–₹177 — near recent swing lows
✔ Support 2: ~₹165
✔ Support 3: ~₹157
These come from broader technical pivot and historical price zones that show areas of previous trading interest.
📌 Weekly Resistance Levels
These are zones where the price might stall / face selling pressure:
📍 R1: ~₹186–₹190
📍 R2: ~₹194
📍 R3: ~₹200+
These are typical pivot resistance zones / recent upside areas of interest on short-term charts.
🔎 What This Means (in simple terms)
If price holds above ₹172-₹177, that’s a bullish defence zone for a bounce short-term.
A clear break above ₹186-₹190 with volume could open swings toward the ₹194-₹200 region.
A break below ~₹165 could set the stage for deeper pullbacks toward ~₹157.

REFEX 1 Week Time Frame 📌 Current Key Price (Approx)
Live share price around ₹239 – ₹250 on NSE/BSE.
📊 Weekly Technical Levels (Support / Resistance)
🔹 Weekly Support
S3: ~₹205 – ₹217 zone (lower weekly structural support)
S2: ~₹221 – ₹229 range (important near-term weekly support)
S1: ~₹224 – ₹230 (immediate weekly support)
🔸 Weekly Pivot
Pivot Zone: ~₹228 – ₹239 mid-range level — acts as a decision point between bullish and bearish bias in the weekly timeframe.
🔸 Weekly Resistance
R1: ~₹232 – ₹239 (first weekly resistance)
R2: ~₹241 – ₹246 (next hurdle)
R3: ~₹245 – ₹250+ (stronger weekly barrier)
📈 Weekly Chart Bias Interpretation
✔️ Above pivot (~₹228–₹239)
→ Slightly bullish to neutral weekly structure with room to test R2/R3.
❌ Below pivot / failing R1 (~₹232)
→ Bearish pressure could push toward S1/S2 levels.
📌 Weekly indicators (from broader technical sites) suggest current bias is neutral to bearish on weekly timeframe rather than strongly bullish.
🧠 Quick Weekly Snapshot
Support cluster: ~₹217 – ₹229
Key pivot area: ~₹228 – ₹239
Resistance cluster: ~₹241 – ₹250+
Trades tend to respect weekly pivots and S/R levels for reversal or breakout cues. Monitor weekly close above/below pivot zones for the next directional bias. Always combine with volume and momentum indicators for confirmation.

SBICARD 1 Month Time Frame 📌 Latest Price Context:
• Stock is trading around the mid ₹750-₹760 zone.
• It has recently tested 52-week lows near ₹725 and remains below key moving averages — a bearish technical structure in the very short term.
📊 1-Month Timeframe Key Levels (Support & Resistance)
🔻 Support Levels (Buy Zones)
S1: ~₹745–₹747 — immediate support zone for dips.
S2: ~₹735–₹738 — stronger support beneath the first fold.
S3: ~₹725–₹729 — major support near 52-week low; breaking below risks extra downside.
➡ A breakdown below ₹725 on monthly closes would be bearish.
📈 Resistance Levels (Targets / Sell Zones)
R1: ~₹762–₹763 — near the pivot/resistance in current 1-month profile.
R2: ~₹769–₹770 — resistance zone at recent short term swing highs.
R3: ~₹778–₹780+ — higher resistance – breakout above helps bullish recovery.
➡ Sustained closes above ~₹770–₹780 can shift short-term bias to neutral/bullish.
🔍 Trading Bias Guidance
📉 Bearish to Neutral if price stays below ₹762–₹770
📈 Bullish structure if breaks and holds above ₹770–₹780

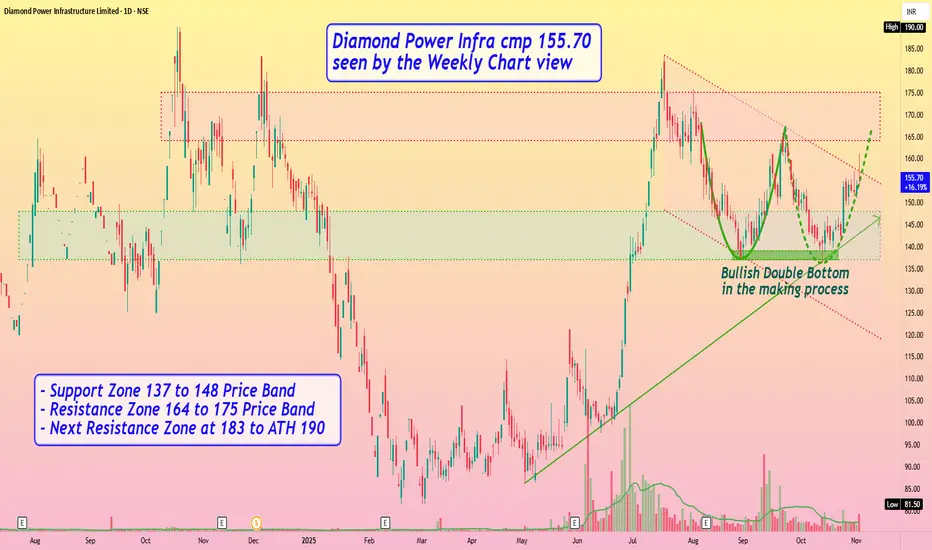
Diamond Power Infra cmp 155.70 seen by the Weekly Chart viewDiamond Power Infra cmp 155.70 seen by the Weekly Chart view
- Support Zone 137 to 148 Price Band
- Resistance Zone 164 to 175 Price Band
- Next Resistance Zone at 183 to ATH 190
- Bullish Double Bottom in the making process
- Rising Support Trendline seems well respected
- Volumes spiking regularly by close sync with avg traded qty
- Falling Price Channel Breakout seems to be in the making process
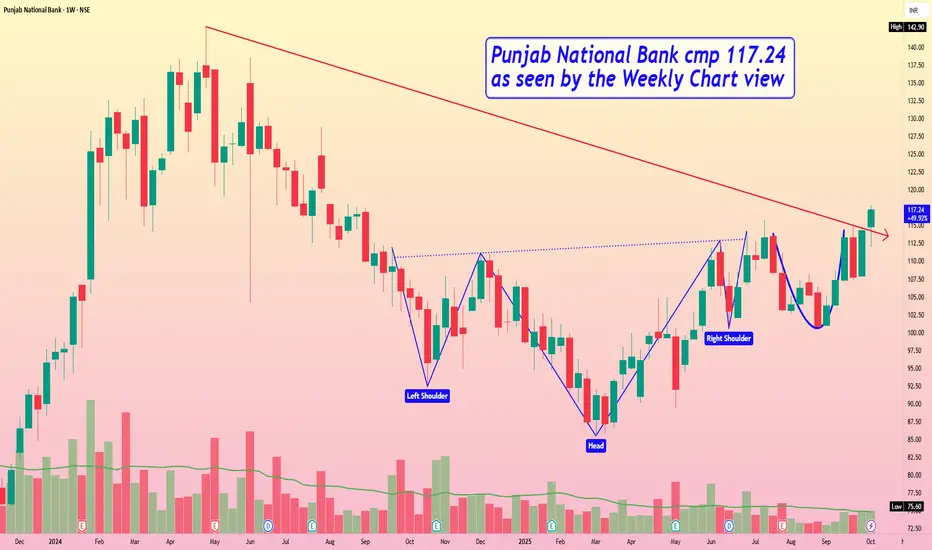
Punjab National Bank cmp 117.24 by Weekly Chart viewPunjab National Bank cmp 117.24 by Weekly Chart view
- Weekly basis Support levels seen at 107 > 98 > 87
- Weekly basis Resistance levels at 124 > 133 > ATH 142.90
- Bullish Head & Shoulders followed by Rounding Bottoms formed
- Volumes seen getting in close sync with the average traded quantity
MOBIKWIK : Breakout Candidate#MOBIKWIK #chartpattern #flagandpolepattern #chartpatternbreakout #swingtrade
MOBIKWIK : Swing Trade
>> Breakout Candidate
>> Chart pattern Visible
>> Flag & Pole Pattern
>> Volume Contraction
>> Good Strength in Stock
Swing Traders can lock profit at 10% and keep Trailing
Please Boost, comment and follow us for more Learnings.
Disc : Charts shared are for learning purpose only, not a Trade recommendation. Do your own research and consult your financial advisor before taking any position.

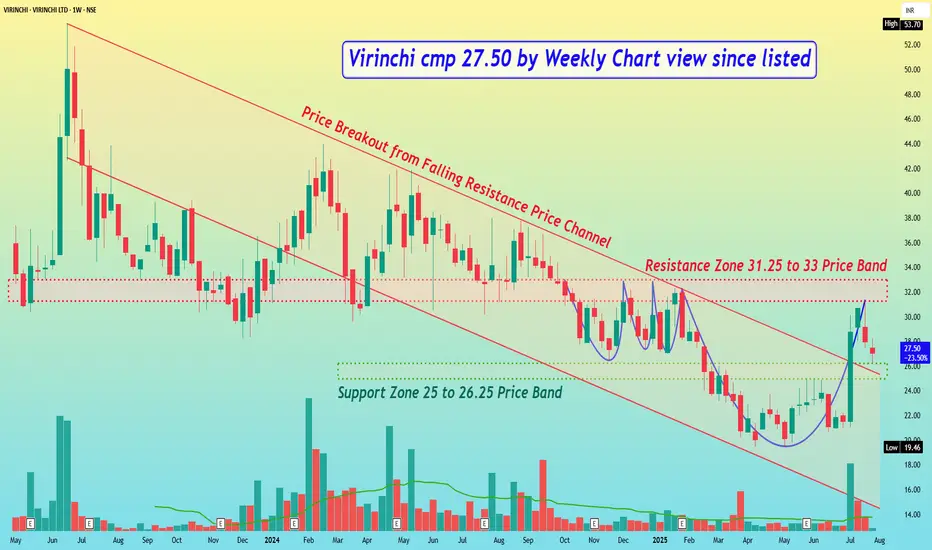
Virinchi cmp 27.50 by Weekly Chart view since listedVirinchi cmp 27.50 by Weekly Chart view since listed
- Support Zone 25 to 26.25 Price Band
- Resistance Zone 31.25 to 33 Price Band
- Price Breakout from Falling Resistance Price Channel
- Support Zone has been tested retested over the past week
- Resistance Zone acting strongly for repeated Price retracement
- Repeated Bullish Rounding Bottoms up move rejected from Resistance Zone
- Volumes are needed to crossover the Resistance Zone for fresh breakout attempts
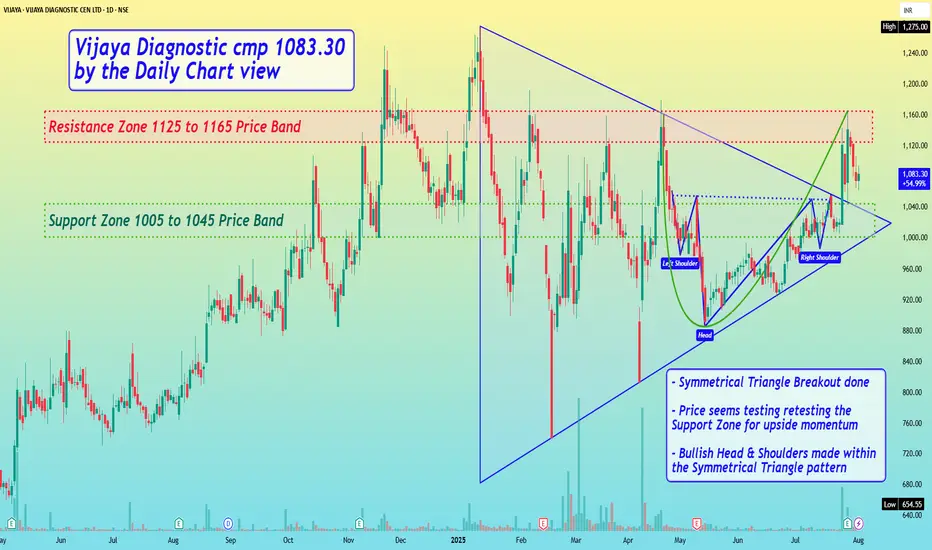
Vijaya Diagnostic cmp 1083.30 by the Daily Chart viewVijaya Diagnostic cmp 1083.30 by the Daily Chart view
- Support Zone 1005 to 1045 Price Band
- Resistance Zone 1125 to 1165 Price Band
- Symmetrical Triangle Breakout done
- Price seems testing retesting the Support Zone for upside momentum
- Bullish Head & Shoulders made within the Symmetrical Triangle pattern
- Bullish Rounding Bottom done over Head & Shoulders and again within Symmetrical Triangle pattern
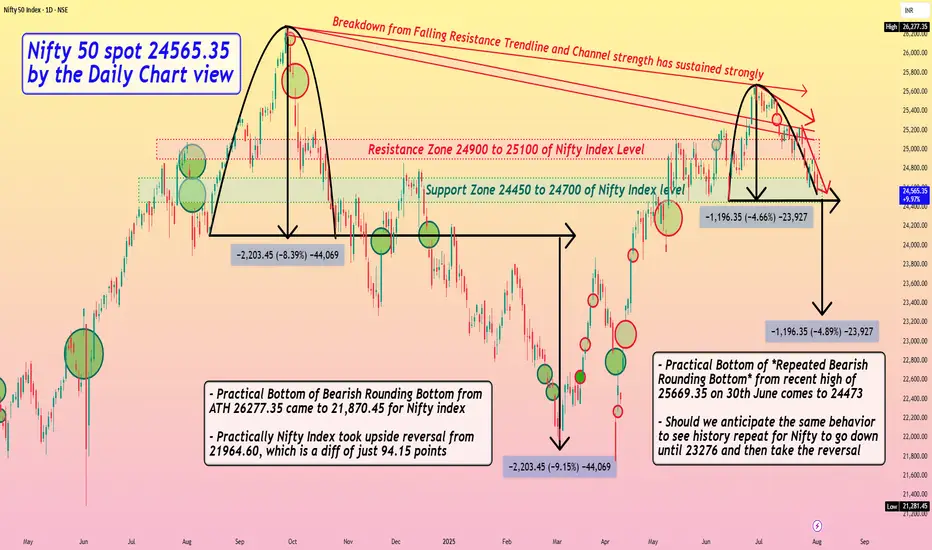
Nifty 50 spot 24565.35 by the Daily Chart view - Weekly update*Nifty 50 spot 24565.35 by the Daily Chart view - Weekly update*
- Resistance Zone 24900 to 25100 of Nifty Index Level
- Support Zone 24450 to 24700 of Nifty Index level still seen sustained
- Bearish Rounding Bottom after ATH level seen repeated at current week closure
- Practical Bottom of *Bearish Rounding Bottom* from ATH 26277.35 came to 21,870.45 for Nifty index
- Practically Nifty 50 Index later took an upside reversal from 21964.60, which is a diff of just 94.15 points
- Practical Bottom of *Repeated Bearish Rounding Bottom* from recent high of 25669.35 on 30th June comes to 24473
- Should we anticipate the same behavior to see history repeat for Nifty to go down until 23276 and then take the reversal
Rising Wedge Breakdown — 54,252 in Sight?#BankNifty View:
CMP: 56,528
BankNifty has broken down from a Rising Wedge pattern — a bearish signal. After a brief retest of the breakdown level, price has resumed its downward move. Daily close below 56,205 will gather fresh momentum.
🔑 A daily close below 56,205 could trigger fresh downside momentum.
🔻 Support Zones:
• 56,283 – 56,080
• 55,580 – 55,530
• 🔑 Key Supports: 54,470 – 54,375 & 53,600 – 53,580
🔺 Resistance Zone:
• 57,312 – 57,365
🎯 Pattern Target: 54,252
This aligns with the key support zone at 54,470 – 54,375 , strengthening its significance.
📌 Disclaimer: This analysis is shared for educational purposes only. It is not a buy/sell recommendation. Please do your own research before making any trading decisions.
#TechnicalAnalysis | #PriceAction | #RisingWedge | #ChartPatterns

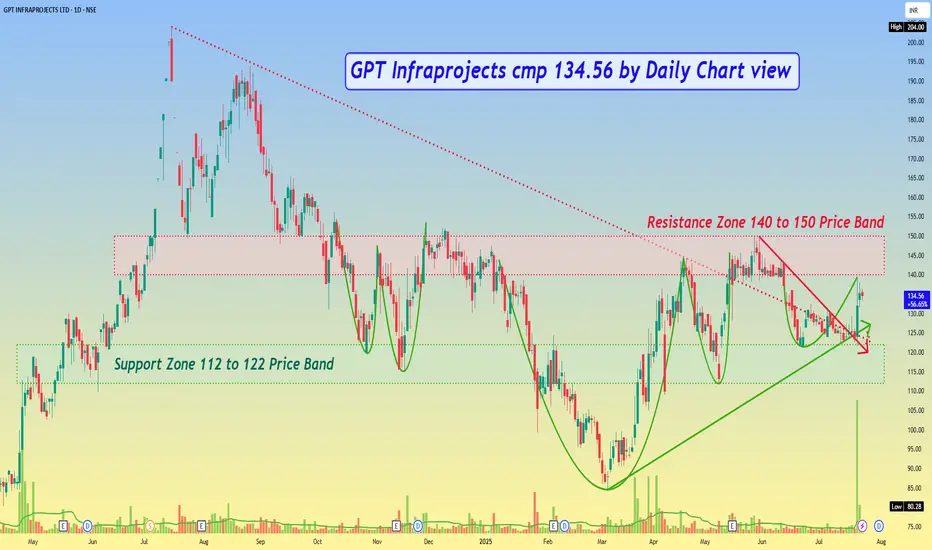
GPT Infraprojects cmp 134.56 by Daily Chart viewGPT Infraprojects cmp 134.56 by Daily Chart view
- Support Zone 112 to 122 Price Band
- Resistance Zone 140 to 150 Price Band
- Support Zone tested and retested well before breakout
- Falling Resistance Trendline from ATH broken and sustained
- 2nd recent Falling Resistance Trendline Breakout too seems sustained
- Heavy Volumes surged seen over past 2 days by demand based buying
- Bullish Rounding Bottoms by Resistance Zone neckline indicate upside momentum readiness
Sinclair Hotels cmp 106.73 by Daily Chart view since listedSinclair Hotels cmp 106.73 by Daily Chart view since listed
- Support Zone 94 to 99 Price Band
- Resistance Zone 113 to 118 Price Band
- Huge Volumes surged today by demand based buying
- Rising Support Trendline sustained by upside price momentum
- Breakout done and sustained from both the Falling Resistance Trendlines
- 7 odd months long Bullish Rounding Bottom done at Resistance Zone Neckline
- Bullish VCP Pattern is embedded inside the above Bullish Rounding Bottom pattern

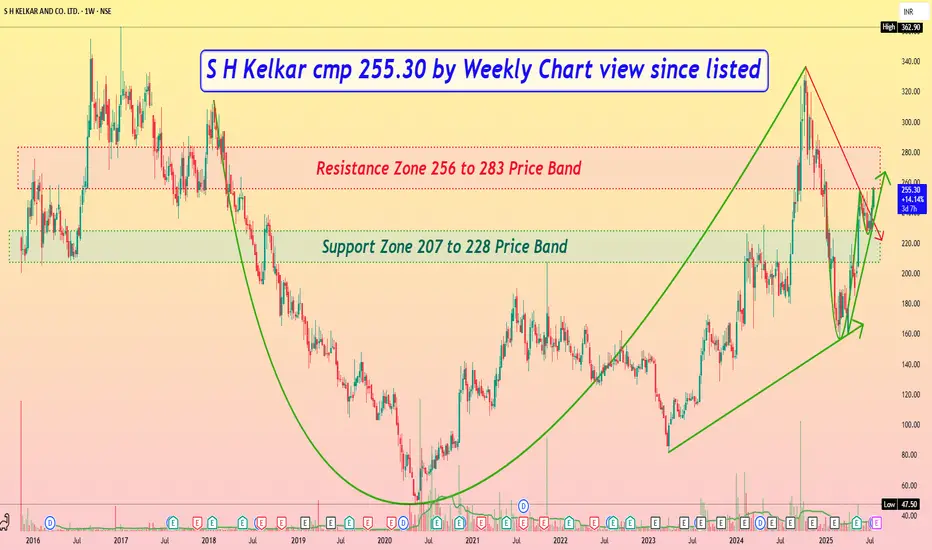
S H Kelkar cmp 255.30 by Weekly Chart view since listedS H Kelkar cmp 255.30 by Weekly Chart view since listed
- Support Zone 207 to 228 Price Band
- Resistance Zone 256 to 283 Price Band
- Volumes trying to sync with average traded quantity
- Support Zone tested retested by upside price momentum
- Bullish Cup & Handle seen completed formation with Resistance Zone neckline
- Fresh Breakout once Resistance Zone is crossed and price sustains closure above it for few days
Solana Long-Term Cup & Handle | +300% Potential🔍 #OnRadar | #Crypto
#SOLUSD (#Solana)
Solana Long-Term Cup & Handle | +300% Potential
CMP: $174
Support Zone: $123.00 – $100.00
Pattern Invalidation Level: $95 (MCB - Monthly Closing Basis)
📊 Technical Overview:
Solana (SOLUSD) is showing signs of a long-term Cup & Handle pattern forming on the higher timeframes.
☕️ Cup formation appears complete.
📐 Handle is likely developing within an Ascending Triangle .
🔄 Neckline Resistance: ~$305
🎯 Potential Target on Breakout: ~$560
🚀 Upside Potential: Approx. +300% from CMP
While it's early to confirm a breakout, this structure is worth keeping on the radar for long-term trend traders and pattern watchers.
⚠️ Disclaimer:
This is a technical analysis observation shared for educational purposes only.
Not a buy/sell recommendation.
Please do your own research ( #DYOR ) and consult your financial advisor before making any investment decisions.
#Crypto | #Solana | #SOL | #TechnicalAnalysis | #ChartPatterns | #CupAndHandle | #AscendingTriangle | #LongTermView
