Styrenix Performance Materials Ltd - Breakout Setup, Move is ON.#STYRENIX trading above Resistance of 2485
Next Resistance is at 3295
Support is at 1675
Here are previous charts:
Chart is self explanatory. Levels of breakout, possible up-moves (where stock may find resistances) and support (close below which, setup will be invalidated) are clearly defined.
Disclaimer: This is for demonstration and educational purpose only. This is not buying or selling recommendations. I am not SEBI registered. Please consult your financial advisor before taking any trade.
Chartpatterntrading

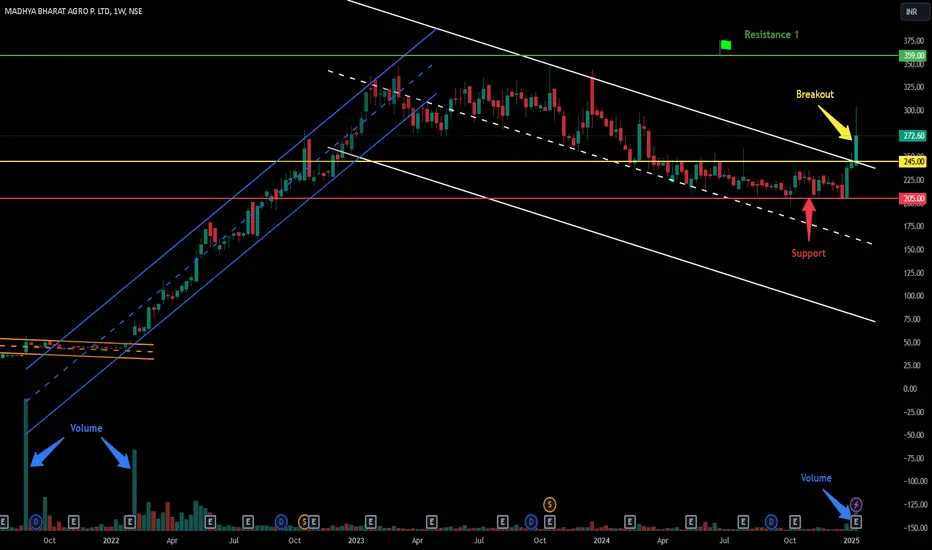
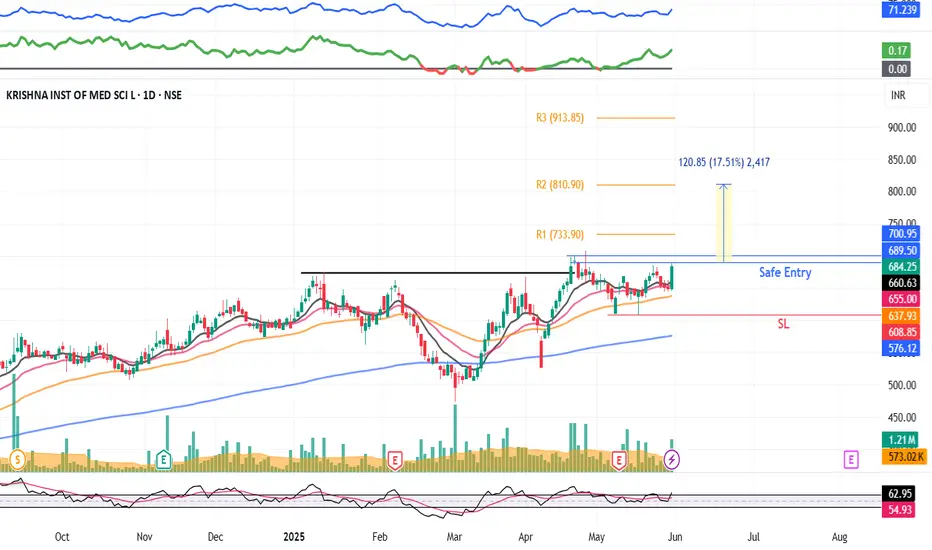
Breakout in Madhya Bharat Agro Products Ltd...Chart is self explanatory. Levels of breakout, possible up-moves (where stock may find resistances) and support (close below which, setup will be invalidated) are clearly defined.
Disclaimer: This is for demonstration and educational purpose only. This is not buying or selling recommendations. I am not SEBI registered. Please consult your financial advisor before taking any trade.
Samvardhana Motherson BreakoutMOTHERSON Stock Analysis
MOTHERSON stock is breaking out again on the monthly chart after previously reaching a new all-time high and then declining. It recently broke the trend-line with good buying pressure. The target could be the all-time high or lower, but it may take a few months to reach if things go well. Stop-loss should be set based on individual risk appetite.
Index Inclusion : Part of NIFTY NEXT 50 and NIFTY 100 indices, indicating significant market presence.
Financial Highlights:
- Revenue Growth : Consistent increase over recent quarters, reaching Rs 113,662 crore in Mar 2025.
- Net Profit : Also rising, with Rs 3,618 crore in Mar 2025.
- EPS : Improved to Rs 5.50 in Mar 2025.
- Annual Revenue & Profit : Steady growth over the past five years, with revenue surpassing Rs 113,662 crore and net profit over Rs 3,618 crore in 2025.
Financial Performance:
- Profit Margins : Net profit margin around 3.18% in Mar 2025.
- Valuations : P/E ratio at approximately 23.81, indicating moderate valuation.
- Debt Levels : Debt-to-equity ratio at 0.42, reflecting manageable debt.
- Cash Flow & Balance Sheet : Operating cash flow remains strong; assets and liabilities Show growth aligned with revenue expansion.
These financial insights are sourced from Moneycontrol.
Conclusion :
Motherson International shows a consistent growth in revenue and profits, with stable financial ratios and manageable debt levels. Its inclusion in major indices and recent financial performance suggest it remains a significant player in its sector. However, the recent stock decline indicates market caution, so investors should monitor market sentiment closely.
This is for educational purposes only and not a buy or sell recommendation.

Bullish Breakout in HCL TechStock breaks above key resistance zone of ₹1770
Strong bullish candle formation on the daily chart
Breakout supported by above-average volume, confirming strength
Price broke out from ascending triangle pattern — a classic bullish continuation signal
📢 Fundamental Trigger:
HCL Tech remains strong in cloud, AI, and digital transformation services
Recent deal wins and strong Q4 results supporting bullish sentiment
Attractive valuation compared to peers like TCS & Infosys

Bullish Breakout in VIP Industries 🔍 Chart Overview:
Breakout above resistance zone at ₹420
Strong volume spike confirming buying interest
Price action broke out of a consolidation channel
Formed a bullish flag/pennant pattern before breakout
🔧 Technical Indicators:
RSI moving above 60 → bullish momentum building
MACD crossover near zero line → fresh upward signal
50 EMA support intact, stock trading above all major EMAs

360 ONE – Bullish breakout360 ONE (NSE: 360ONE), a leading wealth and asset management firm in India, is showing strong bullish momentum backed by:
✅ Consistent Growth in AUM: The company continues to scale its assets under management with high-net-worth and ultra-HNI client acquisition.
✅ Strong Quarterly Results: Robust revenue growth and improving profit margins signal efficient operations and increased demand for wealth management services.
✅ Technically Sound Setup:
The stock has broken out from a key resistance zone with rising volumes.
Trading above all major EMAs (20/50/200), confirming a strong uptrend.
RSI is in bullish territory (>60), indicating momentum is intact.
✅ Sectoral Tailwind: The shift from traditional investments to managed wealth products is boosting firms like 360 ONE.
🟢 Price Action Suggests Further Upside
With growing investor confidence and institutional interest, the stock is poised for a potential 10–15% move in the near term, if it sustains above the breakout level.

Inside 2 Weekly Timeframe CT Breakouts With Strong VolumesPurely chart-based view. No bias. No advice. Just how I interpret these right now
I make educational content videos on Swing trading .

NDR Auto Components Ltd - Breakout Setup, Move is ON...#NDRAUTO trading above Resistance of 1476
Next Resistance is at 1938
Support is at 1094
Here are previous charts:
Chart is self explanatory. Levels of breakout, possible up-moves (where stock may find resistances) and support (close below which, setup will be invalidated) are clearly defined.
Disclaimer: This is for demonstration and educational purpose only. This is not buying or selling recommendations. I am not SEBI registered. Please consult your financial advisor before taking any trade.

Fiem Industries - Long Setup, Move is ON...#FIEMIND trading above Resistance of 2317
Next Resistance is at 3624
Support is at 1510
Here are previous charts:
Chart is self explanatory. Levels of breakout, possible up-moves (where stock may find resistances) and support (close below which, setup will be invalidated) are clearly defined.
Disclaimer: This is for demonstration and educational purpose only. This is not buying or selling recommendations. I am not SEBI registered. Please consult your financial advisor before taking any trade.

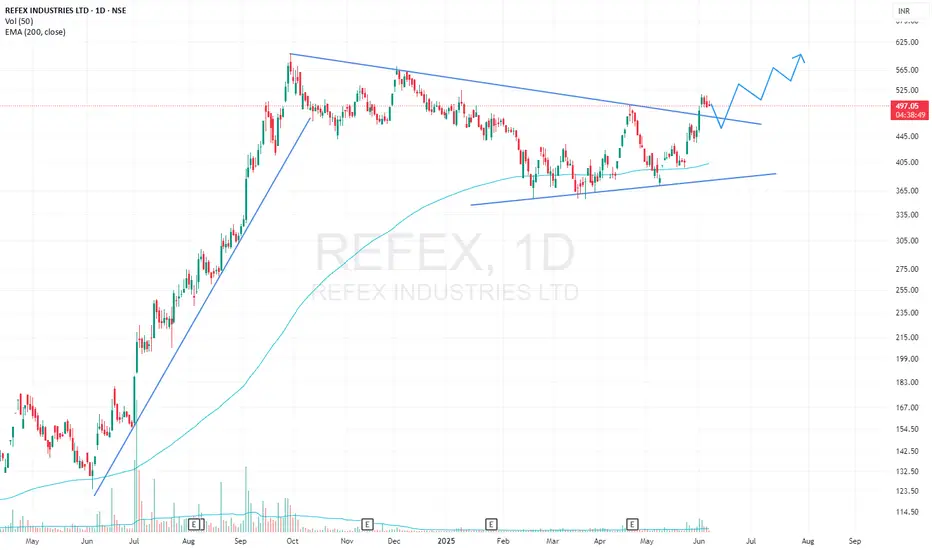
REFEX Triangle & Bull Flag BreakoutREFEX has given a breakout from Symmetrical Triangle and Bull Flag pattern on 1D timeframe with high volumes. Stock has also bounced several times from 200 EMA. Long Position can be initiated with proper risk management.
PEL : Swing Pick#PEL #trendingstock #breakoutstock #Momentumstock
PEL : Swing Trade
>> Trending setup
>> Breakout candidate
>> Stock in Momentum
>> Rounding bottom in formation
>> Low Risk High Reward Trade
Swing Traders can lock profit at 10% and keep trailing
Disc : Charts shared are for Learning purpose and not a Trade recommendation
Consult a SEBI Registered Advisor before taking position in it.
The Above Stock analysis is done purely on the technical basis only & Technical analysis is also 100% full proof. so i reserve the right to be wrong, if thats d case it will be learning experience.

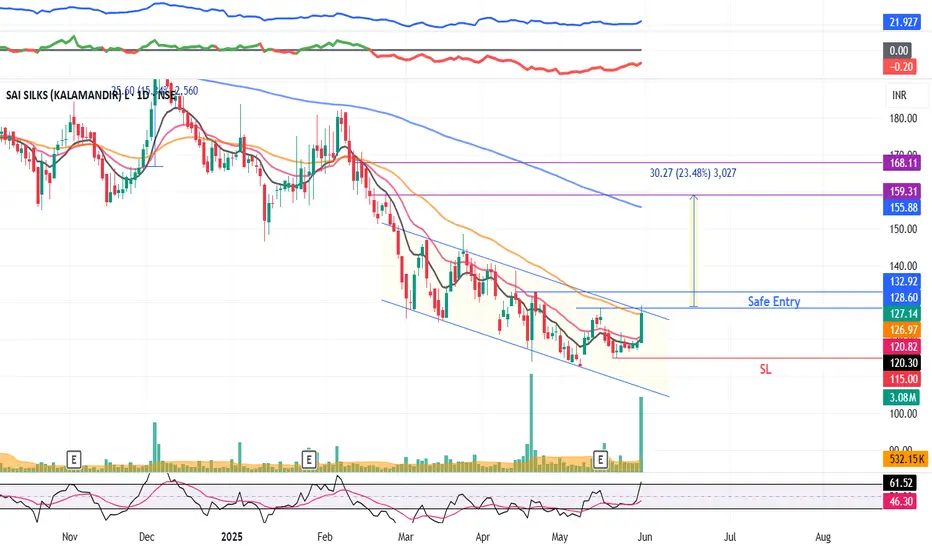
KALAMANDIR : Falling Channel pattern#KALAMANDIR #chartpatterntrading #fallingchannelpattern #channelbreakout #breakoutstock
KALAMANDIR : Swing Trade
>> Breakout stock
>> Falling Channel pattern breakout
>> Good Strength & Volume Buildup
>> Stock in Momentum
Swing Traders can lock profits @10% & keep trailing
Disc : Stock Charts shared are for Learning purpose, not a Trade recommendation
Consult a SEBI Registered Advisor before taking position in it.
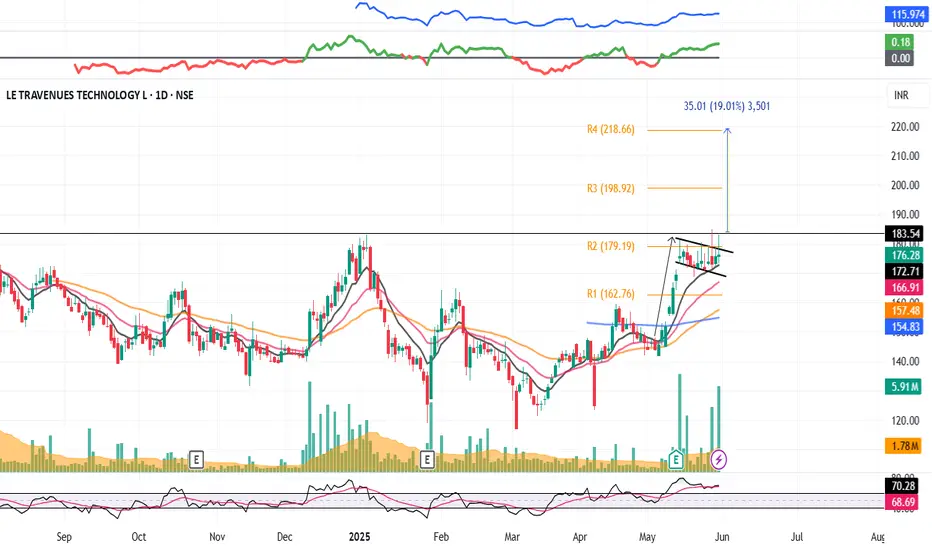
IXIGO : Breakout candidate (swing pick)#IXIGO #chartpatterntrading #flagpattern #breakoutstock #Chartpatternbreakout
IXIGO : Swing Trade
>> Long Range Consolidation Breakout Soon
>> Flag pattern breakout
>> Good Strength in stock
>> Recent Volume buildup is good
>> Good Upside Potential
Swing Traders can lock profit at 10% and keep trailing.
Disc : Stock charts shared are for Learning purpose, not a Trade recommendation.
Consult a SEBI Registered Advisor before taking position in it.
KIMS : Swing pick#KIMS #Swingtrade #trendingstock #breakoutstock
KIMS : Swing Pick
>> Breakout Stock
>> Trending setup
>> Good Strength in Stock
>> Good Volumes Buildup
>> Good Upside Potential
Swing Traders can lock profit at 10% and keep trailing
Disc : Stock charts shared are for Learning purpose not a Trade recommendation.
Consult a SEBI Registered Advisor before taking position in it.
Welspun Corp - Breakout Setup, Move is ON...#WELCORP trading above Resistance of 750
Next Resistance is at 916
Support is at 614
Here are previous charts:
Chart is self explanatory. Levels of breakout, possible up-moves (where stock may find resistances) and support (close below which, setup will be invalidated) are clearly defined.
Disclaimer: This is for demonstration and educational purpose only. This is not buying or selling recommendations. I am not SEBI registered. Please consult your financial advisor before taking any trade.

Hitachi Energy (PowerIndia) - Breakout Setup, Move is ON...#POWERINDIA trading above Resistance of 12845
Next Resistance is at 17702
Support is at 9481
Here are previous charts:
Chart is self explanatory. Levels of breakout, possible up-moves (where stock may find resistances) and support (close below which, setup will be invalidated) are clearly defined.
Disclaimer: This is for demonstration and educational purpose only. This is not buying or selling recommendations. I am not SEBI registered. Please consult your financial advisor before taking any trade.

Inverted Head & Shoulders Breakout | VIKAS LIFESCIENCES🟡 Structure Breakdown:
Left Shoulder: A lower low, continuing the bearish trend.
Head: A deeper low marking the climax of selling.
Right Shoulder: A higher low—a pivotal sign of accumulation and shifting sentiment.
✅ Supply-Demand Flip Zone Cleared:
Price has convincingly closed above the green zone, which acted as both prior supply and recent demand—now serving as a supportive launchpad.
✅ Counter-Trendline (CT) Breakout:
A clean breakout of the white counter-trendline confirms the structural reversal. This breakout is not only technical—it’s also volume-backed with ~24M shares traded, reinforcing conviction.
✅ Volume Confirmation:
Breakout accompanied by surging volume—an essential ingredient for validating any bullish setup. Indicates institutional activity or broader market participation.

Hidden Channel SHATTERED – Explosive Breakout on SHILPA MEDICARE✅ Breakout from a well-defined Weekly Counter Trendline (white thick line) with strong bullish candle.
⚡ Hidden Broadening Channel Formation (dotted white lines) was also broken in the same move—double breakout confirmation!
💥 Volume spike — first major surge in weeks, indicating institutional participation.
📌 Consolidation just below major resistance (MTF orange line) played out perfectly. Price broke above previous swing highs.
🧱 Next Resistance: ₹898.05 (Monthly TF resistance). With current momentum, a clean test is highly probable.

Bullish Divergence: COLPALThe price is making lower lows, and the RSI is making higher highs, which is a clear bullish divergence. The RSI divergence hints that the sellers are running out of strength. The price action suggests a potential breakout to the upside, but only if the price breaks the resistance trendline with volume and confirmation on a lower time frame by testing this descending trendline as support.
In contrast, the price fails to break the trendline and rolls over again.
In that case, RSI might also get rejected around the midline, and we go back to retest the lows or make new ones.

BSE Ltd - Breakout Setup, Move is ON...#BSE trading above Resistance of 4169
Next Resistance is at 6645
Support is at 2586
Here is previous chart:
Chart is self explanatory. Levels of breakout, possible up-moves (where stock may find resistances) and support (close below which, setup will be invalidated) are clearly defined.
Disclaimer: This is for demonstration and educational purpose only. This is not buying or selling recommendations. I am not SEBI registered. Please consult your financial advisor before taking any trade.

Mazagon Dock Shipbuilders - Breakout Setup, Move is ON...#MAZDOCK trading above Resistance of 4315
Next Resistance is at 6033
Support is at 2955
Here are previous charts:
Chart is self explanatory. Levels of breakout, possible up-moves (where stock may find resistances) and support (close below which, setup will be invalidated) are clearly defined.
Disclaimer: This is for demonstration and educational purpose only. This is not buying or selling recommendations. I am not SEBI registered. Please consult your financial advisor before taking any trade.

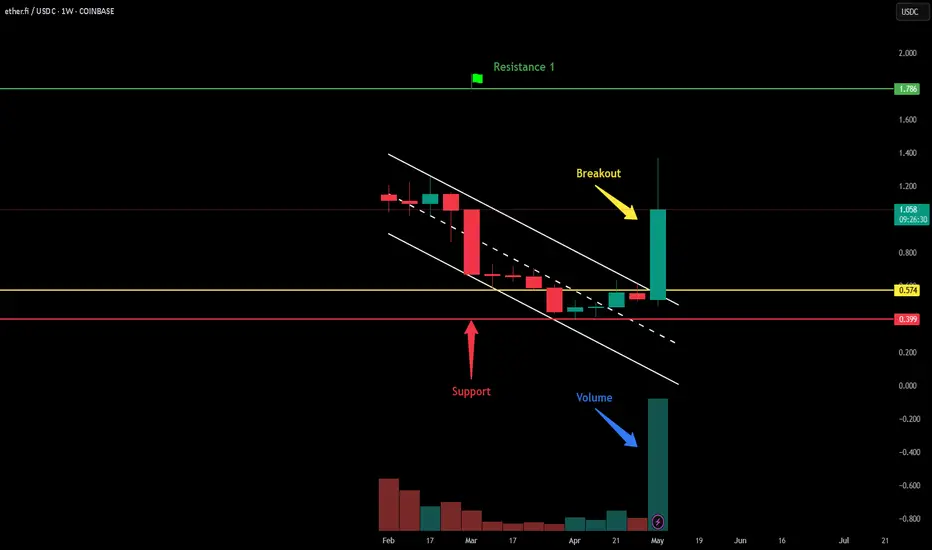
Breakout in ETHFI / TetherUS...Chart is self explanatory. Levels of breakout, possible up-moves (where crypto may find resistances) and support (close below which, setup will be invalidated) are clearly defined.
Disclaimer: This is for demonstration and educational purpose only. This is not buying or selling recommendations. Please consult your financial advisor before taking any trade.
Bajaj Finance on flag n pole break out.Bajaj fin. is trading in Flag n pole pattern. Break out done near 8000 level.
As per chart target for this patten would be 10500 and 11850 soon.
It is at demand zone can add more on any correction.
