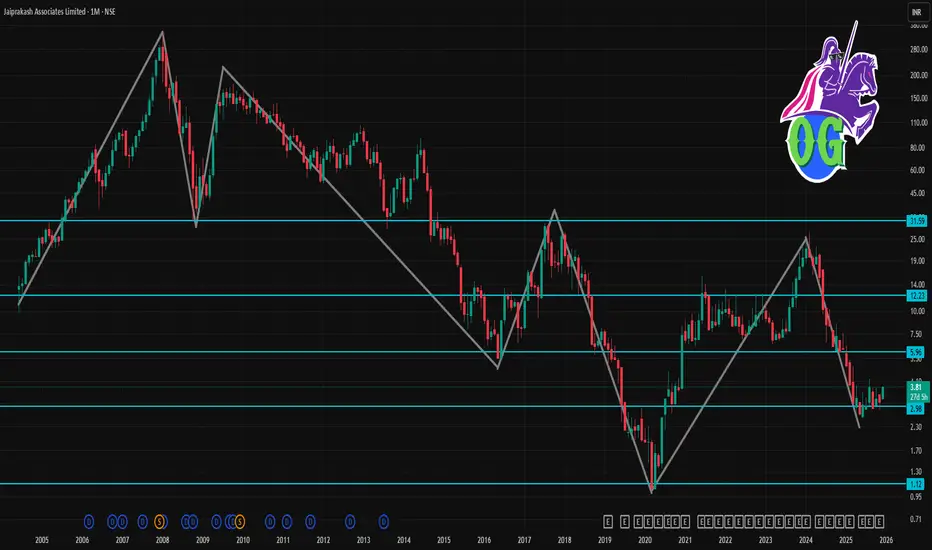
JPASSOCIAT 1 Month Time Frame 🔎 Current snapshot
Recent price (early Dec 2025): ~ ₹ 3.60–₹ 3.81.
52-week high / low: ~ ₹ 7.57 / ₹ 2.56.
Company remains under resolution/insolvency proceedings. Its balance sheet, according to data, shows negative book value and poor earnings metrics over recent years.
Because of this, the stock is highly volatile and speculative. Analysts have repeatedly flagged that such small-cap, distressed companies are “easy to enter but difficult to exit.”
🎯 My view (1-month horizon)
Given high uncertainty, best to treat this as a speculative trade rather than a “safe bet.”
Short-term upside is possible if there is news on resolution/acquisition or better-than-expected restructuring.
But downside risk remains high — if negative developments emerge, the stock may slip back.
Chartpatterntrading
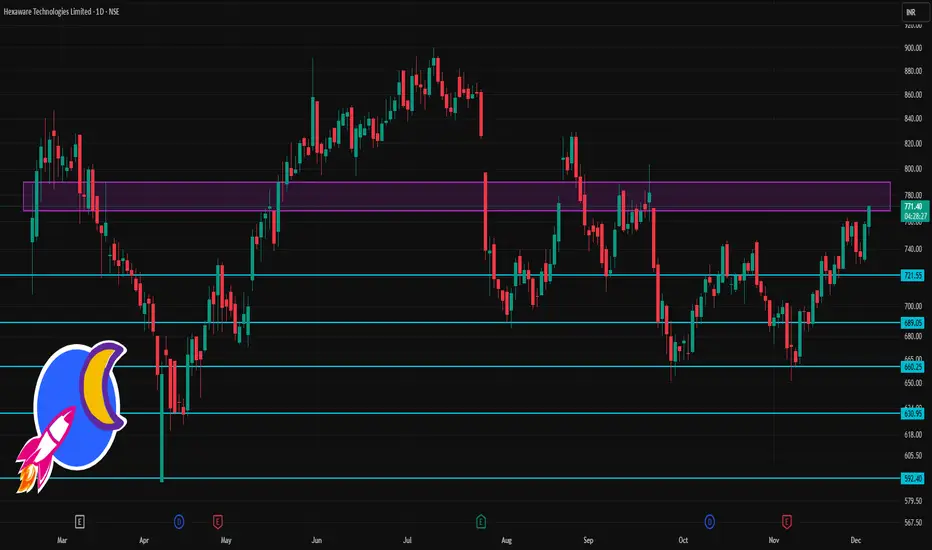
HEXT 1 Day Time Frame 🔎 Current Context & Price
Latest price: ~ ₹770–771.
Day’s trading range seen: roughly ₹750–772.
52-week range: ₹590.30 (low) – ₹900 (high).
⚠️ What to Watch / Risk Zones
If price falls below ~₹745–750 (support zone), risk of more significant slip toward ₹738–740.
Resistance around ₹775–785 could trigger profit-taking or consolidation — strength of buying volume matters.
As with all mid-cap IT stocks, macro factors (global demand, forex, sector sentiment) may override technicals.
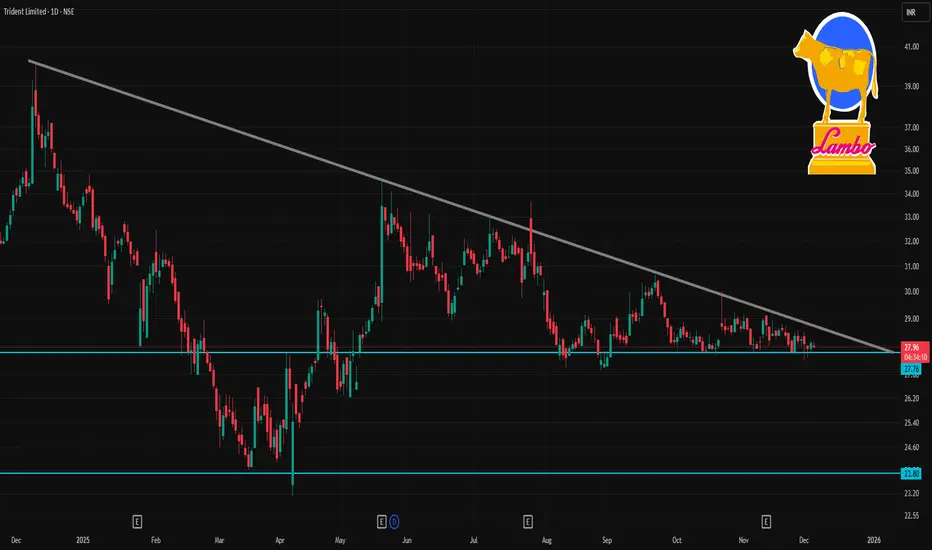
TRIDENT 1 Day Time Frame 📌 Key data
Current price: ~₹28.2.
52-week high / low: ₹40.20 / ₹23.11.
🧭 Pivot / Support / Resistance (1-day based)
Based on a daily pivot-point analysis:
Level Price
Pivot (daily mid) ~ ₹28.02
Resistance 1 (R1) ~ ₹28.32
Resistance 2 (R2) ~ ₹28.53
Support 1 (S1) ~ ₹27.81
Support 2 (S2) ~ ₹27.51
Because the stock is already around ₹28.2, intraday traders might treat ~₹28.5 as a near-term resistance, and ~₹27.5–₹27.8 as the support zone (on a breakdown).
⚠️ What to watch / Risks
Technical signals are mixed: some moving averages are “outperform/positive”, but many oscillators and technical-indicator-based services are still flagging a “sell/neutral” bias on the daily chart.
The stock has underperformed over long term — price is much below 52-wk high, returns have been weak — so volatility or broader market sentiment could sway levels significantly.
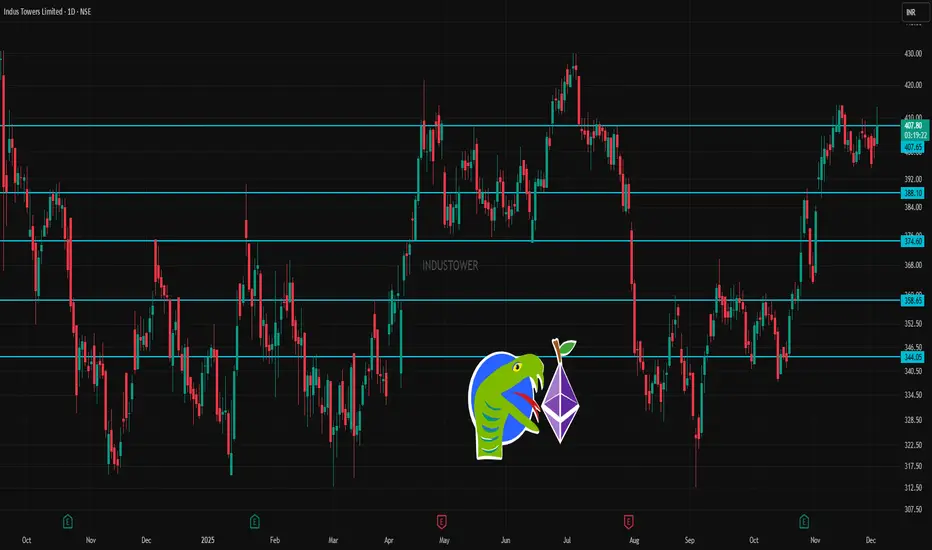
INDUSTOWER 1 Day Time Frame 📌 Key Data & Trend Context
Recent price: around ₹ 404 (or in the ~₹ 401–409 range depending on source/time).
52‑week range: Low ≈ ₹ 312.55, High ≈ ₹ 430.00.
According to moving averages (short‑, mid‑ & long‑term), trend is marked “outperform” / bullish.
✅ What This Suggests (in 1‑day / Short-Term Context)
As long as price holds above ₹ 388–392, the near‑term trend remains stable / bullish.
A close above ₹ 405–408 on decent volume may signal a bullish breakout — could push toward ₹ 424–438 range.
On a drop below ₹ 338–346, the stock could weaken significantly — suggesting caution or a bearish tilt.
Given moving averages (short + mid + long) are in bullish alignment, intermediate‑term bias remains positive.
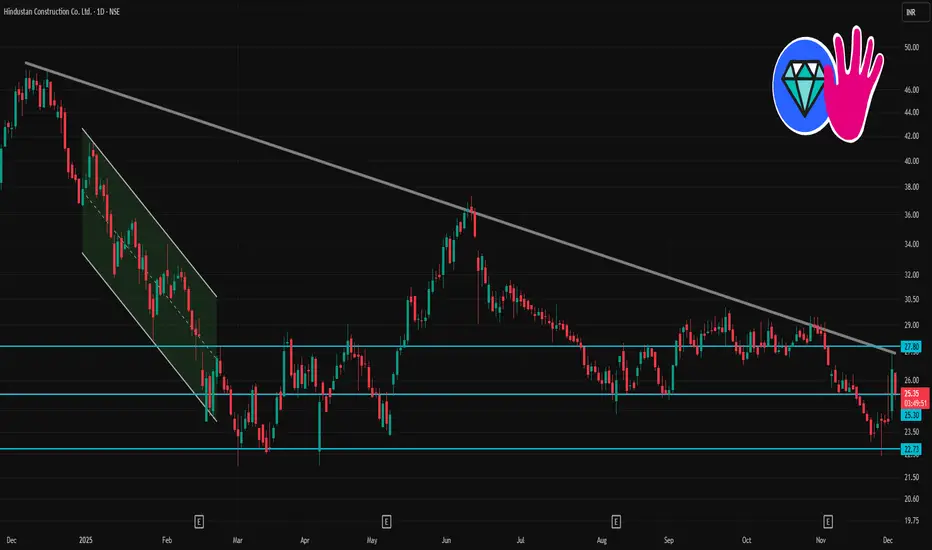
HCC 1 Day Time Frame📊 HCC — Key 1‑Day Levels
Based on the latest technical summary:
Level Value (₹) Significance
Opening Price (today) ~ ₹25.48 Start‑of‑day reference
Day’s Low ~ ₹25.30 Intra‑day support floor
Day’s High ~ ₹26.40‑₹26.47 Intraday resistance ceiling
Classic Pivot Point (1‑day) ~ ₹25.59 Mid‑point; price above = bullish bias,
below = bearish tilt
Support (S1) ~ ₹24.73 Key zone if price drops — potential
bounce area
Resistance (R1) ~ ₹27.17 If price rallies, watch this zone for
near‑term selling pressure
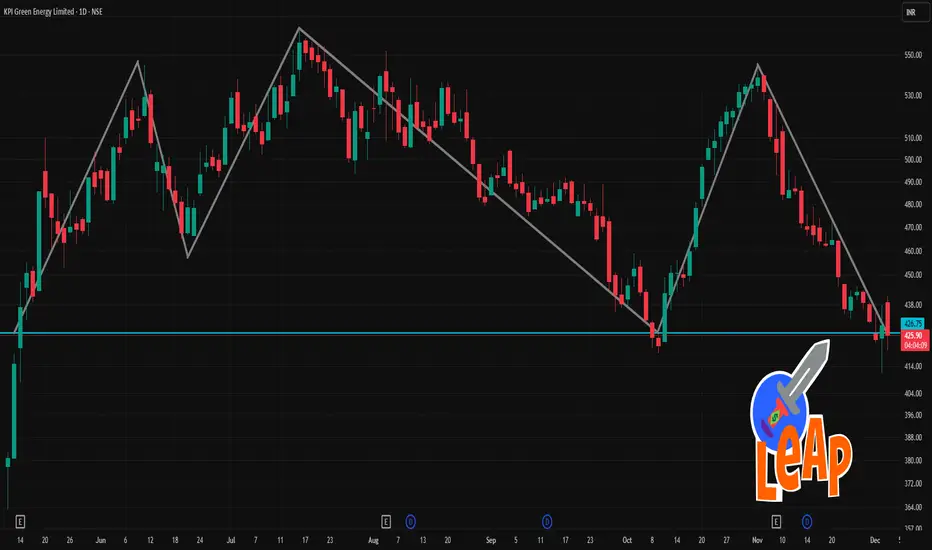
KPIGREEN 1 Day Time Frame 📈 Current Snapshot (as per latest available sources)
Several platforms list the share price around ₹ 429.9 – ₹ 431.4 on NSE in recent sessions.
The 52‑week range for KPI Green remains roughly ₹ 313.40 (low) to ₹ 588.80 (high).
On a recent day, typical intraday swings showed lows around ₹ 430‑431 and highs near ₹ 437‑438, indicating a moderate intraday move.
🧮 What This “Level” Suggests Today
The current price (~₹ 430–431) places the stock substantially above the 52‑week low, but significantly below the 52‑week high — suggesting the stock is in a lower‑to‑mid zone of its yearly range.
Intraday volatility seems modest; the share hasn’t shown large spikes today, indicating relatively stable trading so far.
This could imply either consolidation or market caution — not a strong upward breakout, but also not near floor levels.
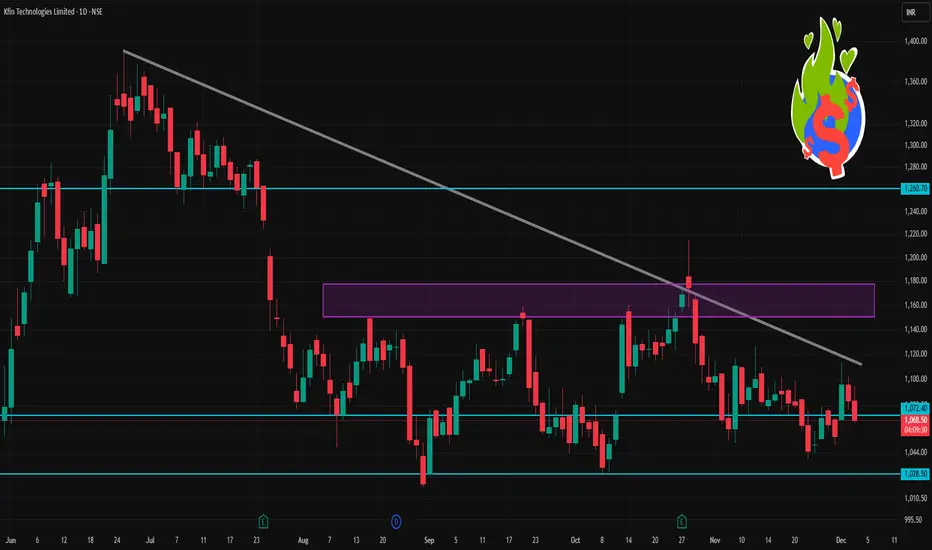
KFINTECH 1 Day Time Frame 📊 Current Snapshot (as of right now)
Reported day’s trading‑range so far: ~ ₹ 1,066.70 (low) to ~ ₹ 1,095.00 (high)
Opening price: ~ ₹ 1,083.80
Previous close: ~ ₹ 1,083.40
Market‑wide context: 52‑week high ~ ₹ 1,641.35, 52‑week low ~ ₹ 784.15
📌 Key Intraday / Short‑Term Levels (Classic Pivot‑Style)
Using the standard pivot‑point formula (Pivot = (High + Low + Close)/3) plus support/resistance calculations.
Here’s what that yields roughly for today — with High = 1,095.00, Low = 1,066.70, Close (yesterday) ≈ 1,083.40:
Level Approximate Price (₹)
Pivot (PP) ~ 1,081.70
Support 1 (S1) ~ 1,068.40
Support 2 (S2) ~ 1,050.40
Resistance 1 (R1) ~ 1,108.90
Resistance 2 (R2) ~ 1,131.00
Interpretation:
If the price stays above PP (~1,082) — bullish bias; otherwise, cautious/bearish.
S1 (~1,068) may act as “first floor”: if price drops near there and holds, watch for bounce.
A break below S2 (~1,050) might lead to deeper correction or volatility.
On upside, a strong move above R1 (~1,109) could challenge R2 (~1,131).
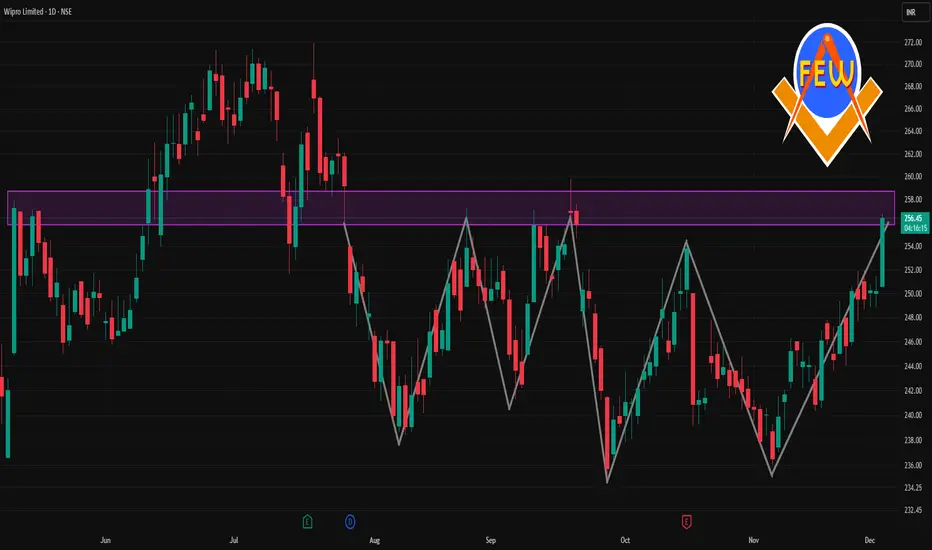
WIPRO 1 Day Time Frame 📊 Quick Snapshot
Last traded price: ~ ₹255-256
52-week range: Low ~ ₹228, High ~ ₹324–325
Recent volatility: stock has been trading in a range near ₹250–256 over past few sessions.
📈 What to Watch for the Day
If price holds above ~₹255 and gains strength, Wipro may attempt a move toward ₹265-270 — a reasonable intraday target.
If price drops below ~₹250, downside pressure could take it to ~₹245–248, or even retest ~₹242-240 if broader markets weaken.
Keep an eye on volume: higher-than-average volume on breakout or breakdown often validates the move.
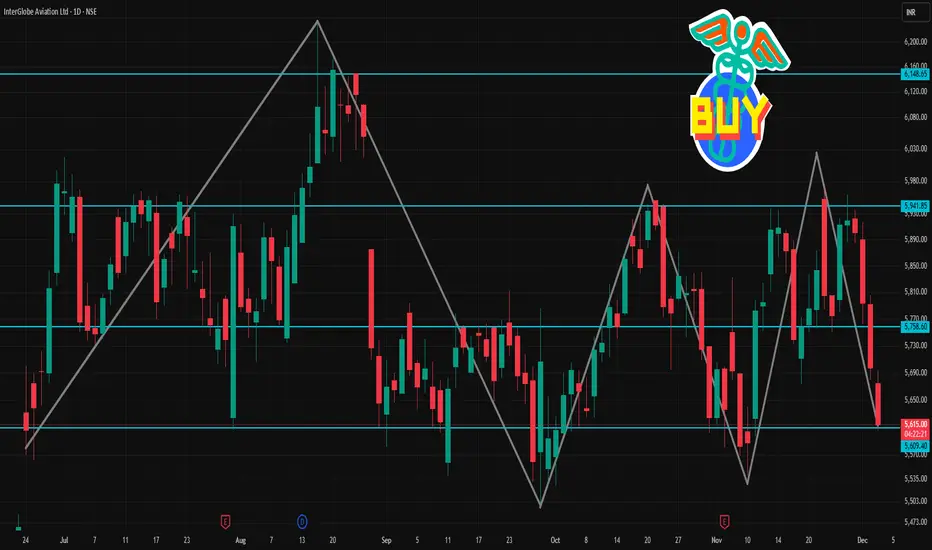
INDIGO 1 Day Time Frame 📌 Latest Price Snapshot & Context
On a recent trading day, the stock’s day’s range was ~ ₹ 5,626 – ₹ 5,694.
The 52-week range remains ₹ 3,945 – ₹ 6,232.50.
Recent closing / quoted prices have been around ₹ 5,900 – ₹ 5,913 (though there are multiple sources — price may fluctuate intraday).
🔄 Daily Pivot & Key Intraday Levels (Standard + Camarilla/Fibonacci from a common pivot-level table)
From a recent pivot-level analysis for “daily” timeframe:
Level Type / Label Price (Approx, ₹)
Pivot (standard daily) ₹ 5,672.33
Support 1 (S1) ₹ 5,634.67
Support 2 (S2) ₹ 5,599.33
Support 3 (S3) ₹ 5,561.67
Resistance 1 (R1) ₹ 5,707.67
Resistance 2 (R2) ₹ 5,745.33
Resistance 3 (R3) ₹ 5,780.67
For “Camarilla” variant on same day: pivot also ₹ 5,672.33, with S- and R- levels slightly tighter: e.g. S1 around ₹ 5,663, R1 around ₹ 5,677.
Some alternate analyses cite supports around ₹ 5,733 / ₹ 5,671 / ~₹ 5,579, and resistances ~ ₹ 5,804 / ₹ 5,832 / ~₹ 5,978 depending on timeframe/ method.
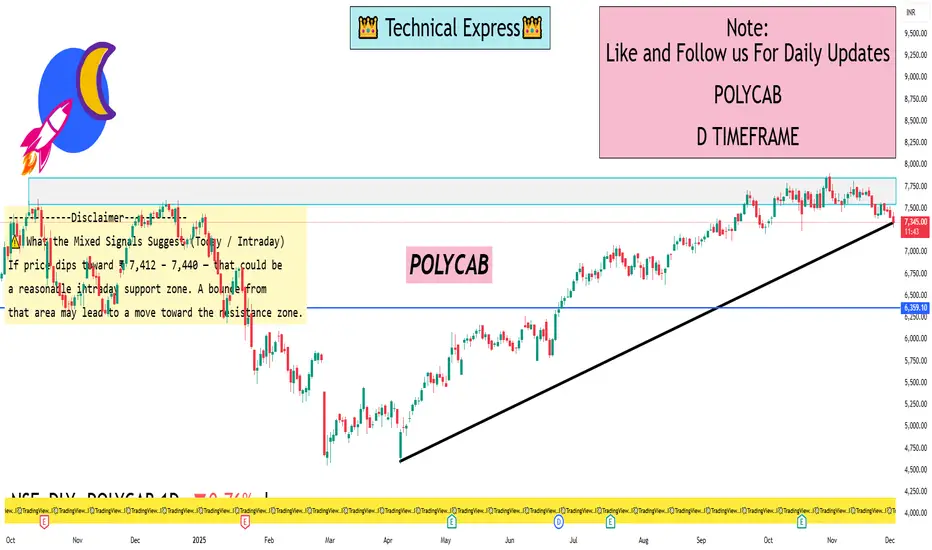
POLYCAB 1 Day View📈 Key Price & Context
Latest intraday trading range (recent session): ~ ₹ 7,416.00 – ₹ 7,568.50.
52‑week range: Low ≈ ₹ 4,555 • High ≈ ₹ 7,903.
⚠️ What the Mixed Signals Suggest (Today / Intraday)
If price dips toward ₹ 7,412 – 7,440 — that could be a reasonable intraday support zone. A bounce from that area may lead to a move toward the resistance zone.
On a rally — resistance around ₹ 7,510 – 7,578 is likely to cap upside unless there is strong volume or trigger news.
Given mixed technical readings (some bullish MAs vs weak oscillators), expect sideways to modestly bullish bias — with potential for intra‑day swings rather than a strong trend.
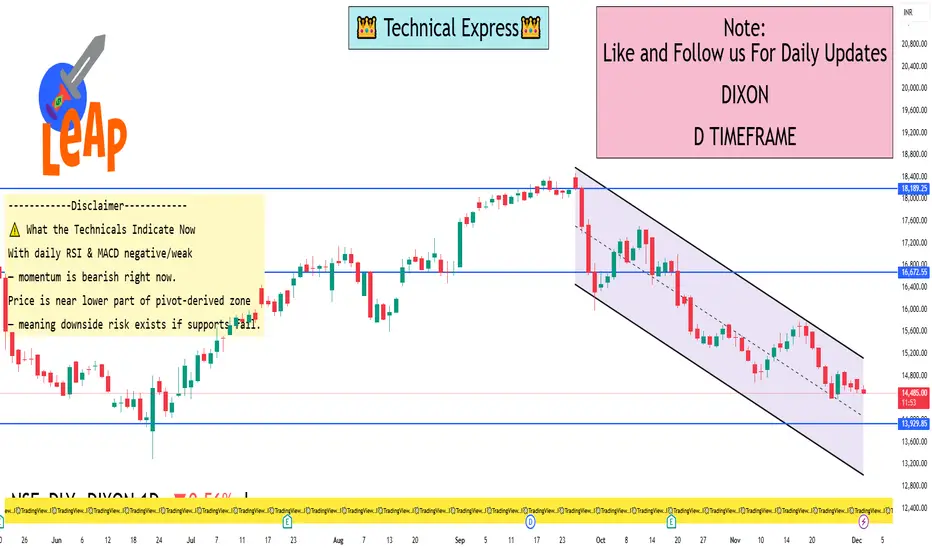
DIXON 1 Day View📌 Recent Price & Context
Last price around ₹ 14,554–₹ 14,570.
52‑week range: low ~ ₹12,202 and high ~ ₹19,149.
Recent technicals (RSI, MACD, etc.) suggest weak momentum / a “sell” bias on daily chart.
⚠️ What the Technicals Indicate Now
With daily RSI & MACD negative/weak — momentum is bearish right now.
Price is near lower part of pivot‑derived zone — meaning downside risk exists if supports fail.
For bulls to regain control, breaking above ~ ₹14,400–14,500 (R1–R2) would be an encouraging sign — could pave way to medium‑term levels.
If support at ~ ₹14,115–14,020 breaks, the next major support would be around the lower zone / 52‑week low vicinity (but that’s a bigger move).
HEROMOTOCO 1 Day View📈 Current Technical Snapshot
As of the most recent close, Hero MotoCorp is trading around ₹ 6,174–₹ 6,175.
Medium‑ to long‑term moving averages (20‑day, 50‑day, 100‑day, 200‑day) are all below current price — indicating a bullish trend on daily timeframe.
Momentum indicators (e.g. MACD, RSI, CCI) remain positive in recent technical overlays — reflecting continued bullish bias.
🧭 What this means (short‑term bias)
As long as the stock remains above ~ ₹ 6,098–6,100, positive bias likely remains intact — supports may hold if there’s a pullback.
A break above ₹ 6,200–6,205 could open near‑term upside toward ₹ 6,250–6,300+ (near recent highs / psychological resistance).
On downside — if price breaks convincingly below ~ ₹ 6,000, next real support comes only near ₹ 5,995–6,000.
⚠️ What to Watch / Limitations
Technical levels are zones, not precise lines — price may overshoot briefly before reaction.
Market‑wide factors or news (macroeconomic, demand for two‑wheelers, policy, daily volume) can override technicals.
These levels are short‑term / 1‑day to few‑day oriented. For swing or long‑term holdings, combine with weekly / monthly chart analysis.

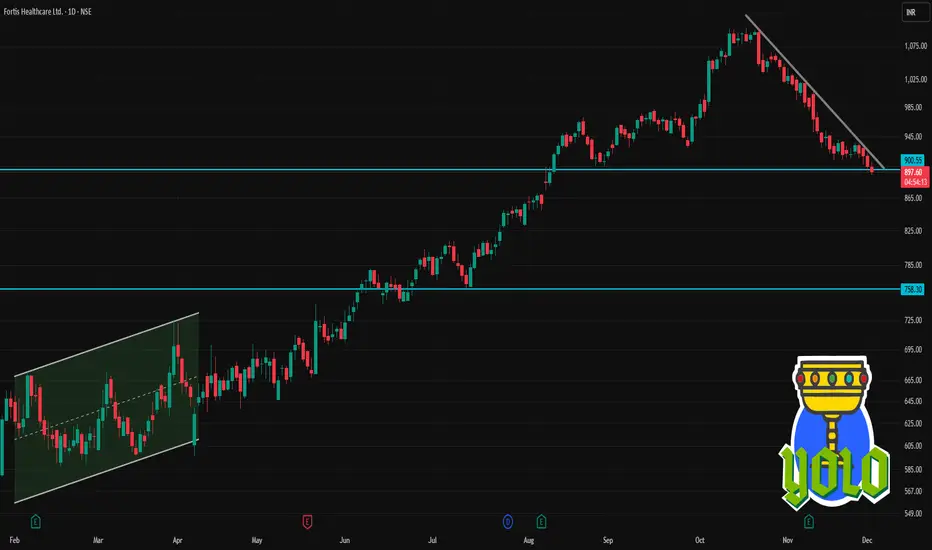
FORTIS 1 Day Time Frame 📈 Recent Price & Context
Last closing price was ~ ₹904.85.
52-week range: Low ≈ ₹577, High ≈ ₹1,104.30.
The stock has corrected from recent highs — showing some weakness in the near term.
🧭 What It Means (For Traders)
For a day-trader / intraday: watch pivot + support/resistance zones (≈ ₹908 pivot; ₹895/886 supports; ₹918/931 resistances). Use tight stop-loss near support for longs.
For a swing-trader / short-term horizon (few days to 1–2 weeks): current bearish indicators suggest caution — better to wait for a clear bounce above ~₹918–930 range or a confirmed breakdown below ~₹886 to decide direction.
Keep an eye on broader market sentiment & sector news — hospital/health-care stocks often react to regulatory or news events which can override technicals.
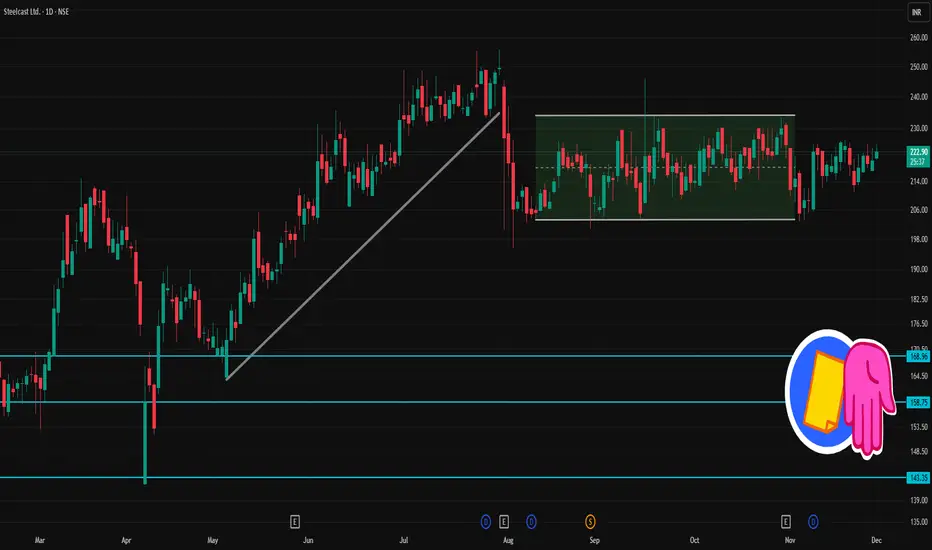
STEELCAS 1 Day Time FrameKey levels for Steelcast (STEELCAS)
📌 Resistance: ~ ₹223.7 (1st) and ~ ₹227.3 (2nd)
📌 Support: ~ ₹216.9 (1st) and ~ ₹213.7 (2nd)
📌 Pivot / reference price: ~ ₹220.5
Context / what this means
The stock opened around ₹221, traded between ₹221‑₹224.6 today.
As long as price stays above support (~₹216.9), the near‑term bias remains mildly positive; a move above resistance (~₹223.7–₹227.3) could bring some upside — possibly re‑testing recent upper range (near 52‑week high zone).
A break below support may push it toward lower support zone around ₹213–₹210.
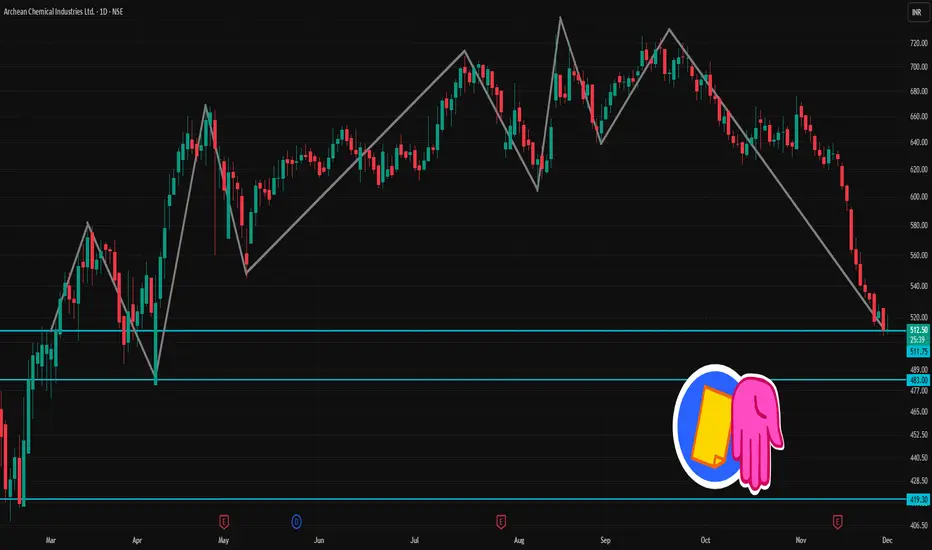
ACI 1 Day Time Frame 📊 Latest snapshot
Recent price ~ ₹ 512 – ₹ 513
52-week range: ~ ₹ 408 (low) to ~ ₹ 730 (high)
Recent technical-analysis summary: Mixed/Neutral to bearish — some moving averages give bullish bias but oscillators appear weak.
⚠️ Technical Signals (Short-Term)
According to one technical summary, short-term trend is marked as “sell”.
Oscillators (e.g. RSI/Stochastic) recently suggest weak or bearish momentum.
✅ What to Watch / Trading Cautions
Momentum is weak; oscillators don’t suggest a strong bullish bounce yet.
If price drops below support (~₹ 508), downside risk increases; need close stop-loss discipline.
Volume & broader market/sector conditions could swing price sharply — stay alert for volatility.
On a bounce, watch if resistance zones get challenged — a breakout may change short-term trend.
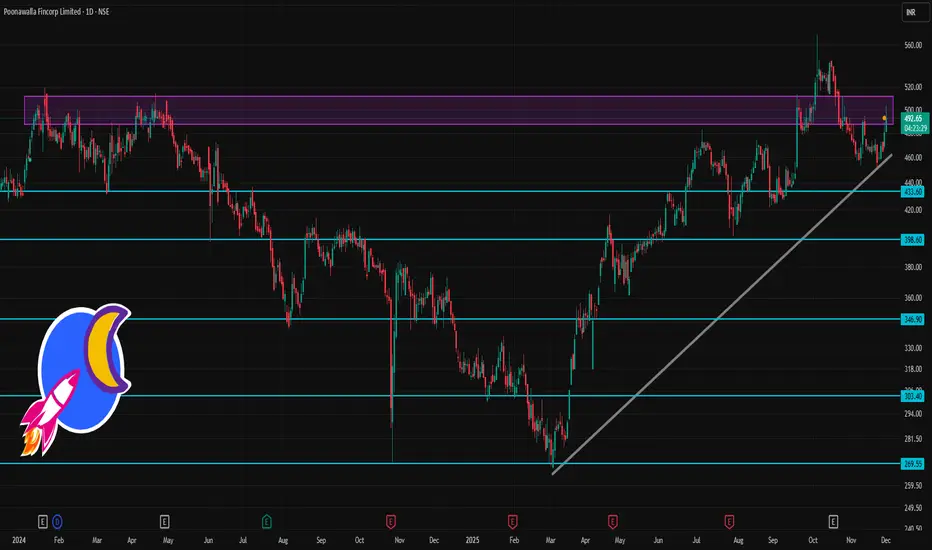
POONAWALLA 1 Day Time Frame 📌 Latest price & context
On one of the latest snapshots, the share price was ~ ₹ 492.65 (as per a public chart)
The stock remains among relatively volatile mid-cap / NBFC counters, with a fairly high beta (i.e. sensitivity to market swings).
✅ Technical Momentum & Risk Profile
Technical sources currently signal a “bullish / buy-leaning” bias based on moving averages (from short-term to long-term) for Poonawalla.
But high volatility & elevated beta mean risk — sharp swings are possible in either direction depending on market sentiment, NBFC-sector news, and macro cues.
⚠️ What to watch out for
The pivot-based levels assume relatively normal volatility — big sector-wide moves, news, or NBFC-specific developments can render them less reliable.
As an NBFC / mid-cap, the stock remains sensitive to interest-rate outlook, credit-sector sentiment, and macroeconomic conditions — not just its own chart.
The “buy bias” from moving averages doesn’t guarantee a smooth upward path — you should watch volume, daily chart pattern, and broader market context.
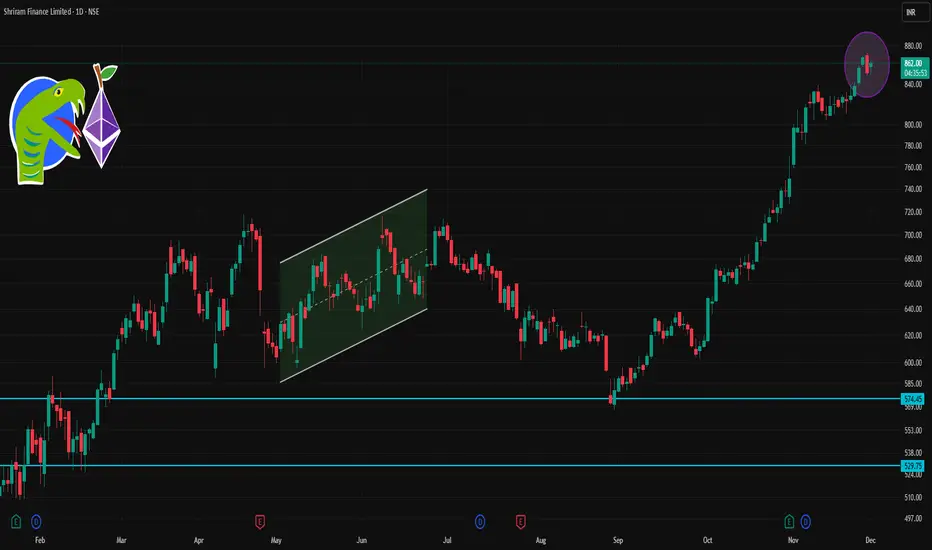
SHRIRAMFIN 1 Day Time Frame 📊 Current Snapshot
Latest live price: ~ ₹852–857 (depending on trade moment).
Today’s high / low range: ~ ₹861.95 high / ~ ₹850.40 low.
52-week range: ₹493.35 (low) ↔ ₹872.00 (high).
✅ What This Means for Intraday / Next Sessions
If price stays above ~₹857–858 (pivot) — bias remains bullish → could target ₹866 → ₹880–881.
If price dips but finds support near ₹842–843, watch for bounce (possible buying opportunity).
A break below ₹834 → ₹820 downward zone might signal risk of further downside — monitor overall market and sector trend.
Use stop-loss (if trading) near support zones to manage risk, given volatility and sensitivity to overall market moves.
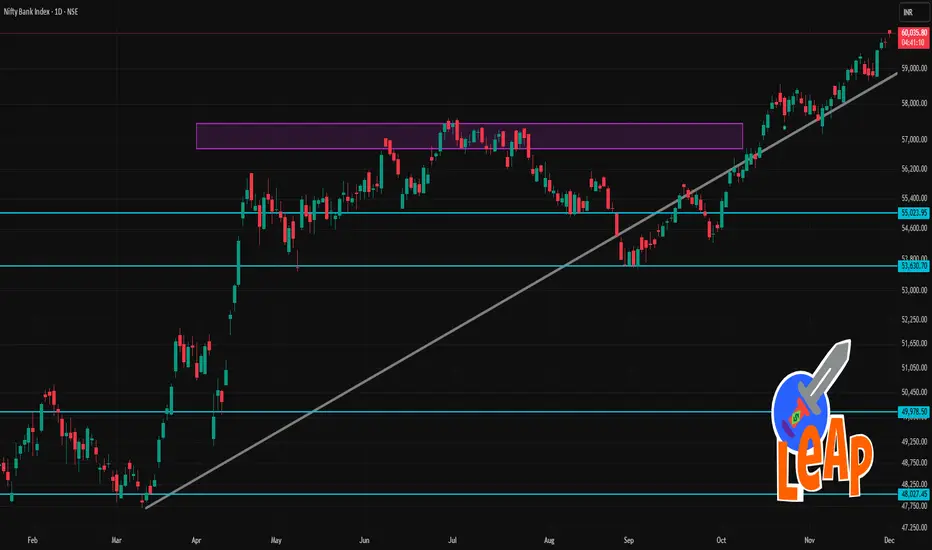
BANKNIFTY 1 Day Time Frame 📊 Current Status
Recent value of Nifty Bank — around 60,066 – 60,070.
Recent daily range: roughly 59,888 – 60,114.
📈 What It Implies Today
If Nifty Bank holds above ~ 59,750–59,800 (pivot), bulls may push toward 60,000, then 60,500+.
On a downside break below ~ 59,440–59,209 zones, watch for a drop toward ~ 58,783.
The 60,500 zone acts as a key upside barrier (resistance) in the near term.
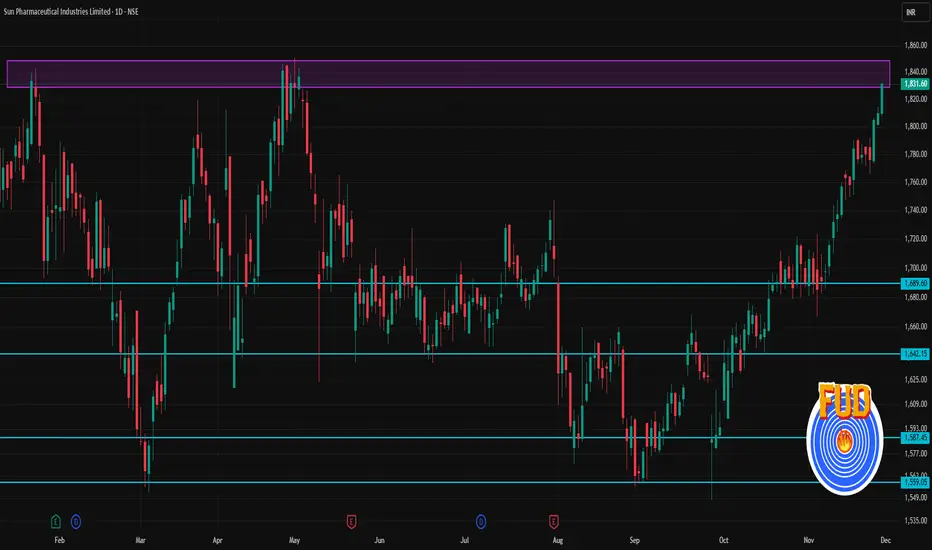
SUNPHARMA 1 Day Time Frame 📈 Key numbers & technical indicators
Last close: ~₹ 1,831.60
Pivot point: ~₹ 1,824.03
Immediate resistance (R1‑R3): ~₹ 1,840.6 → ₹ 1,849.5 → ₹ 1,866.1
Immediate support (S1‑S3): ~₹ 1,815.1 → ₹ 1,798.5 → ₹ 1,789.6
Moving averages: 20‑day ~₹ 1,758.6, 50‑day ~₹ 1,711.7, 100‑day ~₹ 1,690.8, 200‑day ~₹ 1,686.6 — stock is comfortably above all, indicating overall bullishness.
✅ What this suggests now (1‑day / short‑term view)
As long as price stays above pivot (~₹ 1,824), the near‑term bias remains mildly bullish.
If price breaks and sustains above first resistance levels (~₹ 1,840–1,850), next resistance zone near ~₹ 1,865 may come into play.
On downside, if price slips below support zone (~₹ 1,815–₹ 1,798), watch for further weakness toward ~₹ 1,789–₹ 1,775.
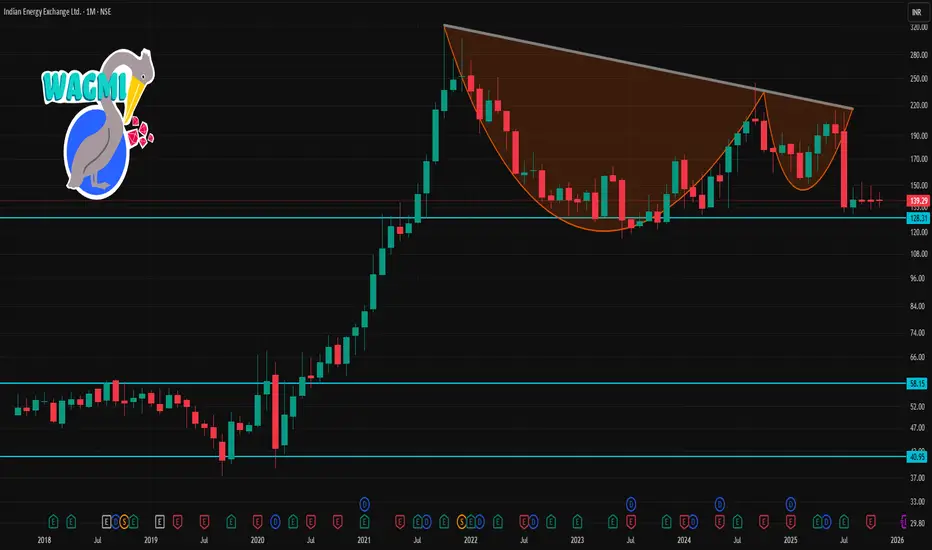
IEX 1 Month Time Frame 📈 Current snapshot
As of late November 2025, IEX trades around ₹139–140/share.
The 52-week range remains ~₹130.26 (low) to ~₹215.40 (high).
Recent trading has seen a dip from earlier resistance around ₹145–150 down to ~₹139.
🎯 1-Month Scenarios for IEX
Neutral / Range-bound → ₹138–145: If markets stay sideways and no big catalyst arrives.
Mild Rebound → ₹145–149: If there’s some buying interest (maybe due to broader market recovery or stabilization), price could test the higher resistance.
Downside Risk → ₹135–137: If sentiment worsens (e.g. fear around regulatory changes, weak volumes), stock could retest lower support.
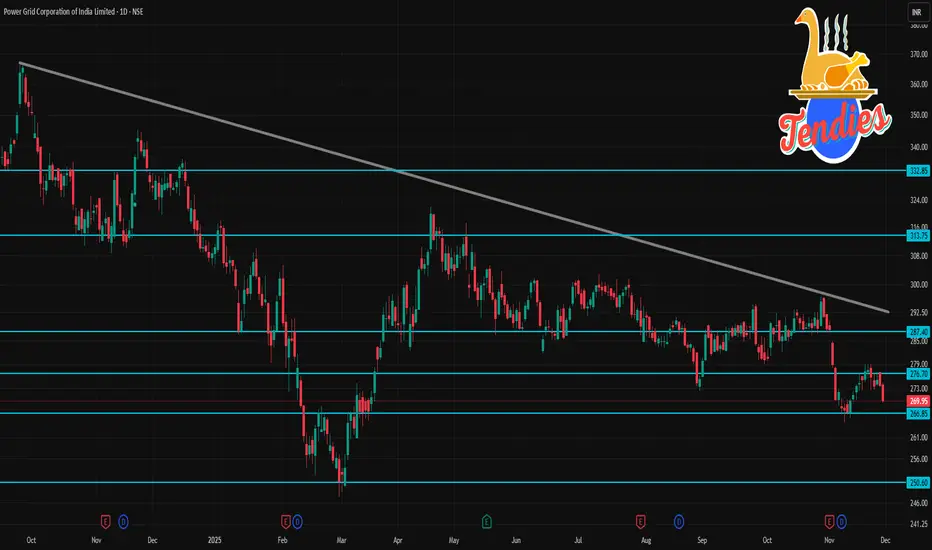
POWERGRID 1 Day Time Frame 📊 POWERGRID — Current snapshot (daily timeframe)
As of last close, POWERGRID was trading around ₹ 269.95.
The 52-week trading range is roughly ₹ 247.30 (low) to ₹ 336.25 (high).
Over the past week, the share price is down about 2.76%, and over the last 6 months, down about 7.3%.
📈 Technical Indicators (Daily Chart)
According to a technical-analysis summary, moving averages and oscillators on daily timeframe show a “Strong Sell” signal for POWERGRID.
The 14-day RSI is near 31, which is close to oversold territory — indicating potential weakness or risk of a further drop.
Some charting platforms show mixed signals (some “sell”, some “neutral”), but overall bias remains bearish to weak, not bullish.
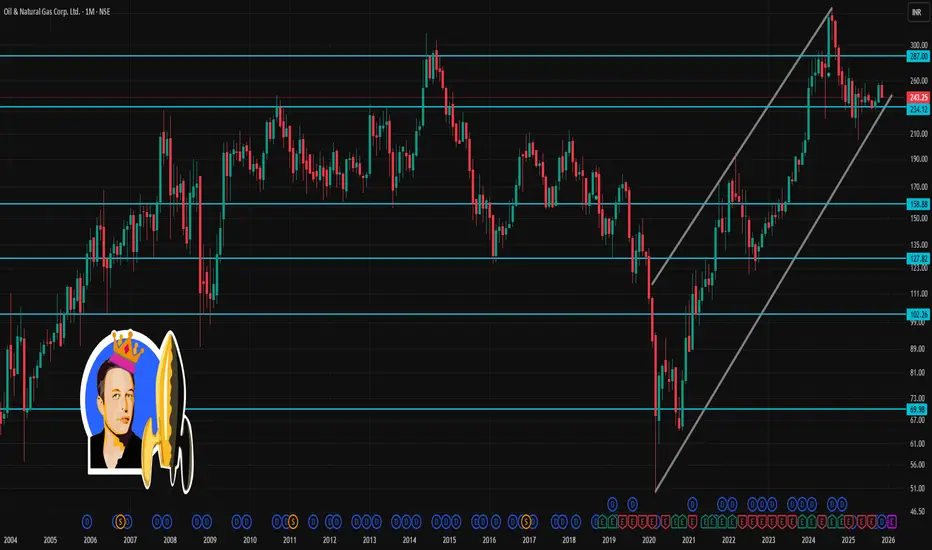
ONGC 1 Month Time Frame 📌 Current snapshot
ONGC last traded around ₹243–₹244.
Over the past month, the stock has dropped ~3–4%.
📈 What could happen in next month
Bearish scenario: If price slips below ₹241 and sentiment (oil prices, global energy demand, investor flows) remains weak — ONGC could test the lower support zone around ₹238–₹240.
Neutral / range-bound: The stock could hover between ₹241–₹251, especially if crude/oil-sector news remains mixed, or broader market is choppy.
Bullish scenario: If ONGC closes above ~₹251 with supportive macro (oil prices, global demand, corporate news) — next leg could push it towards ₹255–₹257 (near-term target).
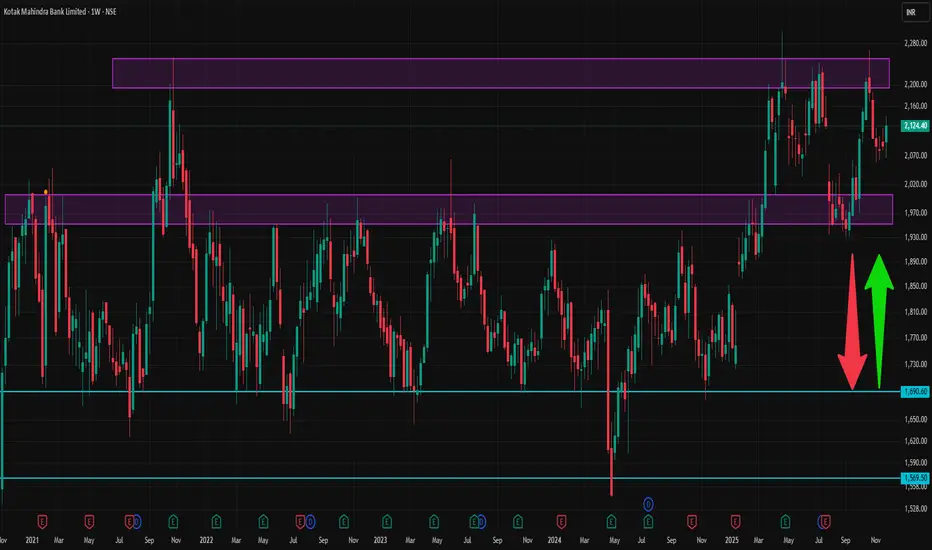
KOTAKBANK 1 Week Time Frame ✅ Current snapshot
Latest share price ≈ ₹ 2,124.40 on NSE/BSE
52-week high ~ ₹ 2,301.90, 52-week low ~ ₹ 1,723.75.
Key fundamentals: P/E ~ 22–23, Book Value ~ ₹ 844, PB ~ 2.5–2.7, dividend yield modest.
⚠️ What could upset the short-term view
Broader market weakness (macro-economic, interest-rate moves, global cues) could drag down banking stocks including Kotak.
Negative corporate/asset-quality news or sector-specific headwinds could hamper even good fundamentals.
Volatility: as with any financial-sector stock, sentiment can swing quickly based on news flow (regulatory announcements, RBI policies, etc.).