Premium Chart AnalysisHow to Trade Chart Patterns
To effectively trade chart patterns, follow these steps:
Identify the Pattern Early
Use clear trendlines to mark support and resistance zones.
Confirm shape and symmetry before assuming a pattern.
Wait for Breakout Confirmation
A breakout should be supported by volume expansion—this validates the move.
Avoid acting before confirmation; false breakouts are common.
Set Entry and Exit Points
Enter after a confirmed breakout (preferably with candle close beyond resistance/support).
Target = Height of pattern projected from breakout point.
Stop-loss = Just below (for bullish) or above (for bearish) the breakout level.
Use Multiple Timeframe Analysis
Confirm pattern on higher timeframes to avoid false signals.
Align short-term setups with long-term trends for stronger conviction.
Chartpatterntrading

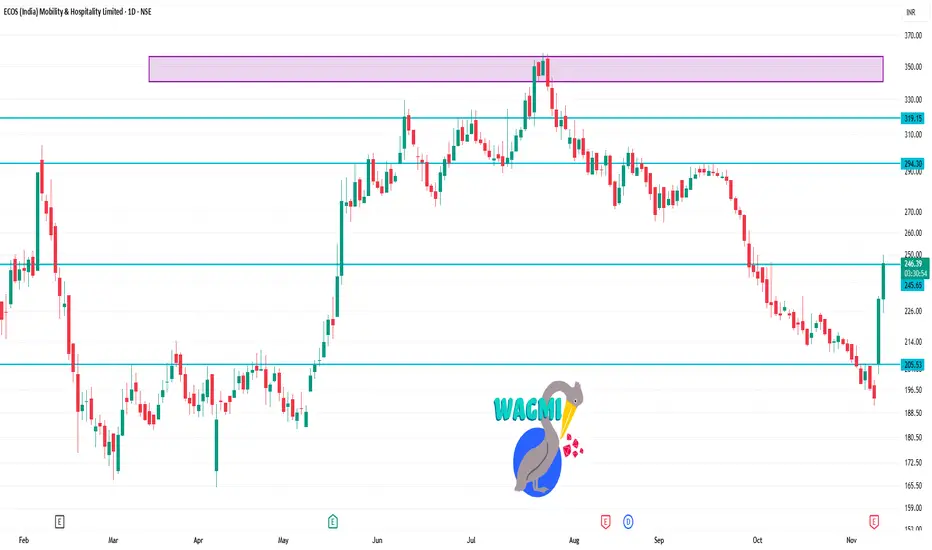
ECOSMOBLTY 1 Day Time Frame Last traded price: ₹ 246.55 (up ~6.69% today)
Day’s range: Low ~ ₹ 225.20, High ~ ₹ 248.50
52-week range: Low ~ ₹ 165.00, High ~ ₹ 361.40
⚠️ Caveats
Technical outlook alone doesn’t account for fundamental news, upcoming earnings, macro factors. For example, their upcoming board meeting/earnings may influence price sharply.
The “oversold” RSI does not guarantee a reversal — especially in a strong downtrend, oversold can persist.
Trading on a 1-day time-frame is riskier (higher volatility, noise) — keep tight risk control.
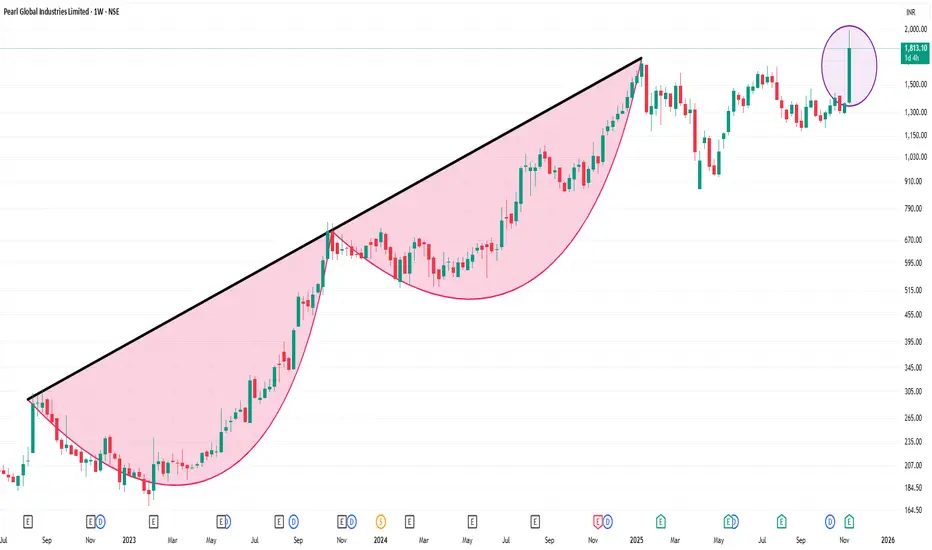
PGIL 1 Week Time Frame 🔍 Key Price Levels
Current price: approx ₹1,813 – ₹1,821 (as of 13 Nov 2025)
52-week high: ~ ₹1,993.30
52-week low: ~ ₹875.00
📉 Support & Resistance Zones (1-Week Outlook)
Resistance zone: The major resistance is near the 52-week high around ₹1,950-₹2,000. Break above that could signal further upside.
Support zone: Near current levels, key support can be around ₹1,500-₹1,600, given the sharp recent run-up. A more robust support lies closer to mid-range around ₹1,300-₹1,400 if the price drops deeper.
Pivot point: Given the strong momentum, the recent breakout region around ₹1,700-₹1,800 can serve as a short‐term pivot; staying above it supports bullish bias, dropping below it cautions pull-back.
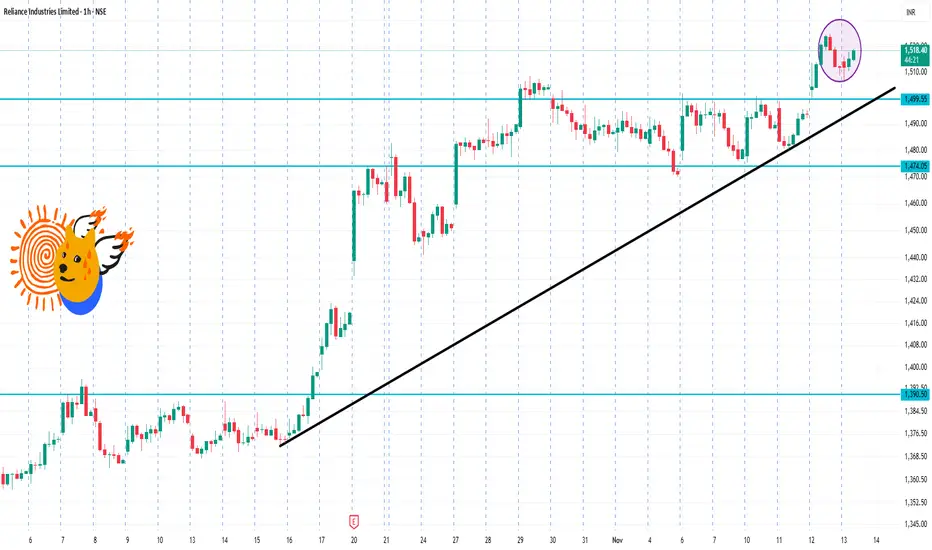
RIL 1 Hour Time Frame🔍 Current basics
Latest traded price: ~ ₹1,518 on NSE.
52-week range: Low ~ ₹1,114.85, High ~ ₹1,551.00.
Technical indicator summary (on 1-hour/higher timeframes) shows a “Strong Buy” bias.
⚠️ Risks / Caveats
Even though the technicals are bullish, the stock is close to its 52-week high (~ ₹1,551). Highs often mean less “room” for upside without some pullback.
Intraday patterns can change quickly with macro news or sector moves (eg: oil & gas, regulatory).
Support at ~₹1,500 is fairly close to current; a break could expose the ₹1,470–₹1,480 region.
Because this is a large-cap and widely held stock, institutional moves and volume matter a lot.
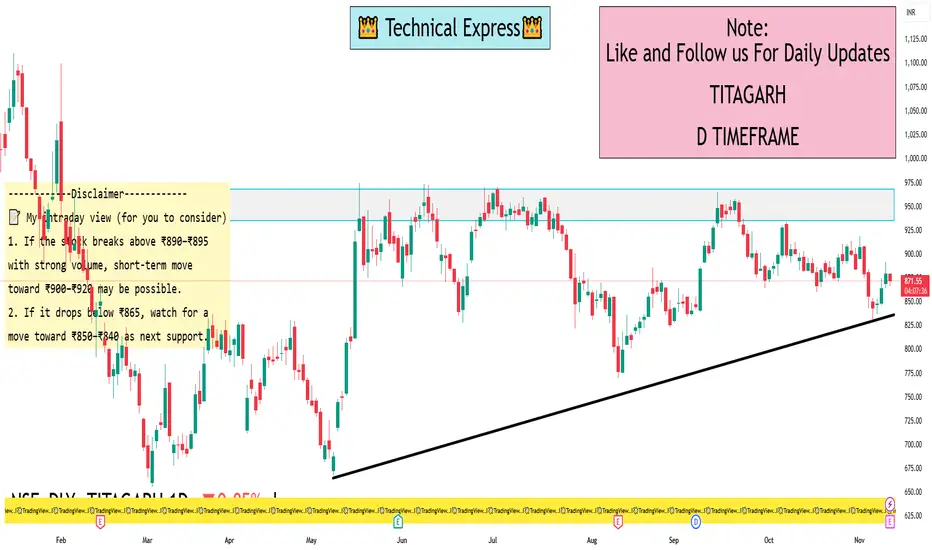
TITAGARH 1 Day Time Frame📊 Price summary
Current price ~ ₹875-₹890 (varies by source).
Day’s range: approx ₹864.10 (low) → ₹891.90 (high).
52-week range: low ~ ₹654.55, high ~ ₹1,370.00.
🔍 Key intraday levels
Support zone: Around ₹860–₹865 (near recent day-low ~₹864).
Immediate resistance: Near day-high ~₹890; breaking above could open towards ₹900+ in short term.
Mid-range pivot: ~₹875-₹880 (current price zone) — watch for consolidation or breakout from here.
If price falls below ~₹860, next support may be toward the lower end of the day’s range (₹850s) and then toward previous lows.
📝 My intraday view (for you to consider)
If the stock breaks above ₹890–₹895 with strong volume, short-term move toward ₹900–₹920 may be possible.
If it drops below ₹865, watch for a move toward ₹850–₹840 as next support.
Stay alert to news/events (order wins, capacity announcements, sector policy) because they can shift momentum quickly.
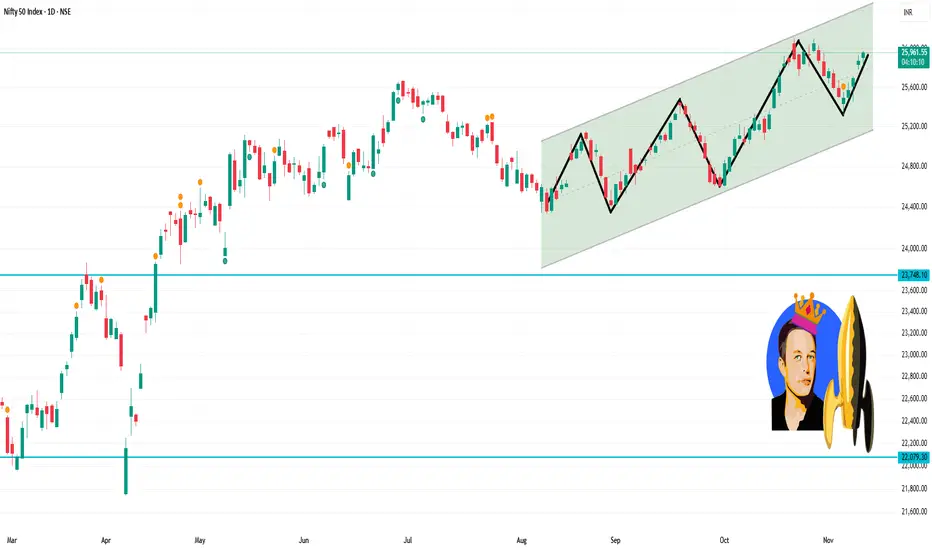
Nifty 50 1 Day Time Frame Current level: ≈ 25,876 INR.
Key resistance zone: ~26,000-26,100 INR.
Immediate support zone: ~25,500-25,600 INR.
📊 Key levels to watch today
Resistance (near-term): ~ 26,000-26,100 – a decisive breakout above this could open further upside.
Support (near-term): ~ 25,500-25,600 – if price falls below this, the structure could weaken.
Intermediate support: ~ 25,300-25,400 as a lower boundary in case of deeper pull-back.
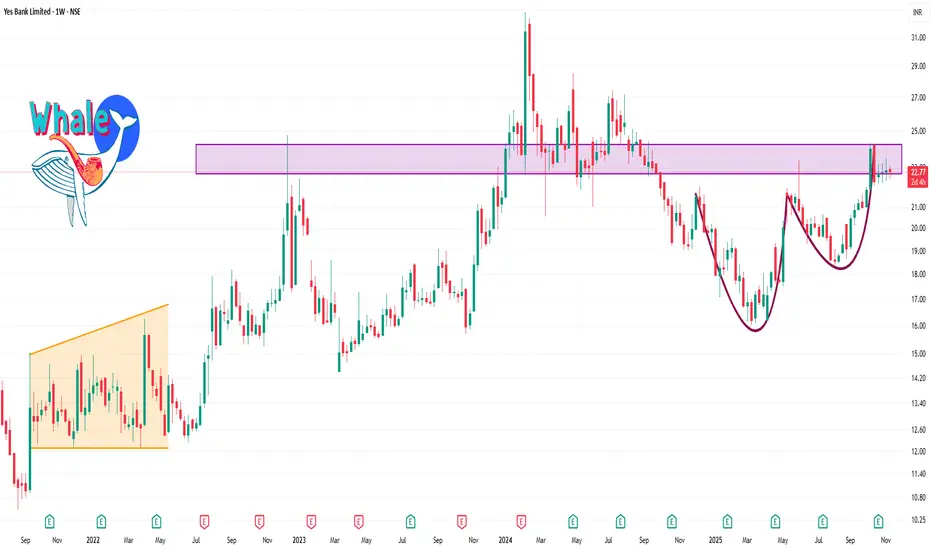
YESBANK 1 Week TIme Frame 📊 Key Technical Levels
Current price: ~ ₹22.70 (approx) per share.
52-week range: Low ~ ₹16.02, High ~ ₹24.30.
Recent support zone: around ₹22.00–₹22.50 appears to be a floor (given recent trades near ₹22.70)
Immediate resistance: near the recent highs ~ ₹24.00-₹24.30
If the price falls, next support might be around ₹20.50–₹21.00, given the lower circuit band was ~ ₹20.36.
✅ Short-term trading scenario
Bullish scenario: Enter (or hold) around ₹22.70 if momentum is positive and target ~₹25 with a stop-loss around ₹21.50.
Bearish scenario: If it breaks down below ~₹22.00 decisively, look for stop-loss trigger and potential target ~₹20.50 or lower.
Risk management is key: Because the price is relatively low and volatility can be higher, ensure stop-loss and position sizing are in line with your risk tolerance.
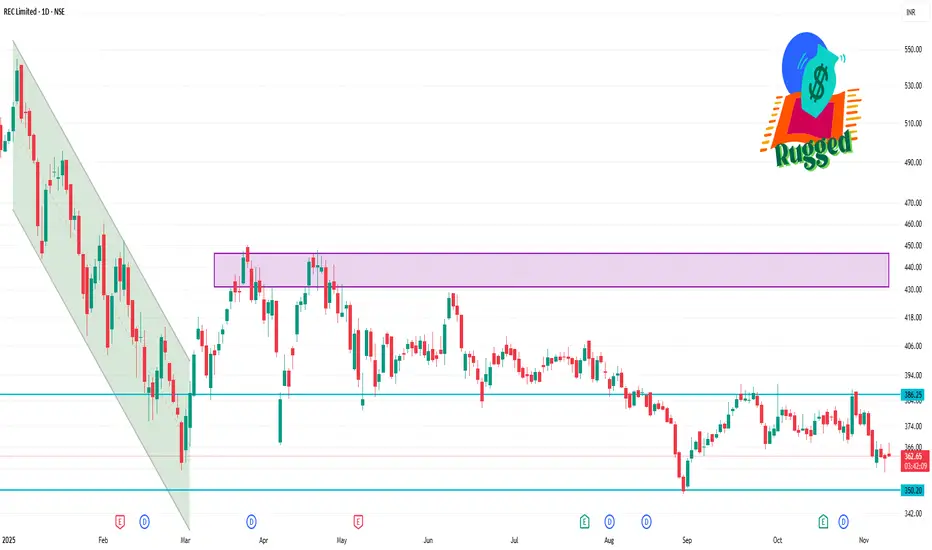
RECLTD 1 Day Time Frame 🎯 Current data
Price: around ₹ 362.05.
52-week high: ~ ₹ 573.30
52-week low: ~ ₹ 348.60
Technical moving averages given by one source:
5-day MA ~ ₹ 366.8
10-day MA ~ ₹ 370
20-day MA ~ ₹ 372.3
Volatility / beta: ~1.8 according to one broker estimate.
⚠️ Risk / caveats
Short-term levels change quickly with news/market sentiment.
Intraday trading adds risks (spread, slippage, volatility).
This is not a recommendation to buy or sell—just a framing of possible levels based on recent technicals.
NATIONAL ALUMINUM ( W ) ROUNDING PATTERN BREAKOUT● Add Your Watchlist ●
📊 Chart to Study For Swing Trading
➡️ STOCK NAME : National Aluminum
▫️Date : 12.11.25
🔸️ Pattern : Rounding Pattern
🔸️Timeframe : Weekly
🔸️Strongly Volume Sathe Brekout
Note : Weekly Candel બંધ નથી થઈ તો બ્રેકઆઉટ જાવળી રાખે તો એંટ્રી કરી શકાય
🔴 Chart is Only For Education Purpose

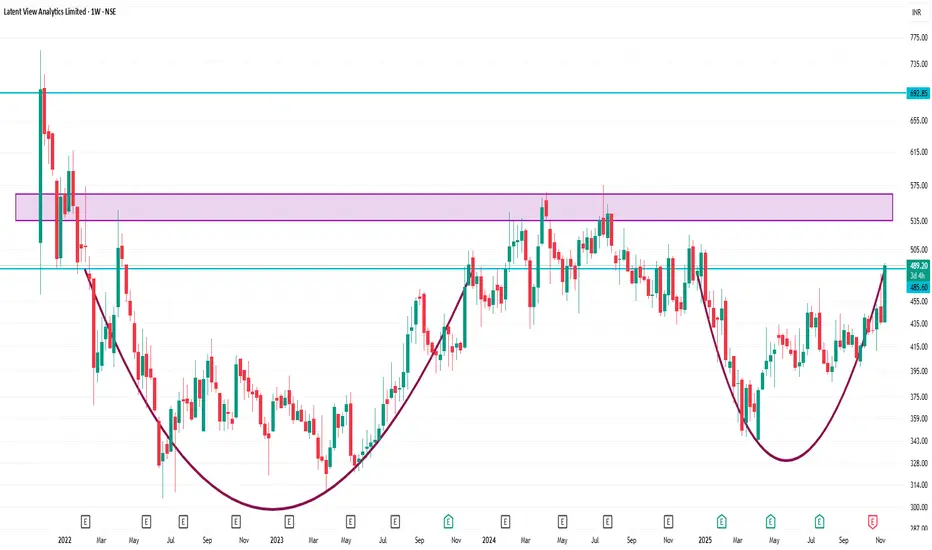
LATENTVIEW 1 Week TIme Frame Latest closing price: ~ ₹ 428.60.
1-week return: approx +0.15%.
Key technical levels per one source:
Support 1: ~ ₹ 423
Support 2: ~ ₹ 410
Support 3: ~ ₹ 386
Pivot point: ~ ₹ 447
Resistance 1: ~ ₹ 460
Resistance 2: ~ ₹ 484
Resistance 3: ~ ₹ 498
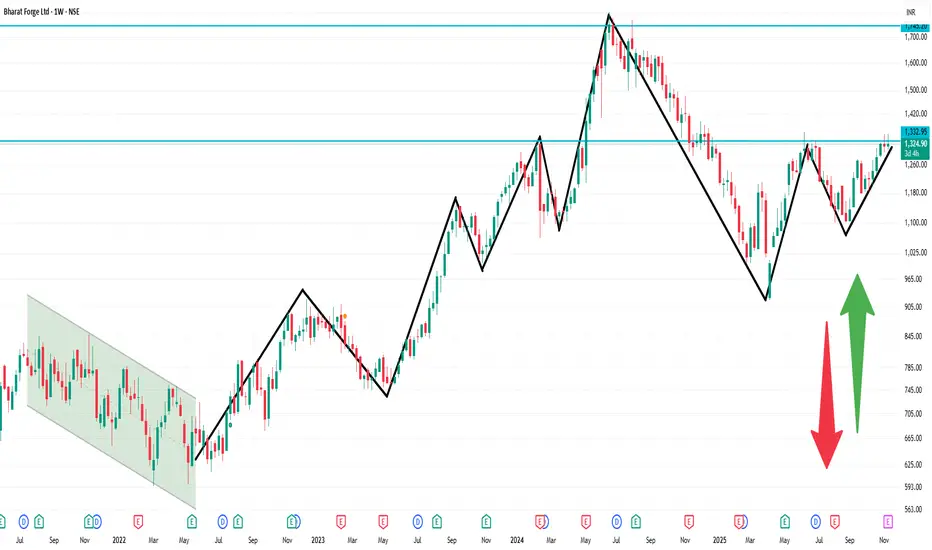
BHARATFORG 1 Week TIme Frame 🔍 Current Snapshot
Latest price approx ₹1,320 (rounded) as per recent quotes.
52-week range: ~₹919 (low) to ~₹1,482 (high).
Valuation: P/E ~60x and P/B ~6–7x.
Key sectors: auto-ancillaries, defence & aerospace.
📉 Key Technical Levels (Short-Term, ~1 Week)
Based on support/resistance and recent trading behaviour, here are levels to watch:
Support: around ₹1,250-1,260. If the price drops and finds buying interest, this is a potential floor zone.
Resistance: near ₹1,350-1,370. If momentum builds, breaking above this could open for further short-term upside.
Watch for range-bound behaviour: If neither major catalyst nor breakdown happens, expect the stock to oscillate between ~₹1,260 and ~₹1,350 in the coming week.
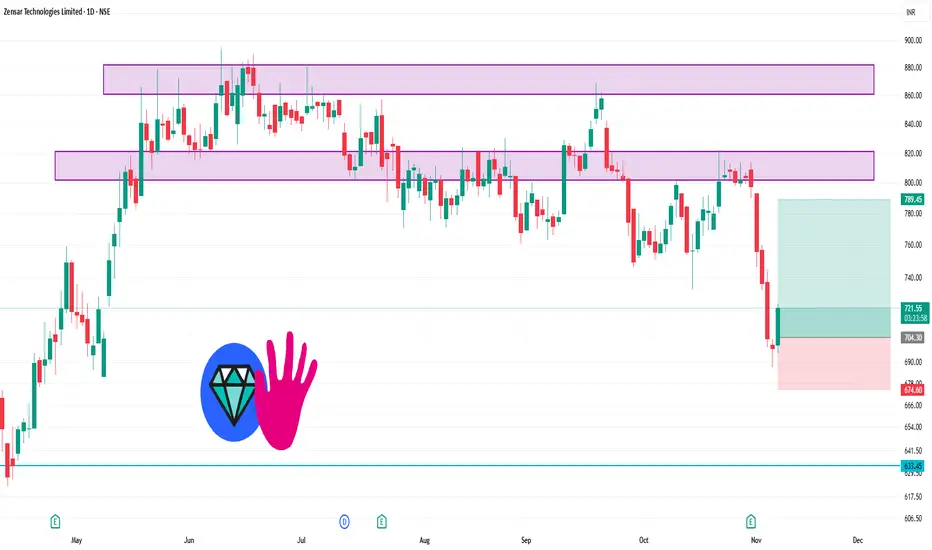
ZENSARTECH 1 Day Time Frame 🎯 Possible Trading Plan (for analysis only)
If bullish: Buy near ₹735–₹740 support with target ₹765 → ₹780 and stop-loss below ₹720.
If breakout: Above ₹780, momentum could extend toward ₹810–₹830 range.
If breakdown: Below ₹720, short-term weakness toward ₹700 possible.
INFY 1 Week Time Frame 🎯 Key Levels
Based on recent chart and analysis sources:
Support zone around ₹ 1,440 – ₹ 1,420.
Resistance zone near ₹ 1,530 – ₹ 1,550.
52-week high ~ ₹ 2,006 and low ~ ₹ 1,307.

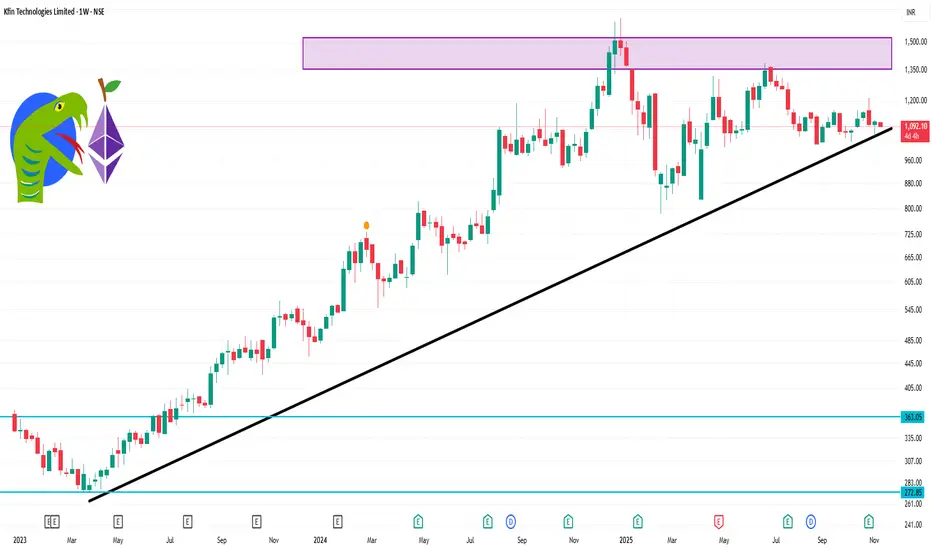
KFINTECH 1 Week Time Frame 🔍 Weekly Structure & Level View
Support zones
Immediate support around ₹1,054-₹1,060 (just under S1).
Deeper support around ₹1,010-₹1,020 (S2 zone).
If broken, next meaningful structural support around ₹930-₹950 (S3).
Also, from Market Screener: mid-term support ~ ₹1,021.20.
Resistance zones
Key pivot resistance around ₹1,134.77.
Short-term upside target / next resistances: ~ ₹1,178-₹1,258.
Medium-term further resistance ~ ~ ₹1,300+ (R3).
From Market Screener: resistance ~ ₹1,174.80 in short term.
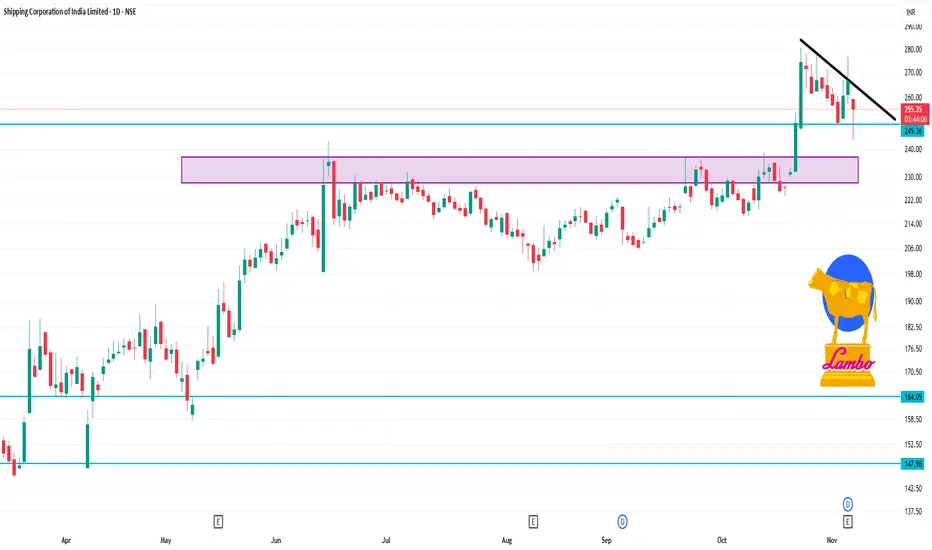
SCI 1 Day Time Frame 🔍 Price Snapshot
Live price around ₹254.20 (as of Nov 10, ~11:14 AM IST).
52-week range: ~ ₹138.26 (low) to ~ ₹280.50 (high).
📊 Key Daily Levels
Using pivot / support-resistance frameworks from sources:
Major Resistance: ~ ₹276-₹286
Primary Support Zone: ~ ₹247-₹256
Secondary Support: ~ ₹237-₹245
Pivot / central zone: ~ ₹266.80 (daily pivot approx)
Silver Triangle BreakoutSilver is attempting breakout forming a ascending triangle pattern on 1h and 4h timeframe. It is also trading above 200ema.

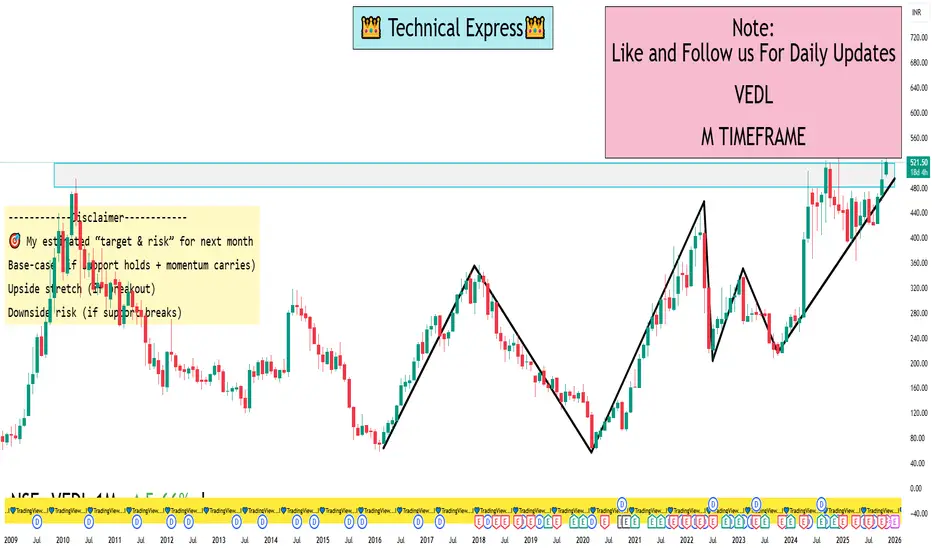
VEDL 1 Month View 📐 Key levels to watch (1-month horizon)
Support zones
Strong near-term support: ~ ₹ 503.
Next support layer: ~ ₹ 490-483 zone.
If broader breakdown: ~ ₹ 451-466 area (per monthly Fibonacci/Support).
Resistance zones
Immediate resistance: ~ ₹ 522-525.
🎯 My estimated “target & risk” for next month
Base-case (if support holds + momentum carries): Upside target ~ ₹ 530-540
Upside stretch (if breakout): ~ ₹ 550 or slightly above (but this requires strong follow-through)
Downside risk (if support breaks): Drop toward ~ ₹ 451-466 zone
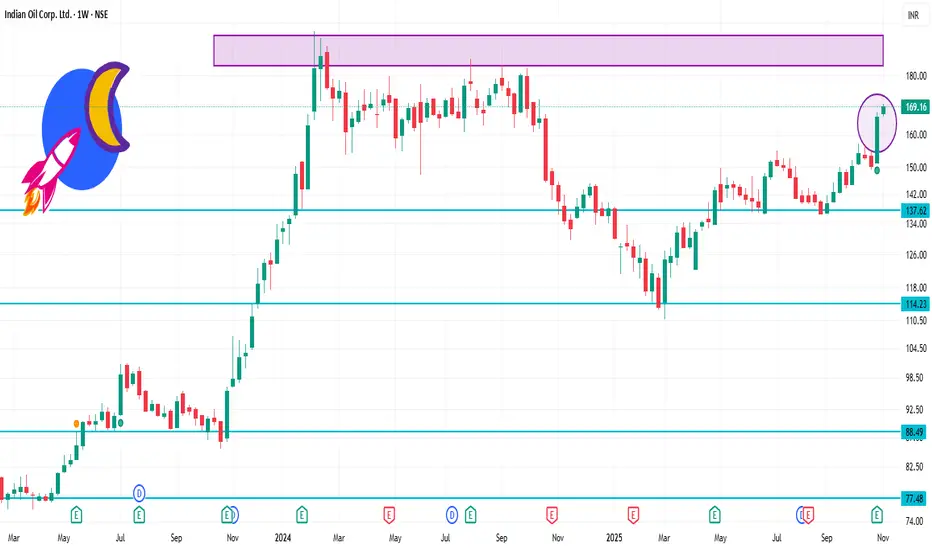
IOC 1 Week Time Frame 📌 Current Price Snapshot
The stock is trading around ₹ 167.97 on the NSE.
One technical commentary shows support in the ₹ 164-166 range, resistance in the ₹ 170-172 range.
✅ My Base-Case for This Week
Given the current price around ₹ 168 and the above levels:
a) The stock may oscillate between ₹ 164 (support) and ₹ 172 (resistance) this week.
b) If it holds above ₹ 166 and crosses above ~₹ 170 with strength, then the ~₹ 172 level is the immediate target.
c) If it fails to hold ~₹ 164, then a pull-back toward ~₹ 160-162 is possible.
Privi Speciality Chemicals Ltd - Breakout Setup, Move is ON...#PRIVISCL trading above Resistance of 3196
Next Resistance is at 4757
Support is at 2166
Here is previous chart:
Chart is self explanatory. Levels of breakout, possible up-moves (where stock may find resistances) and support (close below which, setup will be invalidated) are clearly defined.
Disclaimer: This is for demonstration and educational purpose only. This is not buying or selling recommendations. I am not SEBI registered. Please consult your financial advisor before taking any trade.

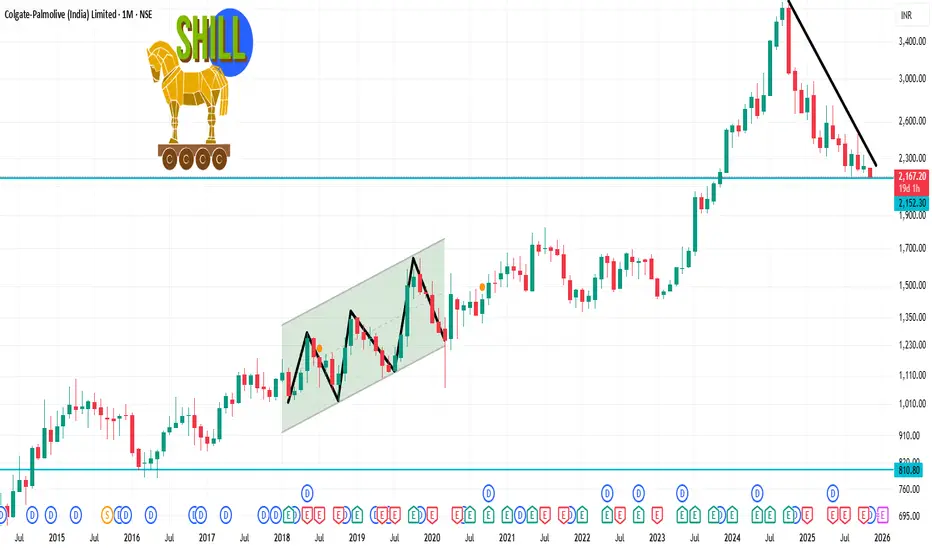
COLPAL 1 Month Time Frame ✅ Key Levels To Watch
Support: ~ ₹2,205, then ~ ₹2,167, and deeper ~ ₹2,041.
Resistance: ~ ₹2,280–₹2,300, then ~ ₹2,317.
Trigger levels: A sustained close above ~ ₹2,300 could signal a shift; a decisive break below ~ ₹2,167 would strengthen the bearish scenario.
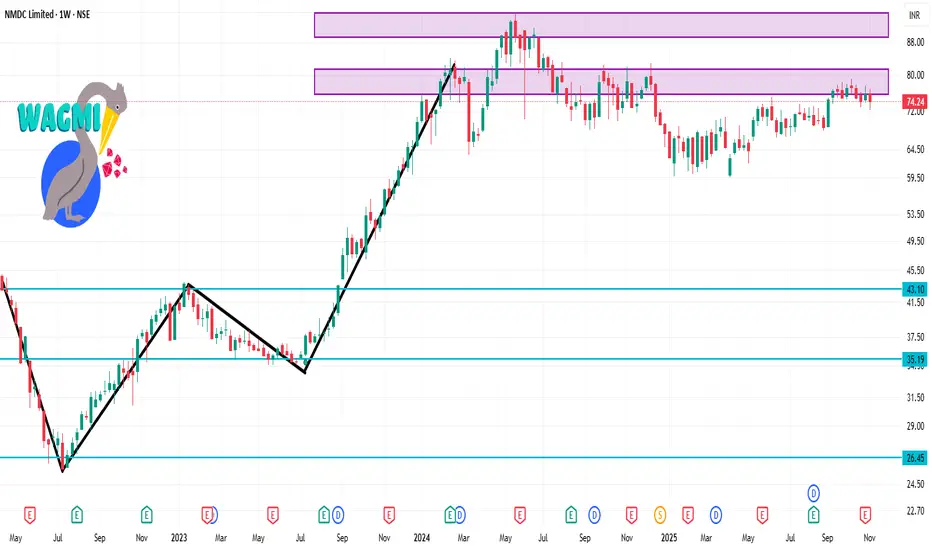
NMDC 1 Week Time Frame 📝 Key levels to watch
Support: ~₹74 region (short term) → if broken → ~₹69.
Resistance: ~₹78-₹79.
Price of interest: Current trading around ~₹74-₹76 (depending on the source)
✅ What the technicals are saying
a) According to one source, NMDC has a “Strong Buy” rating on daily indicators: RSI ~55, MACD positive, 5-day MA above price, 50-day MA above price — all suggesting bullish bias.
b) Another set of technicals (via Moving Averages & Oscillators) shows a Bearish bias: MACD negative, RSI ~38, SMA(20/50/200) all above current price indicating downward pressure.
c) Support / resistance levels from Charts: Short-term support around ₹74.19, intermediate support near ₹69.44, major support around ₹61.87. Resistance around ₹78.80 to ~₹79.58.
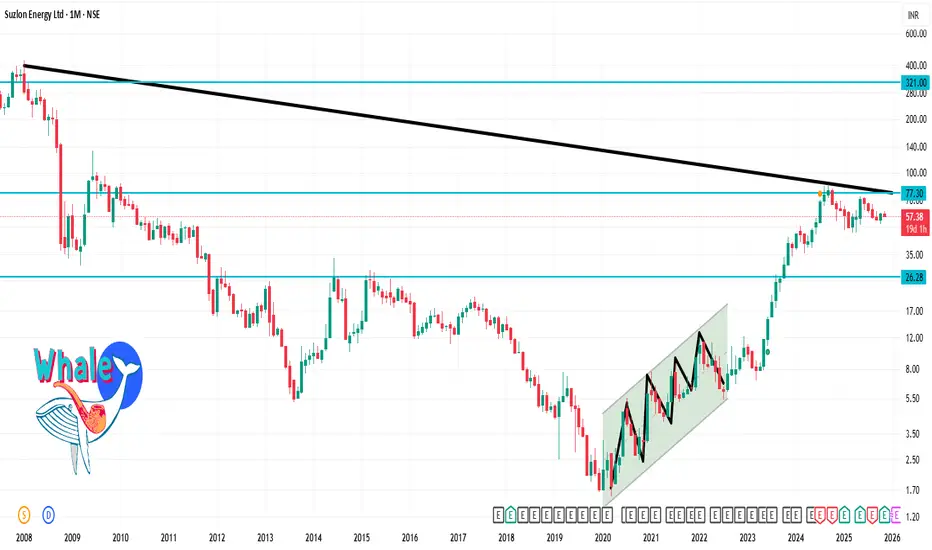
SUZLON 1 Month Time Frame ✅ Current Price & Context
The stock is trading around ₹ 57.38 on the NSE.
Technical indicators give a mixed but mildly positive bias: Many moving averages show “Buy” signals aside from some longer-term averages.
On a charting site, for short term the support is about ₹ 52.67 and resistance about ₹ 60.40.
🔍 One-Month Timeframe Levels
Here are suggested levels to watch for the next ~4-5 weeks:
Support level: around ₹ 52-53
Resistance level: around ₹ 60-61 (or slightly above)
Intermediate pivot / near‐term area: around ₹ 56-58
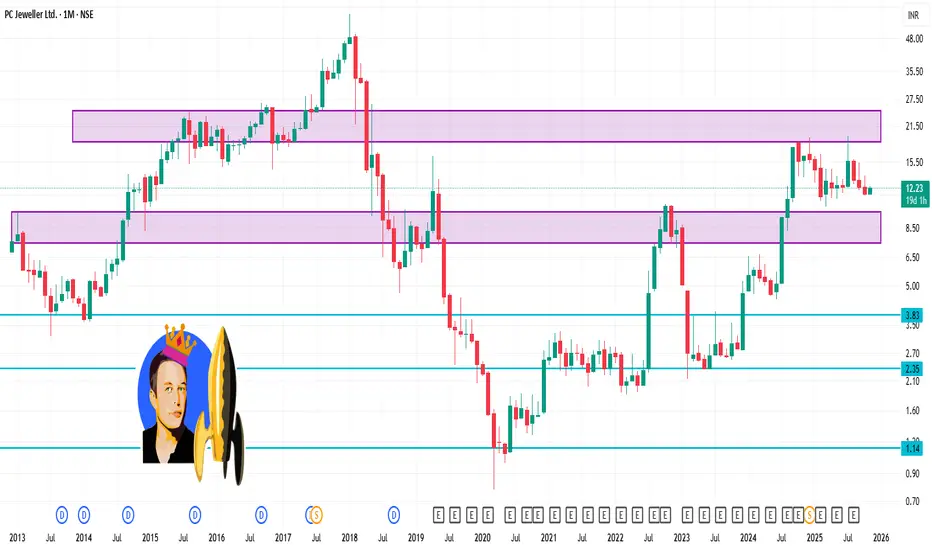
PCJEWELLER 1 Month Time Frame 📊 Current snapshot
Last quoted price: ~ ₹12.23 on 7 Nov 2025.
52-week high / low: ~ ₹19.65 / ₹10.28.
Key moving averages (approx):
20-day MA ~ ₹12.13
50-day MA ~ ₹12.68
100-day MA ~ ₹13.12
200-day MA ~ ₹13.06