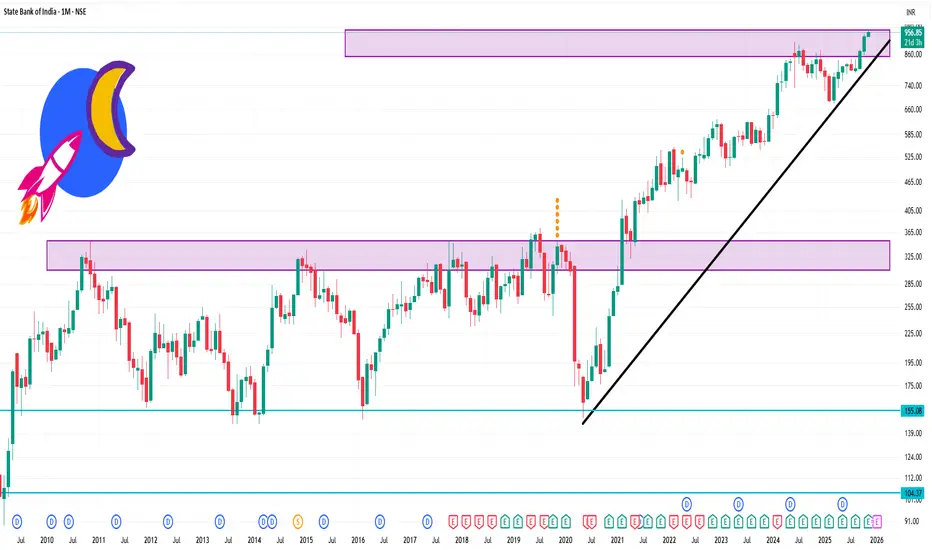
SBIN 1 Month Time Frame Level🔍 Key Levels for 1‑Month Timeframe
Support Zones
Around ₹ 946‑953: Daily pivot/resistance turned support zone.
Next support near ₹ 935‑943: If the price drops below the first zone, this becomes the next demand area.
Broader support around ₹ 900‑910: From longer‑term moving averages and structural support. (MA200 ~₹ 896 per indicator).
Resistance / Upside Zones
Immediate resistance around ₹ 969‑972: Close to the 52‑week high and recent highs.
If momentum carries, potential extension to ₹ 1000+ zone. Some fib‑/pivot‑based projections suggest ~₹ 1003.
Chartpatterntrading
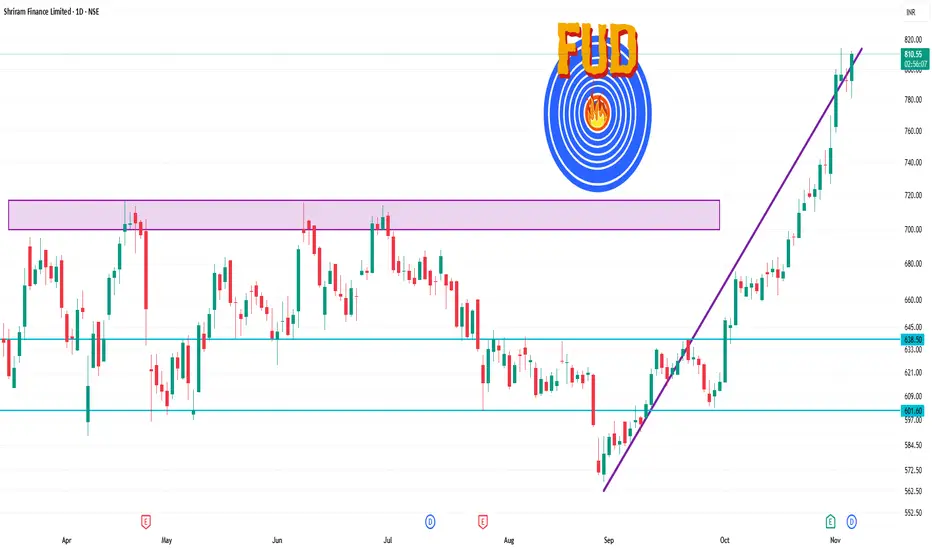
SHRIRAMFIN 1 Day Time Frame 🧮 Current Price Context
Latest available close: ~ ₹796.50.
Recent high of the day: ~ ₹814.15.
52‑week high: ~ ₹814.15 and 52‑week low: ~ ₹493.35.
📌 Key Levels to Watch
Based on recent pivot‑/support/resistance calculations:
Important resistance zone: ~ ₹808‑₹815 (pivot R2/R3 cluster)
Primary pivot/mid‑level: ~ ₹792.70 (central pivot)
Support zones:
First support: ~ ₹775‑₹780
Deeper support: ~ ₹712‑₹720
Stronger structural support: ~ ₹677‑₹680 and then ~ ₹626‑₹630 further down.
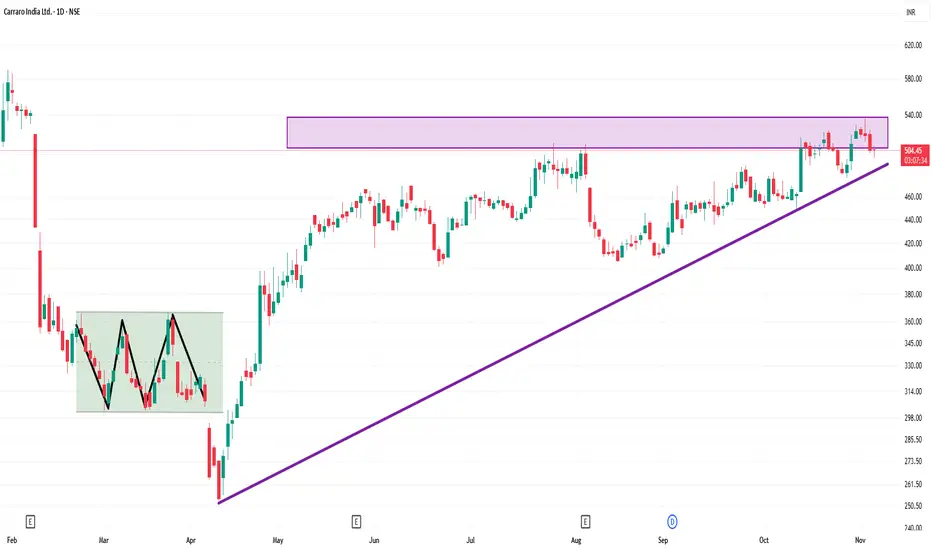
CARRARO 1 Day Time Frame 📍 Key Levels
Resistance ~ ₹523.45 (short term)
Support ~ ₹482.70
Moving averages: 50-day ~ ₹503.79; 200-day ~ ₹484.68
Current price (recent) ~ ₹518.75
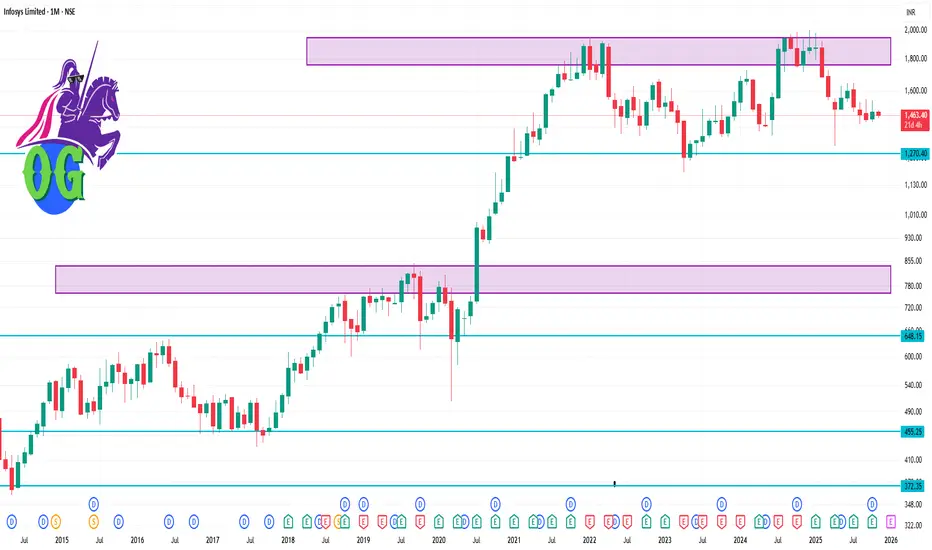
INFY 1 Month Time Frame 📊 Current status
Latest quoted price is around ₹1,466.70.
Technical indicators (daily & monthly) show a bearish bias. On daily, moving averages all give “Sell”.
From chart commentary: Intermediate resistance visible at ~ ₹1,479–₹1,523. Support stated around ~ ₹1,425–₹1,385, and a stronger support zone near ~ ₹1,348 in a deeper break scenario.
🎯 Key levels for the 1-month horizon
Resistance zone: ~ ₹1,479 up to ~ ₹1,523 — clearing this zone would be a positive signal. (see analysis above)
Support zone / trigger zone:
Initial support: ~ ₹1,425–₹1,385.
Deeper support (if breakdown): ~ ₹1,348.
Important pivot region: The current price around ~ ₹1,466–₹1,470 sits between support and resistance — watching whether it breaks down or starts a reversal.
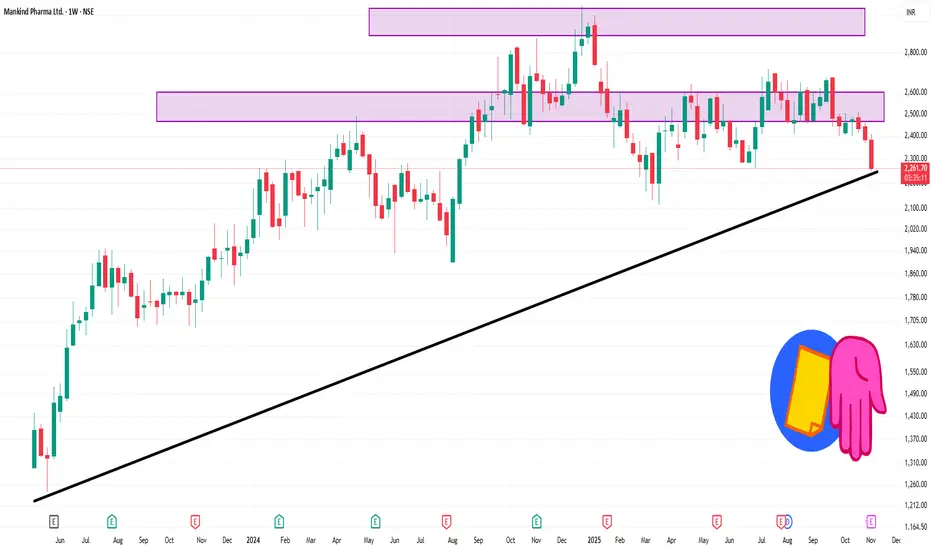
MANKIND 1 Week Time Frame 📌 Key Levels (Weekly Framework)
Support zone: ~ ₹2,287 (a strong weekly support identified)
Next lower support: ~ ₹2,201 (in case of breakdown below primary support)
Resistance zone: ~ ₹2,518 (first major weekly resistance)
Higher resistance area: ~ ₹2,696 to ₹2,937 in a medium‐term context.
🔍 Weekly Outlook & Notes
If price remains above ~₹2,287 and starts building volume/structure, there is upside potential toward ~₹2,518.
If the price breaks below ~₹2,287 decisively on the weekly chart, then watch for further drop toward ~₹2,201.
RADICO 1 Month Time Frame 📌 Current data snapshot
Latest price ~ ₹ 3,220.
52-week range: ~ ₹ 1,845.50 – ₹ 3,423.00.
Technical rating (1-month) on platforms shows “Buy” / “Strong Buy”.
🔍 Key support & resistance for ~1-month horizon
Support zone: ~ ₹ 3,050-3,100 — around current price minus some buffer.
Stronger support: ~ ₹ 2,900-3,000 — if the above zone fails.
Resistance zone: ~ ₹ 3,300-3,350 — near recent highs.
Possible breakout target: > ~ ₹ 3,400 — if it breaks resistance convincingly.
These levels are derived from recent chart data and pivot-analysis (for example, support ~₹3,052.5 seen on one chart).

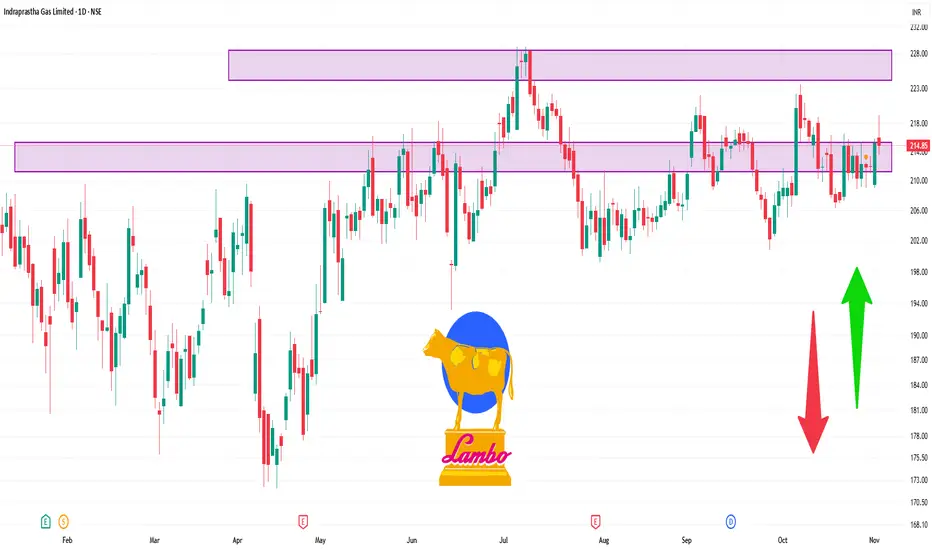
IGL 1 Day Time Frame 🔍 Current Price
Latest quoted price is ~ ₹ 212.33.
Previous close ~ ₹ 211.16.
The stock is trading above its 50-day, 100-day & 200-day moving averages (e.g., ~₹ 212.92 for 50-day) which suggests the medium-term trend remains intact.
📏 Key Pivot / Support & Resistance Levels (Daily)
Based on recent technical data the following levels are of interest:
Pivot / central range
Daily pivot point (approx): ~ ₹ 213.32.
Another source gives pivot ~ ₹ 211.14.
Support levels
Support 1 (S1): ~ ₹ 209.79 – ₹ 210.00.
Support 2 (S2): ~ ₹ 207.64.
Support 3 (S3): ~ ₹ 206.29.
Resistance levels
Resistance 1 (R1): ~ ₹ 213.29 – ₹ 213.50.
Resistance 2 (R2): ~ ₹ 214.64 – ₹ 215.00.
Resistance 3 (R3): ~ ₹ 216.79.
TITAN 1 Day TIme Frame 🎯 Key Levels
From sources:
Daily pivot (classic) ~ ₹3,756.40 based on previous day’s range.
Daily resistance levels: ~ ₹3,773.30, ~ ₹3,799.90, ~ ₹3,816.80.
Daily support levels: ~ ₹3,729.80, ~ ₹3,712.90, ~ ₹3,686.30.
From another source: support ~ ₹3,566, long-term support ~ ₹3,327; resistance ~ ₹3,772-3,814.

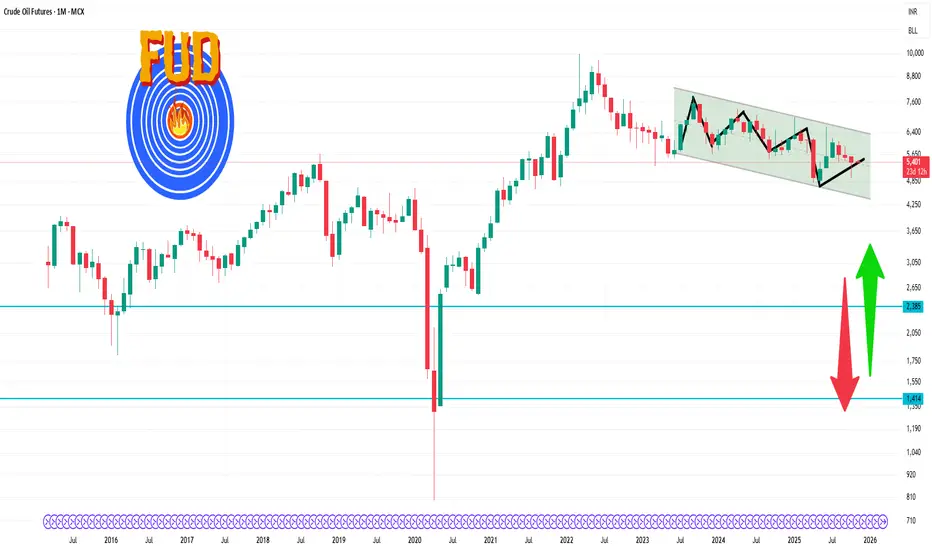
Crude Oil Futures 1 Month Time Frame 🔍 Current Price
Last quoted: ~ ₹ 5,422 per barrel.
Recent 1-month high: ~ ₹ 5,903
Recent 1-month low: ~ ₹ 4,944
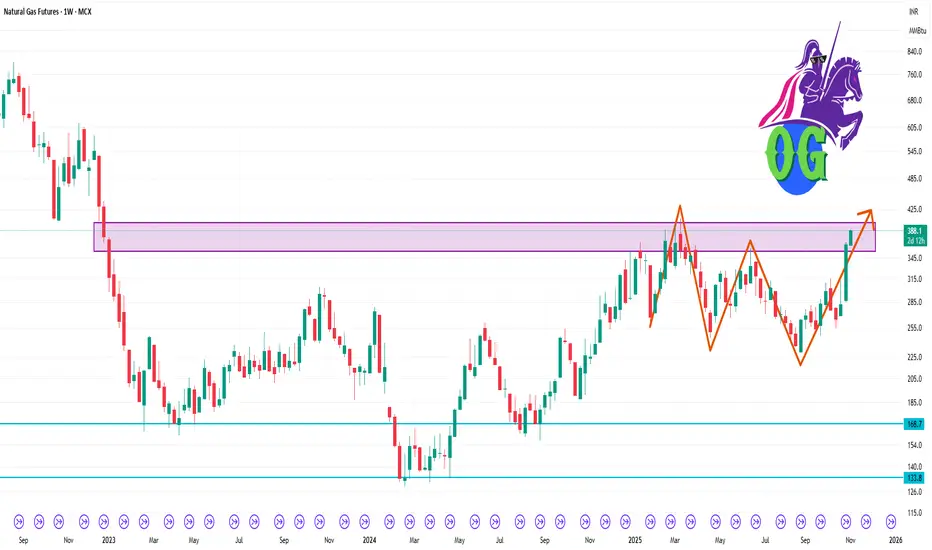
Natural Gas Futures 1 Week Time Frame 🎯 Key Levels
Support zone: ~ ₹ 270-285 per mmBtu — this appears to be a hinge demand zone based on recent pullbacks.
Intermediate support / pivot: ~ ₹ 295-310 — price has been oscillating near this zone.
Resistance zone: ~ ₹ 330-350 — breaking above this on a weekly close would shift structure more bullish.
Major breakout target: ~ ₹ 360-380 — if momentum carries, this zone becomes relevant for extension.
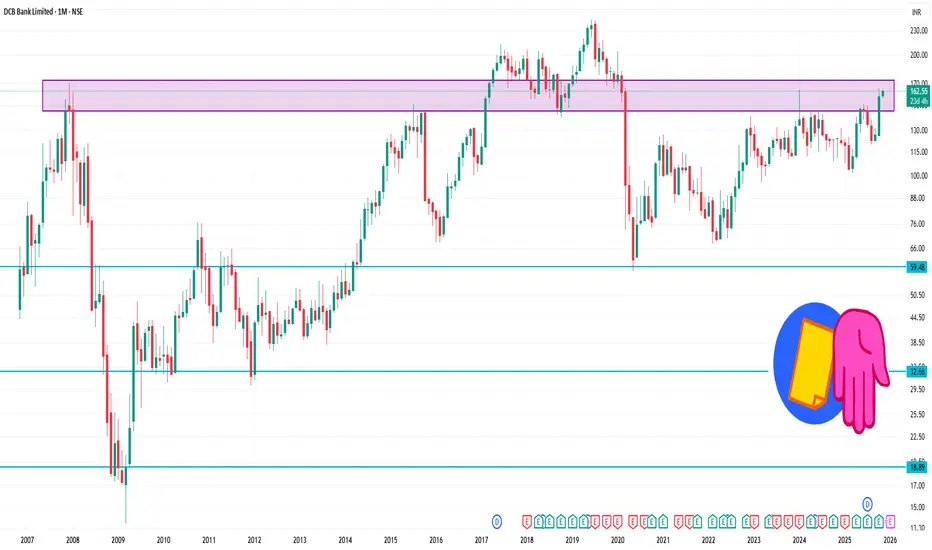
DCBBANK 1 Month Time Frame 🔑 Key Levels
Resistance zone: ~ ₹159–₹162. According to pivot/accumulated-volume data, the stock meets resistance around ₹158–₹161.
Support zone: ~ ₹144–₹150. The analysis mentions support at ~₹144.55 and next level further down ~₹126.45 if that breaks.
Longer-term support: ~ ₹129–₹135. Some medium/long‐term support levels are indicated in this range.
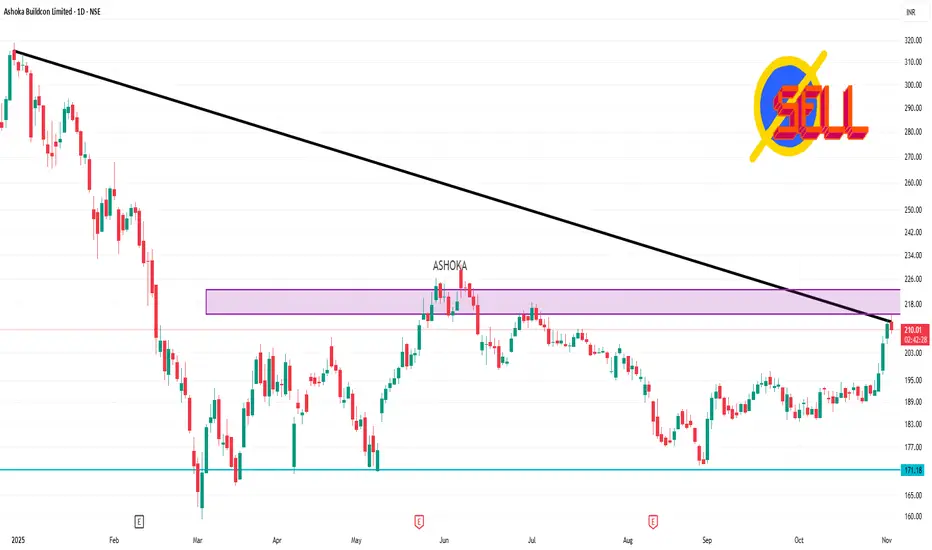
ASHOKA 1 Day Time Frame 📊 Current Context
Latest quoted price: ~ ₹214.86.
Daily technical/oscillator readings: RSI (14) ~ 73.64 → bullish but nearing over-bought territory.
Moving-averages: 5-day ~ ₹199.49; 20-day ~ ₹192.38; 50-day ~ ₹189.35. Price is above all these, which suggests upward momentum.
🎯 Key Levels to Watch (Daily)
From the latest data:
Pivot (classic): ~ ₹210.16.
Resistance levels:
R1 ~ ₹214.66
R2 ~ ₹221.42
Support levels:
S1 ~ ₹203.40
S2 ~ ₹198.90
S3 ~ ₹192.14
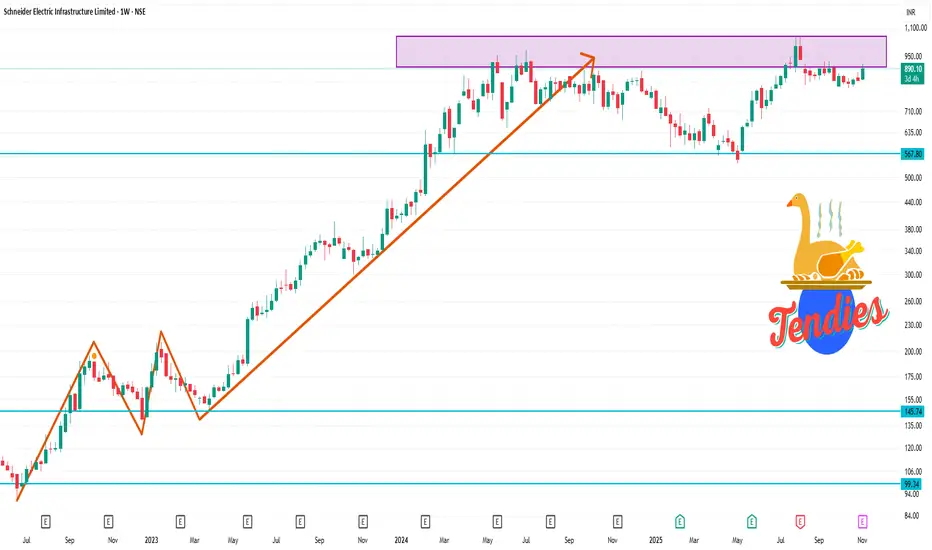
SCHNEIDER 1 Week Time Frame 📊 Current status
Last traded price: ~ ₹863 (shown on technical summary)
Technical rating (weekly timeframe): “Neutral” in many sources.
On shorter timeframes (daily), many indicators show bullish momentum.
🧮 Key support & resistance levels for the week
Based on available chart-analysis:
Support zone: around ₹810-₹830 region.
Resistance zone: around ₹900-₹915 region.
A pivot/resistance level near ~ ₹867-₹870 was noted for shorter term.
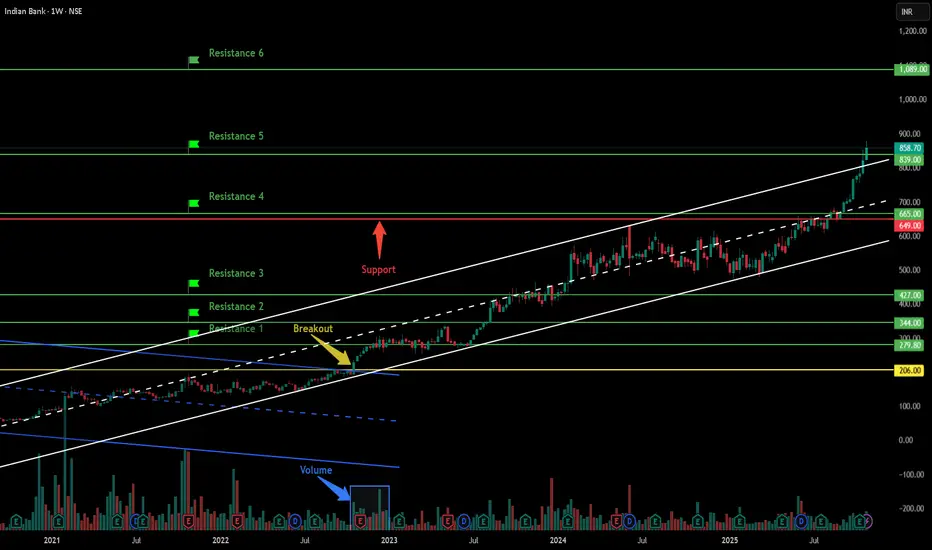
Indian Bank - Breakout Setup, Move is ON...#INDIANB trading above Resistance of 839
Next Resistance is at 1089
Support is at 649
Here are previous charts:
Chart is self explanatory. Levels of breakout, possible up-moves (where stock may find resistances) and support (close below which, setup will be invalidated) are clearly defined.
Disclaimer: This is for demonstration and educational purpose only. This is not buying or selling recommendations. I am not SEBI registered. Please consult your financial advisor before taking any trade.
CANARA BANK BREAKOUTCANARA BANK
ADD ON YOUR WATCHLIST
If you see in the chart, the rounding pattern has broken out and it is in the weekly time frame
You can buy at Rs 125 and go up to the target of 146 and 163. The Stop-loss can be kept at 117.50
Note: Our posts are posted for learning purposes. You are responsible for any profit or loss you make from the advice given in the channel. Before investing in the stock market, you must consult your financial advisor.
WE ARE NOT A SEBI REGISTERED

MRPL Triangle BreakoutMRPL has given a Breakout after forming a Triangle Pattern on 1D timeframe with very high volumes. The stock is also trading above its 200EMA.

Stallion India Fluorochemicals Ltd - Breakout Setup, Move is ON#STALLION trading above Resistance of 312
Next Resistance is at 524
Support is at 204
Here are previous charts:
Chart is self explanatory. Levels of breakout, possible up-moves (where stock may find resistances) and support (close below which, setup will be invalidated) are clearly defined.
Disclaimer: This is for demonstration and educational purpose only. This is not buying or selling recommendations. I am not SEBI registered. Please consult your financial advisor before taking any trade.

Stallion India Fluorochemicals Ltd - Breakout Setup, Move is ON#STALLION trading above Resistance of 171
Next Resistance is at 312
Support is at 133
Here is previous chart:
Chart is self explanatory. Levels of breakout, possible up-moves (where stock may find resistances) and support (close below which, setup will be invalidated) are clearly defined.
Disclaimer: This is for demonstration and educational purpose only. This is not buying or selling recommendations. I am not SEBI registered. Please consult your financial advisor before taking any trade.

Le Travenues Technology Ltd - Breakout Setup, Move is ON...#IXIGO trading above Resistance of 327
Next Resistance is at 460
Support is at 249
Here is previous chart:
Chart is self explanatory. Levels of breakout, possible up-moves (where stock may find resistances) and support (close below which, setup will be invalidated) are clearly defined.
Disclaimer: This is for demonstration and educational purpose only. This is not buying or selling recommendations. I am not SEBI registered. Please consult your financial advisor before taking any trade.

Inox Green Energy Services Ltd - Breakout Setup, Move is ON...#INOXGREEN trading above Resistance of 245
Next Resistance is at 363
Support is at 143
Here are previous charts:
Chart is self explanatory. Levels of breakout, possible up-moves (where stock may find resistances) and support (close below which, setup will be invalidated) are clearly defined.
Disclaimer: This is for demonstration and educational purpose only. This is not buying or selling recommendations. I am not SEBI registered. Please consult your financial advisor before taking any trade.

Inox Green Energy Services Ltd - Breakout Setup, Move is ON...#INOXGREEN trading above Resistance of 160
Next Resistance is at 245
Support is at 99
Here are previous charts:
Chart is self explanatory. Levels of breakout, possible up-moves (where stock may find resistances) and support (close below which, setup will be invalidated) are clearly defined.
Disclaimer: This is for demonstration and educational purpose only. This is not buying or selling recommendations. I am not SEBI registered. Please consult your financial advisor before taking any trade.

Technical Analysis and Chart PatternsIntroduction to Technical Analysis
Technical Analysis (TA) is the study of historical price and volume data to forecast future price movements in financial markets. Unlike fundamental analysis, which focuses on the intrinsic value of an asset, technical analysis relies on patterns, trends, and statistical indicators to identify trading opportunities. It is widely used across equity, forex, commodities, and cryptocurrency markets by traders of all timeframes, from intraday scalpers to long-term investors.
The foundation of technical analysis rests on three main assumptions:
Market Action Discounts Everything: All information, whether public or private, is already reflected in the current price of an asset.
Prices Move in Trends: Markets follow trends rather than random movement, and identifying these trends can help traders profit.
History Tends to Repeat Itself: Human psychology drives market behavior, and patterns formed in the past tend to recur under similar conditions.
1. Key Principles of Technical Analysis
Trend Analysis
Uptrend: Characterized by higher highs and higher lows. Indicates bullish sentiment.
Downtrend: Characterized by lower highs and lower lows. Indicates bearish sentiment.
Sideways/Range-bound Trend: Occurs when prices move horizontally, often leading to breakout opportunities.
Support and Resistance Levels
Support: A price level where demand is strong enough to prevent further decline. Often a buying opportunity.
Resistance: A price level where selling pressure prevents further rise. Often a selling opportunity.
Breakouts and Breakdowns: Breaching these levels can signal the start of new trends.
Volume Analysis
Volume reflects the intensity of a price movement.
Rising prices with increasing volume confirm trends, whereas divergences (e.g., rising price with falling volume) indicate potential reversals.
Momentum Indicators
Measure the speed and strength of price movements.
Examples: Relative Strength Index (RSI), Moving Average Convergence Divergence (MACD), Stochastic Oscillator.
Moving Averages
Smooth out price fluctuations to identify trends.
Common types: Simple Moving Average (SMA), Exponential Moving Average (EMA).
Crossovers (e.g., 50-day SMA crossing 200-day SMA) are key trading signals.
2. Chart Types
Understanding chart types is crucial for recognizing patterns:
Line Charts
Simple representation connecting closing prices.
Useful for identifying long-term trends but lacks intraday information.
Bar Charts
Displays open, high, low, and close (OHLC) for each period.
Provides more detailed insight into market sentiment.
Candlestick Charts
Originated in Japan; visually appealing and widely used.
Each candlestick shows open, high, low, and close, forming recognizable patterns that signal market direction.
Point and Figure Charts
Ignores time; focuses solely on price changes.
Useful for identifying strong trends and breakout points.
3. Chart Patterns
Chart patterns are visual representations of market psychology, helping traders anticipate future price action. They can be broadly categorized into reversal and continuation patterns.
3.1 Reversal Patterns
Reversal patterns indicate a potential change in trend.
Head and Shoulders
Signifies a trend reversal from bullish to bearish.
Features a left shoulder, a head (higher peak), and a right shoulder.
The neckline is the support level; breaking it confirms the trend reversal.
Inverse Head and Shoulders
Opposite of the standard head and shoulders.
Signals reversal from bearish to bullish.
Double Top
Occurs after an uptrend; two peaks at roughly the same level.
Breaking the support level between the peaks signals a downtrend.
Double Bottom
Occurs after a downtrend; two troughs at a similar level.
Breaking the resistance confirms a bullish reversal.
Triple Top/Bottom
Less common but more reliable than double tops or bottoms.
Indicates stronger resistance or support levels.
3.2 Continuation Patterns
Continuation patterns suggest that the existing trend is likely to continue.
Triangles
Ascending Triangle: Bullish; flat resistance and rising support. Breakout likely upwards.
Descending Triangle: Bearish; flat support and descending resistance. Breakout likely downwards.
Symmetrical Triangle: Neutral; breakout direction depends on the preceding trend.
Flags and Pennants
Short-term consolidation patterns after strong moves.
Flags: Rectangular consolidation; pennants: small symmetrical triangles.
Typically continue in the direction of the previous trend.
Rectangles (Trading Ranges)
Horizontal consolidation between support and resistance.
Breakout indicates trend continuation.
3.3 Candlestick Patterns
Candlestick patterns provide detailed insight into market sentiment:
Single Candlestick Patterns
Doji: Indicates indecision; potential reversal if appearing after a strong trend.
Hammer/Inverted Hammer: Bullish reversal after a downtrend.
Shooting Star: Bearish reversal after an uptrend.
Multiple Candlestick Patterns
Engulfing Pattern: Bullish or bearish reversal depending on candle alignment.
Morning Star/Evening Star: Signals trend reversal.
Three White Soldiers/Three Black Crows: Strong trend continuation patterns.
4. Indicators and Oscillators
Technical analysis often combines chart patterns with indicators:
Trend Indicators
Moving Averages, MACD, ADX (Average Directional Index)
Momentum Indicators
RSI, Stochastic Oscillator, Rate of Change (ROC)
Volatility Indicators
Bollinger Bands, Average True Range (ATR)
Volume Indicators
On-Balance Volume (OBV), Chaikin Money Flow (CMF)
5. Technical Analysis in Trading Strategy
Technical analysis is integrated into different trading strategies:
Day Trading
Focuses on intraday price movements using candlestick patterns and intraday indicators.
Swing Trading
Capitalizes on short to medium-term trends using support/resistance and chart patterns.
Position Trading
Long-term trend following; relies on moving averages, trendlines, and breakout patterns.
Algorithmic Trading
Combines TA rules with automated systems for high-frequency trading.
6. Advantages of Technical Analysis
Quick decision-making due to focus on charts and indicators.
Applicable across different asset classes and timeframes.
Helps identify entry and exit points with greater precision.
7. Limitations of Technical Analysis
Reliance on historical data; past performance doesn’t guarantee future results.
Can produce false signals in highly volatile or low-volume markets.
Requires experience and discipline to interpret patterns accurately.
8. Combining Technical Analysis with Other Tools
Many traders combine TA with fundamental analysis to improve accuracy.
Sentiment analysis, news events, and macroeconomic data can enhance decision-making.
Risk management is essential: stop-loss, position sizing, and portfolio diversification mitigate losses.
Conclusion
Technical analysis and chart patterns provide traders with a structured way to interpret market behavior. While no method guarantees success, mastery of TA enables traders to identify high-probability setups, manage risk, and make informed decisions. With the right combination of pattern recognition, indicator use, and disciplined execution, technical analysis can be a powerful tool in the trader’s arsenal.
By understanding trends, patterns, support/resistance levels, and combining them with indicators and sound risk management, traders can navigate financial markets with greater confidence and precision.
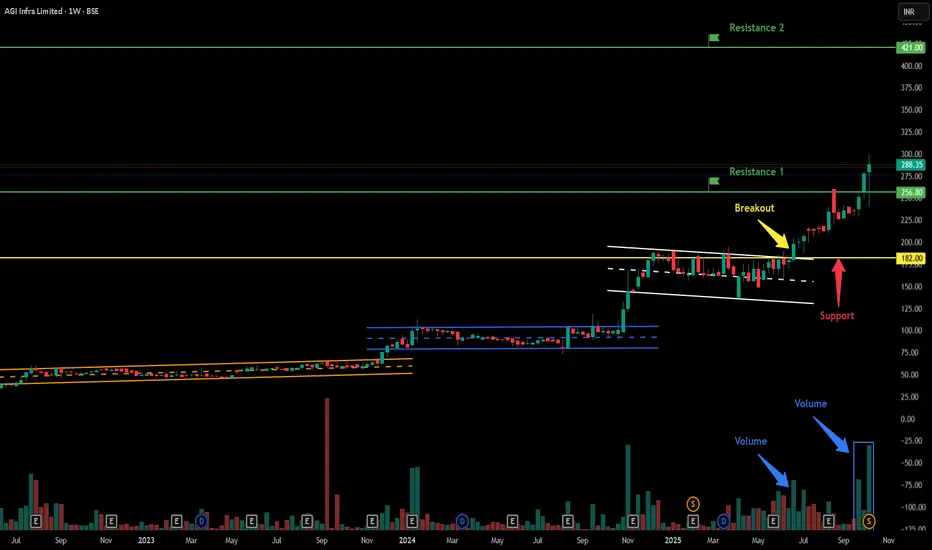
AGI Infra Ltd - Breakout Setup, Move is ON...#AGIIL trading above Resistance of 256.80
Next Resistance is at 421
Support is at 182
Here is previous chart:
Chart is self explanatory. Levels of breakout, possible up-moves (where stock may find resistances) and support (close below which, setup will be invalidated) are clearly defined.
Disclaimer: This is for demonstration and educational purpose only. This is not buying or selling recommendations. I am not SEBI registered. Please consult your financial advisor before taking any trade.