IREDA 1 Week Time Frame 📌 Current Price Snapshot
👉 Latest available price data shows IREDA trading around ~₹130–₹135 on the NSE (end of January 2026) — this serves as the baseline for weekly levels.
📈 Weekly Technical Levels (Key Zones)
🚧 Weekly Resistance Levels (Upside)
Level Significance
₹136–₹138 Near‑term resistance — first obstacle for bulls this week.
₹138–₹140 Secondary resistance — key short‑term range top.
₹145–₹150 Major weekly resistance zone — breakout above this signals strength.
🛑 Weekly Support Levels (Downside)
Level Significance
₹130–₹131 Immediate weekly support area — crucial for holding near current price.
₹126–₹127 Secondary support — next cushion if price slips.
₹122–₹123 Strong support zone below — potential downside limit this week.
📉 Weekly Outlook Structure
Bullish Scenario
✅ If price closes above ~₹138–₹140 on the weekly chart → next upside target becomes ₹145–₹150. Continued strength above ₹150 would target even higher levels.
Bearish Scenario
❌ A weekly close below ~₹130–₹127 → opens the door to deeper support at ₹122–₹123.
📊 Momentum & Indicators
RSI near lower area suggests mild bearish momentum (not oversold yet).
The stock remains below key medium/long‑term EMAs, indicating ongoing downward bias unless a strong breakout occurs.
📌 Summary – Weekly Levels to Watch
Bullish Break Points
🔹 First Resist: ₹136–₹138
🔹 Next Resist: ₹138–₹140
🔹 Major Resist: ₹145–₹150
Bearish Support Points
🔸 First Support: ₹130–₹131
🔸 Next Support: ₹126–₹127
🔸 Strong Support: ₹122–₹123
Chartpattren

PFC 1 Day Time Frame 📌 Current Market Price (Approx intraday)
• ~₹414–₹418 on NSE (trading range today: ₹413.10 – ₹420.40) as per real-time quotes.
📊 Key Daily Pivot & Levels (1-Day Timeframe)
🔹 Daily Pivot Reference (CPR / Pivot Zone)
• Central Pivot (CPR) / Pivot area: ~₹406.8 – ₹410.7 (bias reference)
📈 Resistance Levels (Upside)
R1: ~ ₹396–₹402 (initial resistance)
R2: ~ ₹402–₹406 (stronger sell zone)
R3: ~ ₹423–₹432 (higher resistance bands)
➡️ Above these, breakout zones could form if price closes strongly above ₹406–₹410.
📉 Support Levels (Downside)
S1: ~ ₹380–₹386 (first downside support)
S2: ~ ₹365–₹380 (secondary structural support)
S3: ~ ₹358–₹365 (deeper support zone)
➡️ Failure below ₹380–₹386 could tilt short-term bias more bearish.
📌 Daily Bias Interpretation
✔ Bullish bias if price holds above ~₹406–₹410 (CPR/pivot) — expect recovery toward ₹423+ zones.
✔ Neutral / slight bearish bias if price stays below ~₹406–₹410 — likely to test supports near ₹380–₹386.
📌 Context
The stock is trading well above its 20-day and 50-day moving averages, indicating short-term strength (based on recent MA data).
Over the past week/month, it’s shown positive momentum vs prior period.

NTPC 1 Day Time Frame 📌 Current Price (approx): ₹367–₹368 on NSE (today’s trading)
📊 Daily Pivot Levels (Key Reference Area)
These are calculated from recent price action & help identify where price may stall or bounce:
Central Pivot / CPR: ~₹364–₹365 (major reference)
Resistance (Upside Levels):
R1: ~₹371
R2: ~₹375
R3: ~₹382+
Support (Downside Levels):
S1: ~₹360
S2: ~₹353
S3: ~₹349
(Standard pivot model)
Daily EMA/SMA key zones:
20-day EMA ~₹347
50-day SMA ~₹339
100/200 day ~₹336-338
(These averages act as dynamic support/resistance)
🚀 Price Action Levels
📌 Immediate Resistance
First upside test: ₹370–₹372
Secondary upside: ₹375–₹378
Breakout zone: above ₹380 (short-term bullish continuation)
📉 Immediate Support
First support: ₹360–₹362
Next support: ₹353–₹355
Deeper support: ₹348–₹350
If price holds above pivot (~364–365) → short-term bullish bias. If it breaks below S1 (~360) → watch S2/S3 zones for stronger supports.
📈 Trend Context (Daily)
✔ Current price is trading above key medium-term moving averages (20/50/100/200 day), signalling bullish trend on daily charts.
✔ RSI levels and momentum indicators generally are neutral to slightly bullish — suggesting strength near current price zone but watch for overbought conditions.
How to use these levels
🔹 Bullish view (long positions):
– Entry if price breaks and holds above R1 (~₹371)
– Targets near R2 (~₹375) and R3 (~₹382+)
– Stop-loss below pivot (~₹364)
🔹 Bearish view (short positions or pullback):
– Look for rejection near R1/R2
– First target near S1 (~₹360)
– Deeper bearish target near S2 (~₹353)

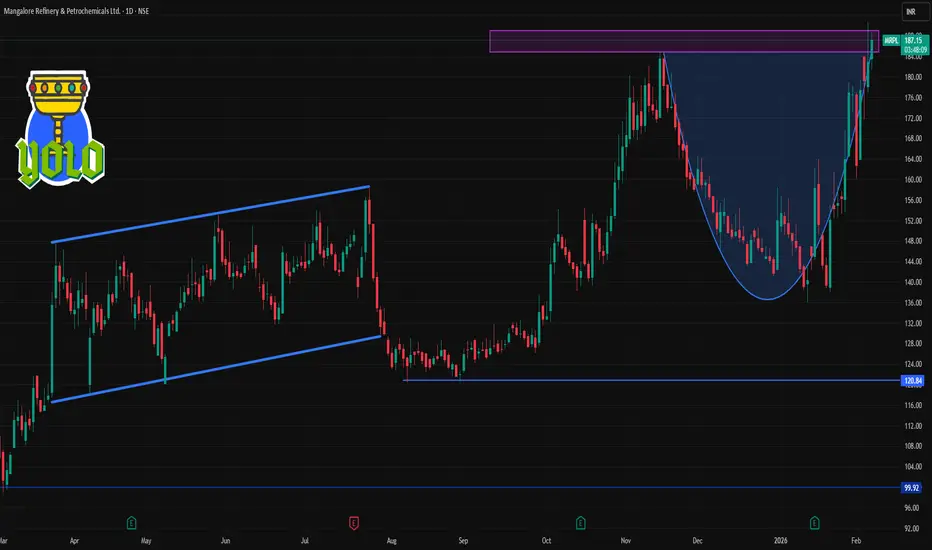
MRPL 1 Day Time Frame 📊 Latest Price Context (daily):
• The stock has recently been trading around ₹184–188 on NSE/BSE on the current session.
⭐ Daily Pivot Levels (Classic / Standard)
(used by many traders for intraday bias)
Level ₹ Price
R3 (Upper resistance) ~197.27
R2 ~190.63
R1 (Immediate resistance) ~184.97
Pivot Point (PP) ~178.33
S1 (Immediate support) ~172.67
S2 ~166.03
S3 ~160.37
👉 Interpretation:
Above Pivot (178–180) → bullish bias intraday.
Below Pivot → bearish / correction bias.
Resistance clusters near 185–191, with strong upper resistance around 197.
Immediate supports around 173 and 166 zones.
🔁 Alternate Daily Levels (Trendlyne)
(corroborated by another pivot source)
R1: ~₹185
R2: ~₹191
S1: ~₹172
S2: ~₹171 / ~₹168 (minor)
👉 Very similar structure: range ~172–185 for the day, with next larger moves beyond these points.
📌 Short Summary for 1-Day Trading Bias
Bullish if:
MRPL holds above daily pivot ~178–180
Break / close above ~185 could trigger further upside toward ~190–197
Bearish if:
Break below ~172 support
Next support zones: ~166 → ~160 area
INDUSTOWER 1 Day Time Frame 📌 1-Day Time Frame Levels (Daily Support & Resistance)
(These are typical pivot / intraday key levels traders watch)
Central Pivot (Pivot Point / CPR): ~ ₹421–₹422
Immediate Resistance Levels:
• R1: ~ ₹425–₹430
• R2: ~ ₹431–₹437
• R3: ~ ₹443–₹447
Immediate Support Levels:
• S1: ~ ₹415–₹417
• S2: ~ ₹411–₹414
• S3: ~ ₹405–₹408
(These pivot levels help gauge intraday bullish/bearish bias)
🧠 How to Interpret These Daily Levels
✔ If price stays above the pivot (~₹421–₹422) → bias is bullish for the day.
✔ A breakout above ₹430–₹437 may target higher resistances (~₹443+).
✔ A break below ~₹415–₹414 support could open the path toward lower supports (~₹405).
✔ Price oscillating between ~₹414 and ~₹422 is likely range-bound / choppy.
📊 Alternate/Additional Daily Levels (Trend Zones)
Some recent pivot-based grids suggest:
• First resistance: ~ ₹433–₹438
• Second resistance: ~ ₹438–₹443+
• Support zones: ~ ₹422–₹417, then ₹412–₹405 below that.

RECLTD 1 Day Time Frame 📍 Current Price (approx): ₹380–₹382 on NSE today (traded between ₹369.5–₹386.5 earlier) — price varies by source but this is the latest range.
📈 Daily Technical Levels (1-Day Timeframe)
🔁 Pivot & Reference
Daily Pivot Point: ~ ₹378–₹382 — central reference for bullish/bearish bias.
🟢 Resistance Levels
These are price zones where upside may face selling pressure:
R1: ~ ₹383–₹386 — first key resistance.
R2: ~ ₹390–₹397 — next resistance zone.
R3: ~ ₹400–₹402+ — extended resistance if trend continues up.
🔴 Support Levels
These are levels where price may find buying support in a pullback:
S1: ~ ₹378–₹379 — immediate support near pivot area.
S2: ~ ₹374–₹375 — deeper support zone.
S3: ~ ₹367–₹368 — secondary lower support.
📊 Short-Term Bias Interpretation (Daily View)
Bullish if:
✔ Price stays above the pivot (~₹378–₹382) and clears R1 (~₹383–₹386) — next upside towards R2 (~₹390+).
Neutral / Consolidating if:
↔ Price moves sideways around pivot without breakout — chop likely.
Bearish if:
✔ Price breaks below S1 (~₹378) — could test S2 (~₹374) and S3 (~₹367–₹368).
📌 Quick Summary (Daily)
Level Price (Approx)
Pivot (PP) ~₹378–₹382
Resistance 1 (R1) ~₹383–₹386
Resistance 2 (R2) ~₹390–₹397
Resistance 3 (R3) ~₹400–₹402+
Support 1 (S1) ~₹378–₹379
Support 2 (S2) ~₹374–₹375
Support 3 (S3) ~₹367–₹368
Note: These are daily pivot-based levels for short-term view. Price action can differ intraday due to volatility.

IFCI 1 Day Time Frame 📊 Current Live Price (Approx)
• IFCI trading around ₹57-₹60 range today on NSE/BSE (price fluctuates intraday).
✅ 1-Day Pivot & Key Levels
These are calculated based on recent price action and used by traders for intraday/short-term decisions:
Daily Pivot (PP): ~ ₹56.33 – ₹56.93
Resistance Levels:
R1: ~ ₹57.86 – ₹58.45
R2: ~ ₹59.06 – ₹60.14
R3: ~ ₹60.98 – ₹61.55
Support Levels:
S1: ~ ₹54.61 – ₹55.80
S2: ~ ₹53.08 – ₹53.68
S3: ~ ₹49.83 – ₹49.83 (deeper support)
📌 Ranges vary slightly by pivot calculation method (Classic, Fibonacci, Camarilla), but the zones above reflect current intraday technical consensus.
📌 How Traders Use These Levels (Daily View)
Bullish view:
• A sustained break above R1/R2 (~₹58-₹60) suggests strength and possible move toward R3 (~₹61+).
• Above pivot (~₹56-₹57) indicates bullish bias for the day.
Bearish view:
• A break below S1 (~₹54.6-₹55) can lead toward S2 (~₹53) and lower support.
• Below pivot signals downside pressure first.
🧠 Important Notes
• These levels are intraday technical references, not fundamental buy/sell calls.
• Markets and prices change minute-to-minute — use live quotes from your broker or trading platform.
• Combine pivot zones with volume, candlestick patterns, and trend indicators for better signals.
DIXON 1 Day Time Frame 📍 Live Price Snapshot
🔹 Approx Current Price: ~₹11,566 (INR) (up strong recently)
🔹 52-Week Range: ~₹9,835 – ₹18,471
📊 Daily Pivot & Support/Resistance Levels (1D Timeframe)
These are commonly used by traders to judge intraday/daily trend bias, entry/exit zones, and key price reactions:
Level Price (Approx) Type
R3 ₹11,551 – ₹11,600 Major Resistance
R2 ₹11,375 – ₹11,380 Resistance Zone
R1 ₹11,203 Near-Term Resistance
Pivot ~₹11,027 Daily Center / Bias Level
S1 ₹10,855 Support
S2 ₹10,679 Support Zone
S3 ₹10,507 Strong Support
👉 Price above Pivot & R1–R3: Bullish bias
👉 Price below Pivot & heading toward S1–S3: Bearish/neutral pressure
These are classic pivot levels updated for today’s trading range.
📈 Short-Term Technical Structure
Bullish / Positive signs:
Price recently moved above short EMAs (e.g., 5-, 9-day), showing short-term strength.
RSI around mid-range suggests room to run upside without overbought stress.
Bearish / Caution flags:
Longer moving averages (50/100/200) still overhead as resistance — trending bias remains cautious.
Technicals from some chart views still show a weak structure on daily if price fails below pivot.
📌 How to Use These Levels Today
✔ Bullish bias only if price sustains above pivot (~₹11,027)
✔ Near-term breakout zone: Clear move above R2 (~₹11,375) / R3 (~₹11,550)
✔ Support watches: Monitor S1 (~₹10,855) and S2 (~₹10,680) for pullbacks
✔ Break below S3 (~₹10,507) — could signal deeper intraday bearish pressure
🧠 Quick Context
Shares recently rebounded and are above short-term EMAs, indicating some short-term strength.
Overall broader market influences (mid-cap pressure / sector flow) still matter for this stock’s direction.
Price near multimonth lows, so risk and volatility remain elevated.

NCC 1 Week Time Frame 📌 Latest Price Context (as of 3 Feb 2026)
Last traded price around ₹152–₹153 on NSE.
📊 1-Week Technical Levels
🔁 Immediate Resistance (Upside)
These are the levels where price may struggle to rise further within the next week:
₹155–₹157 → First resistance zone (short-term pivot R1/R2).
₹160–₹162 → Next barrier where selling pressure could appear.
₹160 is also cited as an immediate resistance by market analysts, above which short-term bullish momentum could improve.
Bullish Short-Term Trigger:
➡️ A clear close above ₹157–₹160 on daily charts may open the path for a rebound.
🔽 Immediate Support (Downside)
These are key levels where price might find buying interest this week:
₹150–₹150.2 → First support zone near S1.
₹147–₹145 → Next support cluster (S2/S3).
₹142–₹140 → Stronger support zone if price weakens; analysts cite ₹142 as important short-term floor.
Bearish Short-Term Trigger:
➡️ A clear break and close below ₹145–₹142 on daily charts may signal further weakness toward lower supports.
📉 Short-Term Technical Sentiment
Price is trading below key short-term moving averages (20/50 DMA), indicating bearish bias near term.
RSI remains subdued, suggesting limited upside momentum in the immediate term.
Analyst commentary highlights the stock being in a downtrend, with resistance overhead and volatility remaining elevated.
📌 1-Week Outlook Summary
Bullish Scenario (1W):
Holds above ₹150
Breaks and sustains above ₹155–₹160
➡️ Upside target in the week toward ₹160–₹162+
Neutral/Rangebound (1W):
Trades between ₹147–₹157
➡️ Sideways action likely in a tight range
Bearish Scenario (1W):
Breaks below ₹145–₹142
➡️ Further weakness toward ₹140 or lower

DIVISLAB 1 Week Time Frame 📌 Current Price Snapshot (latest)
Latest traded price around ₹6,056 – ₹6,056.50 (NSE) in early Feb 2026.
📈 Weekly Support & Resistance Levels (1-Week Time Frame)
📊 Key Levels for This Week (approx based on technical forecasting):
Level Type Price Level (₹)
Strong Resistance 3 (R3) ~6,496.8
Resistance 2 (R2) ~6,377.2
Resistance 1 (R1) ~6,194.3
Current Box Top Level (upper range) ~6,496
Support 1 (S1) ~5,891.8
Support 2 (S2) ~5,772.2
Strong Support 3 (S3) ~5,589.3
➡️ This implies the expected weekly trading range is roughly ₹5,590 – ₹6,495 if the stock remains within normal price swings this week.
🔍 Short-Term Technical Context
Price currently below many key moving averages (5, 10, 20 SMA etc.) indicating bearish bias in short term.
Momentum indicators like RSI and MACD show neutral to bearish positioning, suggesting limited upside unless buyers step in strongly.
📌 How To Use These Levels
Bullish trigger levels:
✔ Above ~₹6,194 (R1) — short-term upside bias
✔ Above ~₹6,377 (R2) — stronger bullish sentiment this week
Bearish trigger levels:
🔻 Below ~₹5,891 (S1) — indicates selling pressure
🔻 Below ~₹5,772 (S2) — more downside risk
📌 Summary Weekly View
Expected trading range this week: ₹5,590 – ₹6,495
Near-term resistance: ~₹6,194 → ~₹6,377
Near-term support: ~₹5,891 → ~₹5,772 (secondary)
📍 All levels are based on technical forecasts and pivots — not guaranteed — and actual price action may vary with market conditions.

PAYTM 1 Day Time Frame 📍 Current Price (approx): ₹1,170 – ₹1,203 range (intraday movement) — fluctuating due to session volatility.
📊 Daily Support & Resistance Levels — 1‑Day Time Frame (Pivot‑based)
🟡 Pivot Point (PP): ~₹1,168–₹1,170
This is the key central level — below it bearish bias, above it bullish bias.
🔴 Upside – Resistance Levels
R1: ~₹1,188–₹1,190
R2: ~₹1,202–₹1,205
R3: ~₹1,217–₹1,225+
(Break & hold above these suggests stronger bullish continuation for the day)
🔵 Downside – Support Levels
S1: ~₹1,151–₹1,155
S2: ~₹1,130–₹1,140
S3: ~₹1,113–₹1,120
(Break below these risks faster intraday downside)
📈 Intraday Key Zones to Watch
➡️ Bullish above Pivot (~₹1,168–₹1,170) — Price may look to resistance zones at ₹1,188 → ₹1,202 → ₹1,217.
➡️ Bearish below Pivot — support zones at ₹1,151 → ₹1,130 → ₹1,113 become targets.
📌 Day Trading Bias (1D Frame)
Bullish tilt if price stays above pivot and holds above R1.
Bearish bend if price slips below S1 with follow‑through.
Intraday volatility is high (range breakout strategy often works).
🧠 Quick Notes
These levels are pivot‑based support/resistance commonly used by technical traders.
Markets move with news, volume and momentum — always trade with risk management like stop‑loss near key supports/resistances.
This is not financial advice — verify prices on your live trading platform before taking positions.

GODREJPROP 1 Day Time Frame 📍 Latest Price (approx):
Around ₹1,680–₹1,714 range in today’s trading session (price varies through the day).
📊 1‑Day Time Frame Levels (Daily Pivot & S/R Zones)
🔹 Pivot / Mid Reference
Pivot Point: ~ ₹1,590–₹1,610 (central reference for bias) — classic DR pivot.
📈 Daily Resistance Levels
Levels above current price where selling pressure may show:
R1: ~ ₹1,620–₹1,630 (1st resistance)
R2: ~ ₹1,670–₹1,680 (2nd resistance)
R3: ~ ₹1,720–₹1,745 (3rd/higher resistance)
👉 If price breaks and holds above R2/R3 with volume, bullish continuation may occur.
📉 Daily Support Levels
Levels below current price where buyers may step in:
S1: ~ ₹1,508–₹1,520 (1st support)
S2: ~ ₹1,487–₹1,495 (2nd support)
S3: ~ ₹1,455–₹1,460 (3rd support)
👉 A drop below S1/S2 could signal further near‑term weakness.
🧠 How to Read These Levels
Above Pivot / R1: Bias turns bullish intraday.
Below Pivot / near S1: Bears may control short term.
Breakout levels: Taking out the R3 zone with volume → bullish momentum.
Breakdown zone: Sustained close below S2/S3 → stronger bearish pressure.
📌 Notes
Different providers compute pivots slightly differently (classic, Fibonacci, Camarilla), but the ranges above reflect consensus across recent intraday pivot calculations.
These levels are for intraday/daily trading and not prediction of long‑term trend. Always complement with price action and risk management.

SIEMENS 1 Day Time Frame 📌 Current Price (Live/Latest data)
Siemens Ltd trading around ₹3,220 – ₹3,230 in today’s session.
(Note: prices fluctuate continuously during trading hours — these are live approximate levels today.)
📊 Daily Pivot & Key Levels (1‑Day Timeframe)
These are calculated based on the previous trading day’s price range — useful for intraday bias:
✔️ Pivot & Main Levels
Pivot (Central level): ~ ₹3,002 – ₹3,053
Resistance 1 (R1): ~ ₹3,114 – ₹3,134
Resistance 2 (R2): ~ ₹3,178 – ₹3,246
Resistance 3 (R3): ~ ₹3,258 – ₹3,358
Support 1 (S1): ~ ₹2,870 – ₹3,009
Support 2 (S2): ~ ₹2,759 – ₹2,928
Support 3 (S3): ~ ₹2,626 – ₹2,883
📈 How to Interpret Today’s Levels
✅ Bullish scenario:
Price holding above Pivot (~₹3,000–₹3,050) suggests bullish bias.
Sustained move above R1 (~₹3,114) targets higher zones near R2 (~₹3,178) and R3 (~₹3,250+).
❗ Bearish scenario:
Breakdown below Pivot (~₹3,000) can weaken bias.
Drop below S1/S2 (~₹2,870–₹2,928) signals deeper decline nearer S3 (~₹2,626).
📌 Intraday Price Action Today
Intraday range seen ~₹3,160 low to ~₹3,246 high in the ongoing session.
🧠 Market Context
The stock recently traded within a broader range but remains above major pivot and moving average zones, which supports short-term strength.

AXISBANK 1 Week Time Frame 📊 Current Context (As of 30 Jan 2026)
Last Close: ~₹1,370 – ₹1,378 range.
Recently traded near a 52-week high.
📈 Weekly Resistance Levels
These resistances act as potential upside barriers for the coming week:
R1: ~₹1,317 – ₹1,320 — first resistance zone.
R2: ~₹1,341 – ₹1,342 — next upside.
R3: ~₹1,370+ — major resistance breakout level.
➡️ Bullish scenario: A weekly close above ~₹1,317–₹1,320 increases chances of move toward ₹1,340+ / ₹1,370+.
📉 Weekly Support Levels
Support levels where price may find buying interest if it pulls back:
S1: ~₹1,262 – ₹1,265 — near-term support.
S2: ~₹1,230 — mid-range support.
S3: ~₹1,206 — broader downside buffer.
➡️ Bearish scenario: If the stock closes below ~₹1,262–₹1,265, further downside toward ₹1,230 → ₹1,206 could be possible.
📅 Likely Weekly Trading Range
Neutral / range-bound view:
₹1,262 – ₹1,320 — price may oscillate here unless a strong breakout/breakdown occurs.
📌 Quick Summary
Bullish break levels: above ₹1,317–₹1,320
Immediate upside resistances: ₹1,341 / ₹1,370+
Downside supports: ₹1,262 → ₹1,230 → ₹1,206

AMBUJACEM 1 Week Time Frame 📊 Current Price Context
The stock has recently traded around ₹510 – ₹536 after earnings‑related volatility.
The 52‑week range is roughly ₹455 (low) to ₹625 (high).
🔁 1‑Week Technical Levels (approx)
Key resistance (levels where sellers may step in):
₹542‑₹545: Near recent pivotal resistance zone.
₹552‑₹558: Secondary resistance cluster short‑term.
Key support (levels where buyers may defend):
₹527‑₹528: Initial support within the week.
₹521‑₹516: Next support zone if the dip extends.
₹500 – ₹495: Stronger longer‑term support if selling intensifies.
📉 Short‑Term Trend & Signal
Technical aggregators rate the stock as weak/neutral to bearish on the 1‑week timeframe — meaning downside risks currently outweigh upside signal.
Price below recent pivot and moving averages suggests bearish short‑term momentum absent close above resistance.
📌 Practical Swing Levels (Simple Guide)
Bullish trigger zone: closing above ₹545‑₹550 on weekly closes could make higher levels nearer ₹560+ possible.
Bearish trigger zone: closing below ₹520 may open path toward ₹500 and deeper.
VEDL 1 Day Time Frame 📊 Key Daily Price Levels (NSE)
(Current price context — road-tested from multiple live feeds)
⛳ Pivot & Intraday Reference (Daily pivot is the key bias level)
• Daily Pivot: ~₹685 – ₹719 region (major pivot range varies by source)
📈 Resistances (Upside Levels)
• R1: ~₹725 – ₹730 zone — initial resistance for bulls today
• R2: ~₹738 – ₹751 — stronger barrier area where sellers may step in
• R3: ~₹760 – ₹803 (higher overhead zone) — breakout target if momentum is strong
📉 Supports (Downside / Bounce Zones)
• Immediate Support: ~₹700 – ₹710 (near today’s intraday low mid-range)
• Next Support: ~₹689 – ₹690 (lower circuit boundary / near recent low)
• Deeper Support Zones: ₹665-₹660 cluster — a demand zone if price slips further
📌 What Today’s Price Action Looks Like
• Currently trading in a wide intraday range ~₹695–₹755 today on NSE — volatile with a broadened circuit range of ₹689.75 (LC) to ₹842.95 (UC).
• The stock has been in strong short-term uptrend, but faces selling pressure near upper resistances — this suggests cautious profit-booking near R1-R2 unless breakout with volume confirms strength.
📊 Technical Indicator Context (Daily)
⚡ RSI/oscillators on some providers show overbought conditions on short timeframe, indicating possible pullbacks if resistance holds.
Key Levels to Use for Stops/Entries:
Stop-loss (for long trades): below ₹689 (intraday structural support).
Aggressive breakout entry: above ₹738-₹750 (for momentum play).
Support test entry: near ₹700-₹690 (with tight stop).

Premium Chart Pattern Limitations
No Guarantees: Patterns only indicate probabilities, not certainties.
False Signals: Markets can generate fake breakouts or pattern failures.
Subjectivity: Interpretation can vary among traders.
Context Matters: Patterns work best with trend confirmation and other technical indicators like RSI, MACD, and moving averages.

ASIANPAINT 1 Week Time Frame 📊 Current Price Context
Recent share price was trading around ₹2,423–₹2,515 range (latest intraday/previous close range) according to market data.
📈 Weekly Timeframe Levels — Asian Paints (NSE)
🔴 Resistance (Upside)
These are levels where price may face selling pressure or pause on the upside in the coming week:
1. ₹2,560–₹2,565 — Immediate near‑term resistance zone seen from short weekly consolidations.
2. ₹2,720–₹2,760 — Mid resistance zone where upside moves often stall on weekly/daily clusters.
3. ₹2,820–₹2,860+ — Higher weekly resistance zone — breakout above this could indicate stronger momentum.
🟢 Support (Downside)
These are levels where price might find buying interest or a floor on weekly charts:
1. ₹2,440–₹2,460 — Immediate support from weekly lower bands and short pivot support.
2. ₹2,340–₹2,380 — Secondary support zone seen from historical price clusters and volatility bands.
3. ₹2,300–₹2,250 — Major structural support — breakdown here could lead to deeper correction.
📉 Pivot Zone
₹2,500–₹2,530 — A central pivot/neutral range this week; trading above suggests short bullish bias, below suggests bearish.
📌 Weekly Technical Bias (Summary)
Bullish Scenario: A sustained weekly close above ₹2,560–₹2,565 opens path toward ₹2,720–₹2,860.
Bearish Scenario: Failure to hold ₹2,440–₹2,460 could drag price toward ₹2,340–₹2,300 on the weekly chart.
Range Play: Price oscillating between ₹2,440 – ₹2,560 indicates consolidative behavior typical in neutral markets.

PHOENIXLTD 1 Week Time Frame📌 Current weekly reference price: ~₹1,730–₹1,740 on NSE (updated latest).
📊 Weekly Pivot & Key Levels (Most Recent)
▶️ Weekly Pivot Point
Weekly Pivot (Standard): ₹1,768.93 (central reference for the week)
📈 Weekly Resistance Levels
(Upside levels where price may face selling pressure)
1. R1: ~₹1,818.67 – first major resistance zone this week
2. R2: ~₹1,910.83 – secondary resistance on extended upside
3. R3: ~₹1,960.57 – deep stretch resistance if bullish momentum builds
Interpretation:
A weekly close above ₹1,818–₹1,820 would suggest strength and bullish continuation into higher zones.
Strong upside momentum could target tier‑2 and tier‑3 resistance levels above ₹1,900.
📉 Weekly Support Levels
(Key downside levels where price may find buying interest)
1. S1: ~₹1,676.77 – immediate support if price dips from current levels
2. S2: ~₹1,627.03 – deeper zone of support below S1
3. S3: ~₹1,534.87 – medium‑term support zone, stronger base area
Interpretation:
If price confirms a break below weekly support ₹1,676–₹1,680, it increases the likelihood of further correction toward ₹1,627 and then ~₹1,535.
📌 Summary — Weekly Price Action Framework
Bullish Scenario (weekly view):
Price sustains above pivot ~₹1,768–₹1,770
Breaks ₹1,818–₹1,820 weekly resistance
➡️ Upside target zones: ₹1,910 → ₹1,960+
Bearish/Neutral Scenario (weekly view):
Weekly close below ₹1,676–₹1,680 support
➡️ Downside zones: ₹1,627 → ₹1,535

CIPLA 1 Day Time Frame 📌 Live Price Snapshot (Intraday)
📍 Cipla Share Price (NSE): ~₹1,305 (mid‑session)
• Today’s range so far: High ~₹1,308.80 — Low ~₹1,281.70.
• This is near its 52‑week low (~₹1,281.70) after recent downward pressure on the stock.
⚠️ Immediate Intraday Levels to Watch
📈 Upside Resistance
• ₹1,334–₹1,366 — key near‑term resistance cluster above current price.
• Break above ₹1,366 with volume may challenge ₹1,417+ zone.
📉 Downside Support
• ₹1,283 — first major support (already tested).
• Below that ₹1,250–₹1,200 are lower supports from daily pivots.
📍 How Traders Use These Levels Today
Bullish scenario (intraday):
If price sustains above ₹1,334 pivot → watch for rebounds toward ₹1,366 → ₹1,417 → ₹1,449.
Bearish scenario (intraday):
If price breaks and closes below ₹1,283 → likely continuation toward ₹1,250 / ₹1,200.
Neutral/range action:
Between ₹1,283–₹1,334 — range trading expected with tight stops.

WAAREEENER 1 Week View📍 Live Price Snapshot (Approximate)
The stock is trading around ₹2,590–₹2,600 on the NSE in recent sessions.
📊 1-Week Timeframe Levels
🔼 Resistance (Upside)
These are levels where price may face selling pressure:
₹2,606 – ₹2,610 — Immediate resistance / pivot-R1 zone this week.
₹2,659 – ₹2,660 — next resistance above pivot.
₹2,690 – ₹2,700 — higher weekly resistance zone.
👉 A sustained breakout above ₹2,660–₹2,690 could suggest short-term strength on the weekly chart.
🔽 Support (Downside)
Key support zones where buyers may step in:
₹2,554 – ₹2,550 — first support zone for the week.
₹2,467 – ₹2,470 — next support if the first breaks.
₹2,374 – ₹2,375 — deeper support level below.
📌 Weekly Trend Notes
Current weekly indicators (RSI/MACD etc.) lean bearish or neutral, with RSI low and MACD negative — indicating short-term downward momentum.
The chart is showing below key moving averages (20/50 day) — typically short-term bearish pressure.
Recent news showed a strong earnings rally around Jan 22, 2026, lifting the stock near higher levels, but price remains below longer-term averages.

HINDUNILVR 1 Day Time Frame 📊 Live 1‑Day Price Snapshot (Today’s Trading – India NSE)
🔹 Current Price: ₹2,409.50 INR (latest available intra‑day quote)
🔹 Previous Close: ₹2,390.60 INR
🔹 Day’s Trading Range: ₹2,376.80 – ₹2,434.30 INR
🔹 Volume (Approx): ~1.3 M shares traded
🔹 52‑Week Range: ₹2,136.00 – ₹2,750.00 INR
📈 This is live market data for today’s session (latest trading information available from stock exchange and market feeds).

Chart Patterns in Trading
Chart patterns are formations created by the price movements of a security on a chart over time. These patterns are a critical component of technical analysis, as they help traders and investors predict potential price movements based on historical behavior. Patterns reflect the psychology of market participants, including fear, greed, optimism, and pessimism, and can indicate trends, reversals, or consolidation phases.
Chart patterns are generally divided into two main categories:
Continuation patterns – These indicate that the current trend (uptrend or downtrend) is likely to continue after the pattern completes.
Reversal patterns – These suggest that the current trend may reverse direction once the pattern is complete.
