PHOENIXLTD 1 Week Time Frame📌 Current weekly reference price: ~₹1,730–₹1,740 on NSE (updated latest).
📊 Weekly Pivot & Key Levels (Most Recent)
▶️ Weekly Pivot Point
Weekly Pivot (Standard): ₹1,768.93 (central reference for the week)
📈 Weekly Resistance Levels
(Upside levels where price may face selling pressure)
1. R1: ~₹1,818.67 – first major resistance zone this week
2. R2: ~₹1,910.83 – secondary resistance on extended upside
3. R3: ~₹1,960.57 – deep stretch resistance if bullish momentum builds
Interpretation:
A weekly close above ₹1,818–₹1,820 would suggest strength and bullish continuation into higher zones.
Strong upside momentum could target tier‑2 and tier‑3 resistance levels above ₹1,900.
📉 Weekly Support Levels
(Key downside levels where price may find buying interest)
1. S1: ~₹1,676.77 – immediate support if price dips from current levels
2. S2: ~₹1,627.03 – deeper zone of support below S1
3. S3: ~₹1,534.87 – medium‑term support zone, stronger base area
Interpretation:
If price confirms a break below weekly support ₹1,676–₹1,680, it increases the likelihood of further correction toward ₹1,627 and then ~₹1,535.
📌 Summary — Weekly Price Action Framework
Bullish Scenario (weekly view):
Price sustains above pivot ~₹1,768–₹1,770
Breaks ₹1,818–₹1,820 weekly resistance
➡️ Upside target zones: ₹1,910 → ₹1,960+
Bearish/Neutral Scenario (weekly view):
Weekly close below ₹1,676–₹1,680 support
➡️ Downside zones: ₹1,627 → ₹1,535
Chartpattren

CIPLA 1 Day Time Frame 📌 Live Price Snapshot (Intraday)
📍 Cipla Share Price (NSE): ~₹1,305 (mid‑session)
• Today’s range so far: High ~₹1,308.80 — Low ~₹1,281.70.
• This is near its 52‑week low (~₹1,281.70) after recent downward pressure on the stock.
⚠️ Immediate Intraday Levels to Watch
📈 Upside Resistance
• ₹1,334–₹1,366 — key near‑term resistance cluster above current price.
• Break above ₹1,366 with volume may challenge ₹1,417+ zone.
📉 Downside Support
• ₹1,283 — first major support (already tested).
• Below that ₹1,250–₹1,200 are lower supports from daily pivots.
📍 How Traders Use These Levels Today
Bullish scenario (intraday):
If price sustains above ₹1,334 pivot → watch for rebounds toward ₹1,366 → ₹1,417 → ₹1,449.
Bearish scenario (intraday):
If price breaks and closes below ₹1,283 → likely continuation toward ₹1,250 / ₹1,200.
Neutral/range action:
Between ₹1,283–₹1,334 — range trading expected with tight stops.

WAAREEENER 1 Week View📍 Live Price Snapshot (Approximate)
The stock is trading around ₹2,590–₹2,600 on the NSE in recent sessions.
📊 1-Week Timeframe Levels
🔼 Resistance (Upside)
These are levels where price may face selling pressure:
₹2,606 – ₹2,610 — Immediate resistance / pivot-R1 zone this week.
₹2,659 – ₹2,660 — next resistance above pivot.
₹2,690 – ₹2,700 — higher weekly resistance zone.
👉 A sustained breakout above ₹2,660–₹2,690 could suggest short-term strength on the weekly chart.
🔽 Support (Downside)
Key support zones where buyers may step in:
₹2,554 – ₹2,550 — first support zone for the week.
₹2,467 – ₹2,470 — next support if the first breaks.
₹2,374 – ₹2,375 — deeper support level below.
📌 Weekly Trend Notes
Current weekly indicators (RSI/MACD etc.) lean bearish or neutral, with RSI low and MACD negative — indicating short-term downward momentum.
The chart is showing below key moving averages (20/50 day) — typically short-term bearish pressure.
Recent news showed a strong earnings rally around Jan 22, 2026, lifting the stock near higher levels, but price remains below longer-term averages.

HINDUNILVR 1 Day Time Frame 📊 Live 1‑Day Price Snapshot (Today’s Trading – India NSE)
🔹 Current Price: ₹2,409.50 INR (latest available intra‑day quote)
🔹 Previous Close: ₹2,390.60 INR
🔹 Day’s Trading Range: ₹2,376.80 – ₹2,434.30 INR
🔹 Volume (Approx): ~1.3 M shares traded
🔹 52‑Week Range: ₹2,136.00 – ₹2,750.00 INR
📈 This is live market data for today’s session (latest trading information available from stock exchange and market feeds).

Chart Patterns in Trading
Chart patterns are formations created by the price movements of a security on a chart over time. These patterns are a critical component of technical analysis, as they help traders and investors predict potential price movements based on historical behavior. Patterns reflect the psychology of market participants, including fear, greed, optimism, and pessimism, and can indicate trends, reversals, or consolidation phases.
Chart patterns are generally divided into two main categories:
Continuation patterns – These indicate that the current trend (uptrend or downtrend) is likely to continue after the pattern completes.
Reversal patterns – These suggest that the current trend may reverse direction once the pattern is complete.

JINDALSTEL 1 Day Time Frame 📊 Current Price Snapshot
The stock has been trading around ~₹1,030–₹1,070 on recent sessions.
🔑 Daily Pivot & Key Levels (1‑Day Time Frame)
🔼 Resistance Levels
R1: ~₹1,053–₹1,063
R2: ~₹1,062–₹1,071
R3: ~₹1,070–₹1,079+
These are potential daily resistance zones where price may slow or reverse on the upside.
🔁 Pivot/Reference Level
Daily Pivot (central level): ~₹1,045–₹1,046
This is the equilibrium reference; above this suggests slightly bullish bias, below suggests bearish bias for the day.
🔽 Support Levels
S1: ~₹1,034–₹1,056
S2: ~₹1,025–₹1,048
S3: ~₹1,015–₹1,041
These are key intraday support zones where the stock may find buying interest.
📈 How to Use These Levels Today
Bullish scenario: If price holds above the pivot and clears R1/R2 (~₹1,053–₹1,071) with volume, it may test R3 (~₹1,078+).
Bearish scenario: If it breaks below S2 (~₹1,025), watch for deeper pullbacks toward S3 (~₹1,015).
Range‑bound: If staying between pivot and S1/R1, expect sideways movement.
(Typical pivot logic — not investment advice.)

RICOAUTO 1 Week Time Frame 📊 Current Price Snapshot
The stock is trading around ₹115–₹122 range recently.
📈 Key Levels for 1-Week Time Frame
🔵 Resistance Levels (Upside Targets)
1. ~₹121–₹122 — Immediate resistance zone (short-term pivot region).
2. ~₹126–₹127 — Next resistance zone where sellers may appear.
3. ~₹129–₹132 — Higher resistance area, a target if momentum improves.
📌 If price breaks and sustains above ₹122–₹126 with volume, near-term bullish continuation could occur.
🔻 Support Levels (Downside Defense)
1. ~₹113–₹114 — First technical support.
2. ~₹110 — Secondary near-term support.
3. ~₹105–₹106 — Stronger lower support zone if selling accelerates.
📌 A close below ₹110 in daily charts often signals deeper pullbacks.
📌 What Traders Are Watching
Some technical analysts have noted support around ₹120–₹123 with stop-loss/entry zones for short-term trades (e.g., stop-loss near ₹114–₹115).
⚠️ Risk Notes
Short-term technical signals (like moving averages) currently show weak to selling bias on intraday/daily charts.
Broader market conditions and sector movement can heavily influence price direction.

Real Knowledge Chart Patterns Why Candlestick Patterns Matter
Candlestick patterns matter because they reflect real-time trader behavior:
Are bulls becoming aggressive?
Are bears weakening?
Is a reversal coming?
Is the trend gaining strength?
Are institutions absorbing liquidity?
In Volume Profile or Market Structure context:
A candle pattern near value areas confirms reversals.
A candle pattern at breakout zones confirms continuation.
A candle pattern after liquidity grabs confirms orderflow shift.

FEDERALBNK 1 Month Time Frame 📊 Current Price Snapshot
Federal Bank stock was trading around ₹270–₹280 recently.
🔑 Key Short‑Term Levels (1‑Month Timeframe)
🟢 Resistance Levels
These are price points where the stock may encounter selling pressure on the upside:
R1: ~₹283–₹286
R2: ~₹286–₹293
R3: ~₹293+
(Often used as potential targets if the uptrend continues)
🔵 Support Levels
These are zones where the stock has historically found buying interest or may bounce if it corrects:
S1: ~₹273–₹275
S2: ~₹266–₹267
S3: ~₹263–₹260
(If these break, deeper pullbacks could occur)
📍 Pivot‑Type Levels (Indicative)
Important pivot: ~₹205 region (from some pivot models, though older) — less relevant if price stays well above.
🧠 How Traders Typically Use These Levels
Bullish scenario: If the price sustains above ₹283–₹286, it could target ₹293+ as next resistance.
Neutral/breakout watch: Steady holds above ₹273–₹275 support keep the uptrend intact.
Bearish risk: A drop below ₹266–₹263 could signal short‑term weakness and potential deeper retracement.
(All levels are approximate and depend on market conditions and volume.)

NIFTY 50 / TRIPLE TOP IN D TF - DOWNSIDE RISK AHEADNIFTY50 appears to be forming a triple top on the daily timeframe.
Momentum indicators are weakening, suggesting further downside.
Budget day could act as a volatility trigger and potential turning point.
Levels to watch on the downside.

HINDPETRO 1 Day Time Frame 📊 Current Intraday Price (as of latest available)
📍 HPCL current price: ~₹456–₹458 per share (NSE/BSE) — trading around this level today.
🕐 Note: Prices are updated during market hours and may change quickly.
📈 Intraday Price Levels
Day’s High: ~₹460.00
Day’s Low: ~₹454.45
Upper Circuit (limit): ~₹503.65
Lower Circuit (limit): ~₹412.15
Previous Close: ~₹457.90
🔎 What This Means (Intraday Structure)
Current trading band: approximately ₹454–₹460 — tight range so far today.
Important near‑term zones:
Support (intraday): near the lower part of today’s range around ₹454–₹455.
Resistance (intraday): near the upper part of today’s range around ₹458–₹460.
🛠 Technical Snapshot (for context)
Short‑term technical oscillators are mixed to slightly bearish/neutral on intraday/daily charts (RSI ~ mid‑range, MACD slightly bearish).
📌 Quick Summary
HPCL is trading sideways today with limited volatility between ₹454 and ₹460 so far.
Break below ₹454 may open downside momentum intraday; above ₹460 could target broader intraday resistance.

Chart PatternsChart patterns are visual formations on a price chart that reflect the collective behavior of market participants. These formations reveal the underlying psychology of buyers and sellers and help traders anticipate potential price movements. Whether you trade equities, derivatives, or index futures like Nifty or GIFT Nifty, chart patterns remain one of the most valuable tools for technical analysis. They help you read structure, recognize trend strength, identify reversals, and understand volume-based confirmation.
Broadly, chart patterns fall into three categories:
Reversal Patterns
Continuation Patterns
Bilateral Patterns

JSWSTEEL 1 Day Time Frame 📌 Daily Pivot Reference
Pivot (Daily): ~ ₹1,184 – ₹1,185 (central reference point)
📈 Resistance Levels (Upside)
1. R1: ~₹1,199 – ₹1,200 (first resistance)
2. R2: ~₹1,216 – ₹1,217 (second resistance)
3. R3: ~₹1,230 – ₹1,231 (third resistance / extended resistance)
📉 Support Levels (Downside)
1. S1: ~₹1,167 – ₹1,168 (first support)
2. S2: ~₹1,153 – ₹1,155 (second support)
3. S3: ~₹1,135 – ₹1,136 (third support)
📊 How to interpret on a 1D chart
A break above ₹1,200–₹1,216 with strong volume may open room for testing ₹1,230+ short-term.
On the downside, a slip below ₹1,167 could accelerate to ₹1,153 and then ₹1,135.
The pivot around ₹1,184–₹1,185 acts as a baseline: closes above suggest bullish bias intraday; closes below suggest bearish bias.

TATACAP 1 Hour Time Frame 📊 Current Price (approx, delayed)
₹355 – ₹358 range today (intraday high ~361.65 & low ~354.00).
📈 Intraday / 1‑Hour Key Levels (Indicative)
🧠 Pivot & Resistance Levels
These are useful for short term/1‑hour chart bias:
Level Price (₹ approx) Role
R3 368.4 Extended upside resistance
R2 363.2 Secondary resistance
R1 359.0 – 359.1 First resistance zone — breakout confirmation above boosts
bullish bias
Pivot (PP) 353.8 – 354.0 Central pivot — above = bullish, below = bearish
Source: ICICI Direct / Kotak Securities pivot data
📉 Support Levels
Level Price (₹ approx) Role
S1 349.7 Immediate support
S2 344.5 Next downside support
S3 340.3 – 340.4 Deeper support zone
Source: ICICI Direct / Kotak pivot data
📌 How To Use These Levels (1‑Hour Context)
Bullish Scenario
Above Pivot (~354) → bulls in control.
Break above R1 (~359) → stronger upside probability toward R2 (363) and R3 (368).
Bearish Scenario
Below Pivot (~354) → bias turns neutral → bearish if it closes below S1 (~349.7).
A close below S2 (~344) opens swing toward S3 (~340).
Intraday Strategy Tips
In fast moves, use R1/S1 on the 1‑hour chart as your initial entry/exit reference.
Confirm move with volume + RSI/MACD (positive signals add confidence).

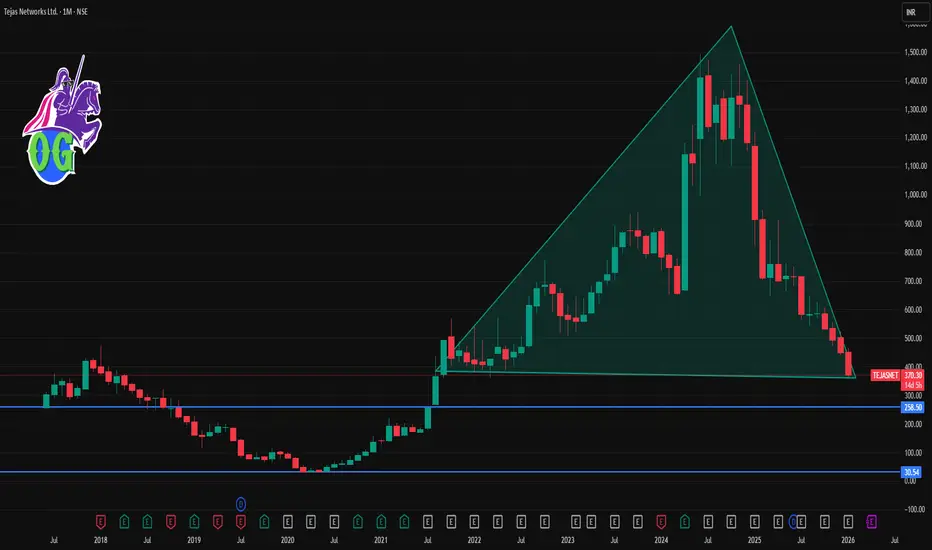
TEJASNET 1 Month Time Frame 📊 Current Price Context (as of mid‑January 2026)
Tejas Networks is trading around ₹370‑₹375 on NSE/BSE.
The stock recently hit a 52‑week low near ₹364 after weak quarterly earnings and sales decline.
📉 Short‑Term Technical Levels (1‑Month View)
🔻 Immediate Support Zones
These are levels where the stock could find buyers or stall further declines:
₹366‑₹370 — current short‑term support (intraday pivot & recent low).
₹362‑₹366 — lower pivot/secondary intraday support.
~₹356‑₹362 — deeper support if momentum remains weak.
📈 Resistance Levels (Upside Hurdles)
For any bounce or recovery attempt:
₹377‑₹380 — near current pivot/resistance range.
~₹390‑₹395 — next resistance zone (prior price congestion).
₹405‑₹410+ — stronger resistance (short‑term target for recovery).
🧠 Trading/Price Action Tips (1‑month)
Bullish Scenario (countertrend bounce):
A break above ₹380‑₹390 with good volume could shift short‑term sentiment and target ₹405‑₹410+.
Bearish/Continued downtrend:
If support at ₹366‑₹370 breaks convincingly, the next zone near ₹362 then ₹356–₹360 becomes focus.
INDIANB 1 Day View 📌 Indian Bank – Daily Levels (Current / Accurate)Price Reference (Recent): ~₹832–₹835 area (last updated Jan 9-Jan 12, 2026)
🔹 Daily Pivot Point
Pivot: ~₹839.3 – ₹825.6 (multiple pivot sources)
📈 Resistance Levels
R1: ~₹850.6 – ₹838 area
R2: ~₹868.3
R3: ~₹879.6
(These are the daily upside barriers where selling pressure may emerge)
📉 Support Levels
S1: ~₹821.6 – ₹814 area
S2: ~₹810.3
S3: ~₹792.6 – ₹777 area
(These are key downside floors where buyers often step in)
🧠 How To Use These Levels (Daily Trading)
Bullish view (if price holds above pivot ~₹825–839 area):
✔ Above S1 (~₹821–822) — short-term bullish continuation likely
✔ Break above R1 (~₹850) — targets R2 (~₹868) then R3 (~₹880)
Bearish view (if price breaks below daily pivot / S1):
❌ Below S1 (~₹821) — weakness could push price toward S2 (~₹810)
❌ Sustained below S3 (~₹792–₹777) — could signal deeper correction
⚠️ Quick Reminder
These technical levels are based on latest publicly available pivot analysis and may differ slightly from live real-time data on your trading platform. Always verify live quotes on your charting tool before entering trades.

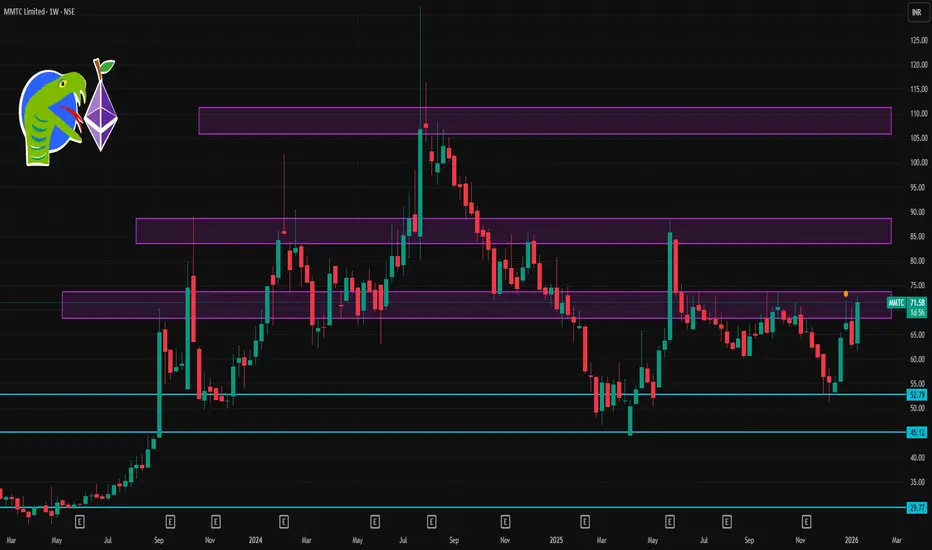
MMTC 1 Week Time Frame 📌 Current Price Snapshot
Latest traded price: ~₹71.5 – ₹72.7 on NSE today with strong intraday volatility. Daily high ~₹72.70 and low ~₹63.86.
This wide daily range suggests higher volatility this week — at least through the next few sessions.
📊 Short‑Term Weekly Levels
🔹 Resistance (Upside)
These are levels where price may face selling pressure or slow gains:
1. ₹72.5 – ₹73.0 — Immediate resistance area (today’s local high).
2. ₹75.0 – ₹76.0 — Next bullish pivot region if the stock holds above ₹72.5 (based on momentum models).
3. ₹78.0 – ₹80.0 — Stronger weekly upward pull target if bullish continuation holds.
👉 Closing above ₹75 on the weekly timeframe would indicate stronger short‑term bullish structure.
🔻 Support (Downside)
Levels where buyers may step in on pullbacks:
1. ₹66.0 – ₹67.0 — First dynamic support (near shorter moving averages).
2. ₹62.0 – ₹63.5 — Key lower support zone (recent daily lows).
3. ₹60.0 – ₹61.0 — Deeper weekly support — important to watch if breakdown accelerates.
👉 A break below ₹62 on weekly closes would weaken the bullish outlook and could open the door toward deeper supports.
📈 Technical Indicator Context
Technical breadth is largely bullish/momentum supportive:
📌 Moving Averages:
5, 10, 20, 50, 100, and 200‑day MAs all skew Buy — suggesting bullish trend alignment.
📌 RSI (14): ~65 — trending up but not yet extremely overbought.
📌 Stoch/RSI: Overbought on shorter timeframes — may hint at near‑term consolidation before higher breakout.
Summary: Momentum still skewed bullish overall, but short‑term traders should watch for near‑term pullbacks or consolidations due to overbought signals.
SOLARINDS 1 Day Time Frame 📊 Live Price Snapshot (approx)
Current NSE price: ~₹13,190 – ₹12,875 range (end of last session)
📈 Daily Pivot & Key Levels (1-Day Timeframe)
These come from recent pivot point calculations and live technical feeds:
Resistance Levels (Upside)
R1: ~₹13,577
R2: ~₹13,963
R3: ~₹14,214
(Potential upside barriers / targets)
Pivot Point
Pivot (Daily Reference): ~₹13,300 zone (approx midpoint)
Support Levels (Downside)
S1: ~₹12,940
S2: ~₹12,689
S3: ~₹12,303
(Zones where buying interest often emerges intraday)
🔍 Short-Term Bias & Indicators
Technical indicator signals today (1D):
RSI: Neutral/around mid-range → neither overbought nor oversold.
MACD: Bullish crossover on short timeframe.
Moving Averages (short & mid DMA/EMA): Mixed (some short EMAs bullish, some bearish), signaling consolidation bias around current price.
🕒 Summary for Today (1D)
Neutral to slightly bullish near current levels with balanced indicator setup
Key levels to watch:
Upside: 13,577 → 13,963 → 14,214
Downside: 12,940 → 12,689 → 12,303
Immediate pivot bias around ₹13,300 will determine intraday direction.

Nifty 50 1 Week Time Frame📌 Current Weekly Price (Live)
Nifty 50 approx ~25,730–25,740 (latest live level) — slight downside bias today.
📈 Weekly Resistance Levels (Upside)
1. 25,900 – 26,000 zone
• Immediate resistance above current price — key psychological barrier.
2. 26,100 – 26,200 zone
• Strong technical resistance (previous weekly highs & upper band).
3. 26,300+
• If breakout above 26,200 sustains, next upper resistance.
📉 Weekly Support Levels (Downside)
1. 25,600–25,650
• Near-term support from recent weekly structure.
2. 25,300–25,350
• Secondary support; zone where price has bounced previously on weekly charts.
3. 24,800–24,700
• Major structural support — breach here opens deeper correction risk.
📊 Weekly Technical Range to Watch
Neutral/Range-Bound View (Weekly):
⬆️ Bullish: Break & weekly close above 26,000–26,200
⬇️ Bearish: Break & close below 25,300–25,350
Between these levels, the index may consolidate before a clear directional move.
📌 Summary Weekly Levels (2026)
Resistance Zones
• 26,000 (key psychological)
• 26,100–26,200 (secondary)
• 26,300+ (extended)
Support Zones
• 25,600–25,650 (immediate)
• 25,300–25,350 (secondary)
• 24,800–24,700 (major)

TATAELXSI 1 Week Time Frame 📊 Current Price Context
Tata Elxsi is trading around ₹5,700 ± (mid‑Jan 2026 live levels) on NSE.
📈 Weekly Technical Levels (1‑Week Timeframe)
🔁 Pivot Point (Weekly Reference)
Weekly Pivot: ~₹5,644 – ₹5,650 (central consensus pivot area)
🔼 Resistance Levels (Upside)
Level Approx. Price What It Indicates
R1 (Weekly) ₹5,618 – ₹5,620 Initial resistance – important short‑term barrier
R2 (Weekly) ₹5,950 – ₹5,996 Higher resistance zone for weekly strength
R3 (Weekly) ₹6,300 + Strong breakout level for trend continuation
Daily range resistance ~₹5,803 – ₹5,915 Daily pivots that also act intra‑week resistance
Interpretation:
• Weekly upside will be tested if price holds above ₹5,650–₹5,700.
• Sustained closes above ₹5,950 – ₹6,000+ strengthen bullish bias for next weeks.
🔽 Support Levels (Downside)
Level Approx. Price What It Indicates
S1 (Weekly) ₹5,272 – ₹5,280 First major weekly support
S2 (Weekly) ₹5,106 – ₹5,110 Secondary support before potential breakdown
Weekly lower extreme ~₹4,680 – ₹4,700 Strong downside zone (52‑wk low area)
Daily support zone ₹5,534 – ₹5,612 Daily pivot support, relevant intra‑week
Interpretation:
• If price breaks below ₹5,270–₹5,300, the next test is ₹5,100‑₹5,000.
• A weekly close below ~₹5,000 could signal broader weakness.
📌 Quick Level Summary (weekly)
Resistance:
👉 ₹5,618 / ₹5,950 / ₹6,300+
Pivot:
👉 ~₹5,644‑₹5,650
Support:
👉 ₹5,272 / ₹5,106 / ₹4,700 area
(These are weekly pivot/swing levels used by technical traders.)

HDFCBANK 1 Month Time Frame 📌 Live price context
Current approximate price: ~₹939 on NSE (recent close).
📊 Key Short‑Term (1‑Month) Levels — Support & Resistance
🚀 Pivot & Resistance Levels
These are levels where price may face selling pressure:
Pivot: ~₹947.0 (short‑term trend reference)
Resistance 1 (R1): ~₹948 – ₹952 — immediate hurdle.
Resistance 2 (R2): ~₹957 – ₹958 — swing‑high resistance.
Resistance 3 (R3): ~₹962 – ₹965 — stronger upper band if bulls accelerate.
📌 Note: Above ₹965‑₹970, broader 1‑month upside attempts could gain steam, but requires fresh buying.
🛡️ Support Levels
These are key demand zones where price may find buyers:
Support 1 (S1): ~₹941 – ₹935 — initial buffer on recent lows.
Support 2 (S2): ~₹930 – ₹923 — deeper support if corrective momentum continues.
Support 3 (S3): ~₹914 – ₹915 — longer‑range downside pivot zone.
📌 A break below ~₹923‑₹920 enhances the risk of extended corrective moves on the 1‑month chart.
📉 Technical Indicators (Short‑Term Bias)
RSI is very low (~26) — suggests oversold conditions in the short term.
Price is below major EMAs (20/50/100/200), signaling bearish short‑term momentum.
MACD is negative — weak momentum.
👉 This combination typically means selling pressure is dominant, but sharp oversold readings may also set up short‑term bounce attempts.
📈 1‑Month Trading Interpretation
Bullish scenario (if trend shifts):
Sustained move above ₹952‑₹958 could then target ₹965‑₹970 as the next upside zone.
Bearish scenario (more likely given current price action):
A break below ₹930 increases the probability of deeper pullbacks toward ₹923 and possibly ₹914‑₹910 levels.

BTC/USD 1 Month Time Frame 📊 Current Price Snapshot (Latest Available)
$90,478.00
📊 1‑Month Key Levels — BTC / USD
🛑 Resistance Levels (Upside)
These are areas where price has struggled to break above recently:
1. Major Resistance: ~$108,000–$112,000
• Multiple tests and sellers here — strong supply zone.
2. Intermediate Resistance: ~$100,000
• Psychological barrier and past pivot point.
💡 A successful break above these could signal bullish continuation and a shift in momentum.
🟩 Support Levels (Downside)
These are floors where price tends to stabilize or bounce:
1. Immediate Support: ~$84,000–$87,000
• Critical support zone on monthly chart — losing this could strengthen bearish momentum.
2. Secondary Support Zone: ~$80,000
• Structural support from past price action.
3. Lower Support: ~$75,000
• Major defense area if broader sell‑offs continue.
📉 If these support levels break decisively with volume, risk increases for deeper pullbacks.
📌 How to Use These Levels
🕐 1‑Month Time Frame Interpretation
Bullish bias if BTC holds above ~$90k–$100k, especially with higher highs.
Neutral / Range‑bound if price oscillates between ~$84k–$108k.
Bearish bias if BTC breaks below ~$84k with conviction (higher volume and clear close below).
These levels reflect recent technical structure and psychological zones, commonly used by traders to set entries, exits, and risk management.

REDINGTON 1 Week Time Frame 📌 Weekly Pivot‑Based Levels (from Moneycontrol weekly pivots)
(These are derived from weekly price action, giving support & resistance zones used by chart traders)
Resistance (Weekly)
R1: ~ ₹282.77
R2: ~ ₹289.23
R3: ~ ₹300.12
Pivot (Weekly Reference):
Pivot Point: ~ ₹271.88
Support (Weekly)
S1: ~ ₹265.42
S2: ~ ₹254.53
S3: ~ ₹248.07
📊 Interpretation:
Above ₹282–₹289 zone → broader weekly bullish bias if sustained toward ₹300+.
Below ₹265–₹271 pivot/support zone → weekly downside risk increases.
📊 Current Price Reference
NSE live price is trading around ~ ₹289–₹290+ on 8 Jan 2026.
📊 Summary – Key Weekly Levels to Watch
Level Price (Approx) Significance
Weekly Resistance 3 (R3) ₹300.12 Bullish breakout region
Weekly Resistance 2 (R2) ₹289.23 Near current price – short‑term hurdle
Weekly Resistance 1 (R1) ₹282.77 First weekly resistance
Weekly Pivot ₹271.88 Trend reference – bulls above
Weekly Support 1 (S1) ₹265.42 Key downside support
Weekly Support 2 (S2) ₹254.53 Deeper support
Weekly Support 3 (S3) ₹248.07 Extended downside support
📌 Bullish weekly bias is intact as long as price stays above the weekly pivot (~₹271‑₹272) and clears ₹282‑₹289 convincingly. Below ₹265, the next support zone becomes active.
