MARUTI 1 Month Time Frame 📊 Key Metrics
Current price around ₹16,000 region.
One-month return: approximately –2.5% to –3%.
52-week high around ~₹16,660 and low around ~₹10,725.
🔍 Approximate Support & Resistance Levels (1-month timeframe)
From recent charts and technical data:
Immediate resistance: ~ ₹16,172 (R1), then ~ ₹16,368 (R2) and ~ ₹16,585 (R3)
Immediate support: ~ ₹15,759 (S1), then ~ ₹15,542 (S2) and ~ ₹15,346 (S3)
Pivot zone: ~ ₹15,955
Chartpattren

BEL 1 Month Time Frame📌 Key Levels & Observations
Current price: approximately ₹ 416.35 per share.
Recent range: Daily highs ~₹ 423–424, lows ~₹ 415.50.
52-week high ~₹ 436 and 52-week low ~₹ 240.25.
🎯 Short-Term (1-Month) Important Levels
Support zone: ~₹ 405-410 — falling below this may weaken short-term structure.
Resistance zone: ~₹ 430-435 — breaking above this could open scope toward ₹ 440.
Near-term target range: If bullish momentum holds, look toward ~₹ 430-440.
Risk zone: If momentum falters and the support zone fails, price may drift back toward ~₹ 400 or lower.
⚠️ Caveats
These levels are technical estimates, not fundamental valuations or guarantees.
Market sentiment, order flows (for BEL), defence‐policy changes, etc. can shift the picture quickly.
Always use stop-loss or risk controls.

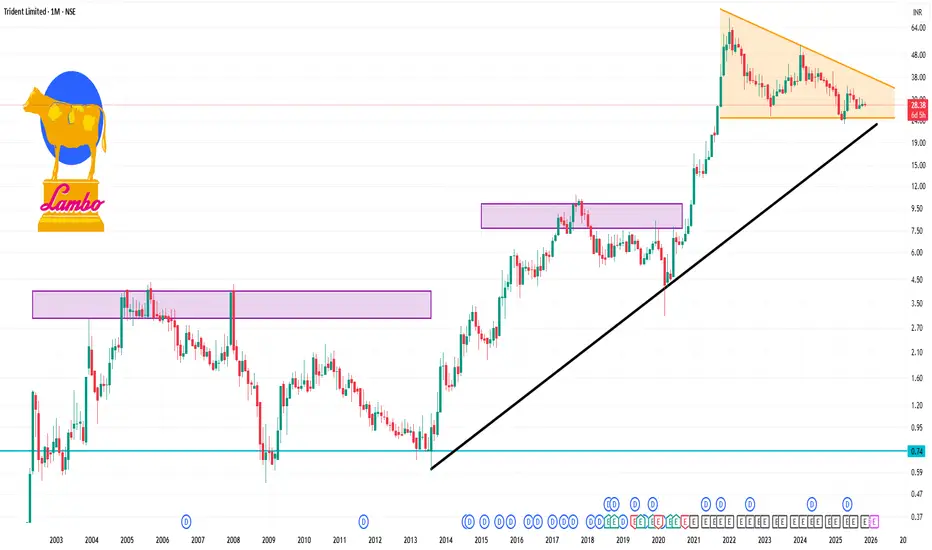
TRIDENT 1 Month Time Frame ✅ What we see
Fundamentals
Current price ~ ₹28.38.
Market cap ~ ₹14,462 cr, P/E ~32.8×, P/B ~3.15×.
ROE quite low (~8-10% range) and growth over past years has been muted.
52-week high ~ ₹40.20, 52-week low ~ ₹23.11.
Recent quarterly figures: sales up modestly; profits under pressure.
Technical / Price context
The share is nearer to its 52-week low than high, which may offer perceived value to some.
Some moving-average crossovers (per reports) flagged “sell signals” in short term.
Short-term return in past month has been very small (~0.64% 1-month return).
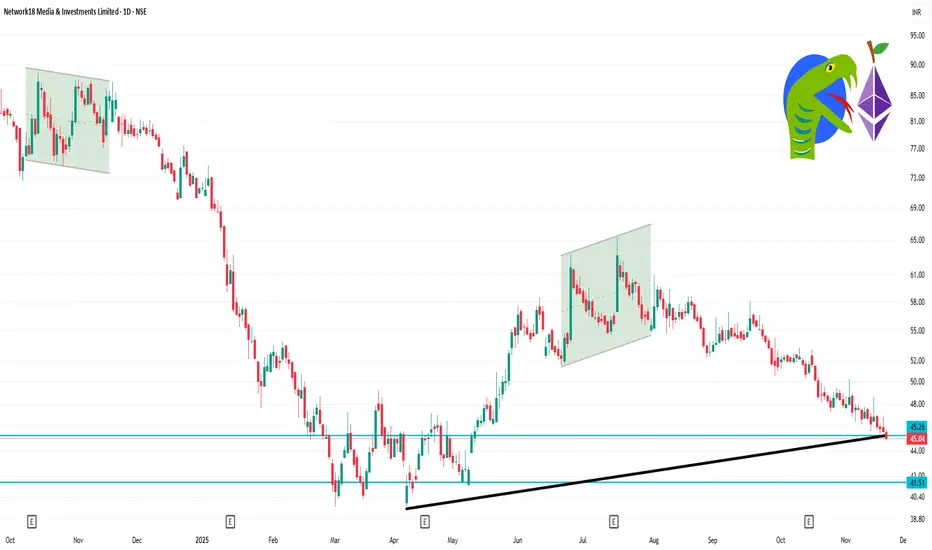
NETWORK18 1 Day Time Frame Current Price: ~ ₹ 45.04.
Day’s Range: ~ ₹ 44.89 (low) to ₹ 45.76 (high)
Key Support Level: Around ₹ 44.50-45.00 — if price breaks below this, further downside may open.
Key Resistance Level: Around ₹ 46.50-47.00 — if price breaks above this with volume, upside potential may resume.
52-week range: Low ~ ₹ 39.66, High ~ ₹ 85.39.
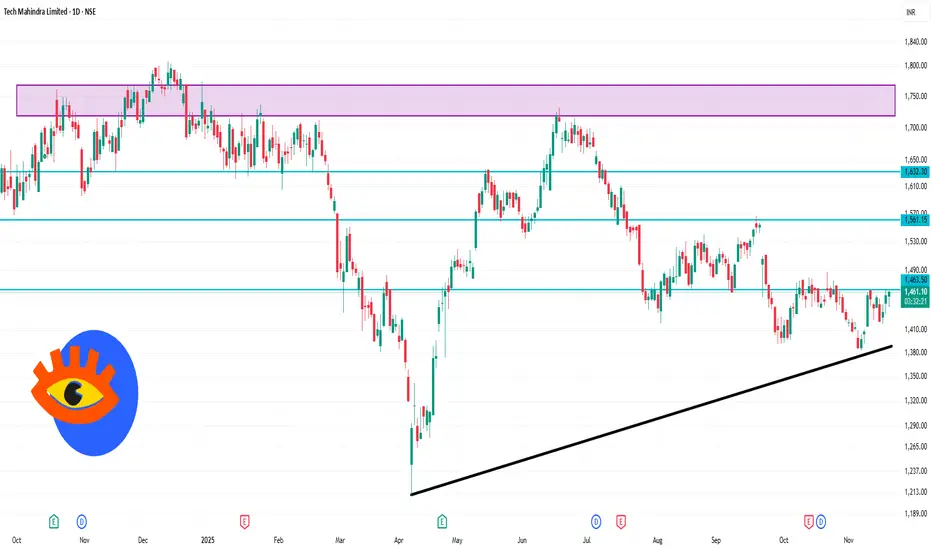
TECHM 1 Day Time Frame 📌 Current Snapshot
Last traded price: ~ ₹1,461.30 (as of ~11:54 AM IST)
Day’s range: ~ ₹1,440 (low) to ~ ₹1,461 (high)
52-week range: low ~ ₹1,209.40, high ~ ₹1,807.70
🔍 Short-term Levels to Note
Support zone: ~ ₹1,440 — this is near the day’s low.
Resistance zone: ~ ₹1,465–₹1,470 — given the current price is ~₹1,461, this is where some upward friction may occur.
If price breaks below support (~₹1,440), next support could be around ~ ₹1,420–₹1,430 (based on recent intraday lows).
If it breaks above the resistance zone (~₹1,470+), the next meaningful level could be ~ ₹1,500 (psychological + round number) or higher.
TVSMOTOR 1 Day Time Frame 📌 Key levels (approximate)
Pivot (classic) for recent day: around ₹ 3,408.73.
Resistance levels:
R1 ≈ ₹ 3,448.47
R2 ≈ ₹ 3,510.43
R3 ≈ ₹ 3,550.17
Support levels:
S1 ≈ ₹ 3,346.77
S2 ≈ ₹ 3,307.03
S3 ≈ ₹ 3,245.07
🎯 What to watch for possible trade decisions
Bullish scenario: If price breaks above the pivot (~₹3,409) and holds above R1 (~₹3,448), a move toward R2 (~₹3,510) or higher may be possible.
Bearish scenario: A break below S1 (~₹3,347) could open risk toward S2 (~₹3,307) or S3 (~₹3,245).
Neutral/Ranging: The stock may also trade between ~₹3,347 and ~₹3,448 while the trend remains unclear.

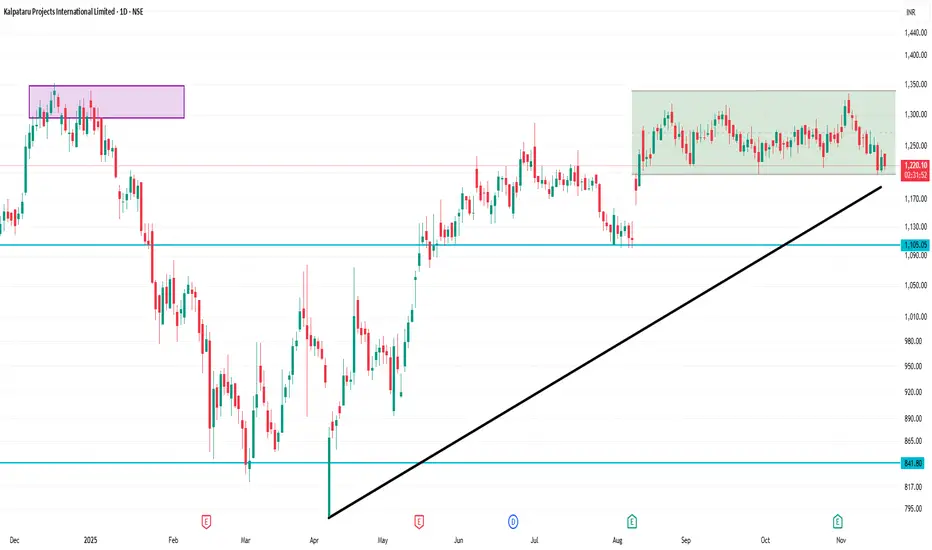
KPIL 1 Day Time Frame 📊 Current Price
Last traded around ₹1,226.90 (as of about 11:58 AM IST on 20 Nov 2025) on NSE.
Day’s low ≈ ₹1,213.10, day’s high ≈ ₹1,239.30.
52-week range: Low ~ ₹786.30, High ~ ₹1,352.85.
✅ Interpretation & Notes
The stock is hovering near the ~₹1,225 level — which is near the 100-day MA, so it’s at a kind of technical crossroads.
With the price range for the day being relatively narrow (~₹1,213 to ~₹1,239), it suggests limited intraday volatility so far.
The gap between recent price and 52-week high (~₹1,352) indicates potential upside but that will depend on catalyst and momentum.
However, if the stock fails to hold above the ~₹1,200 support zone, it could drift toward weaker levels.
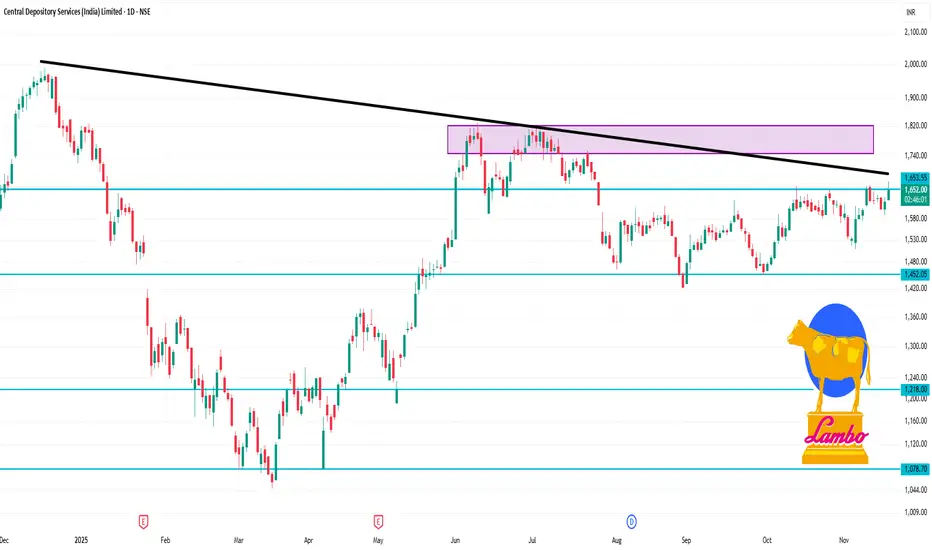
CDSL 1 Day Time Frame Stock Price & Day’s Range
The share price is approximately ₹1,625.80 on the NSE.
The day’s trading range is roughly ₹1,616 to ₹1,648.80.
52-week range: about ₹1,047.45 (low) to ₹1,989.80 (high).
On a 1-day time-frame perspective
From an intraday point of view, the range (~₹1,616-1,649) shows the market is consolidating rather than making a sharp breakout or breakdown.
Key levels to watch intraday:
Support: around the lower end of the day’s range (~₹1,616).
Resistance: near the upper end (~₹1,648.80) for now.
If price breaks above ₹1,650 convincingly with volume, it might trigger further upside intraday; conversely a break below ~₹1,610 could signal intraday weakness.
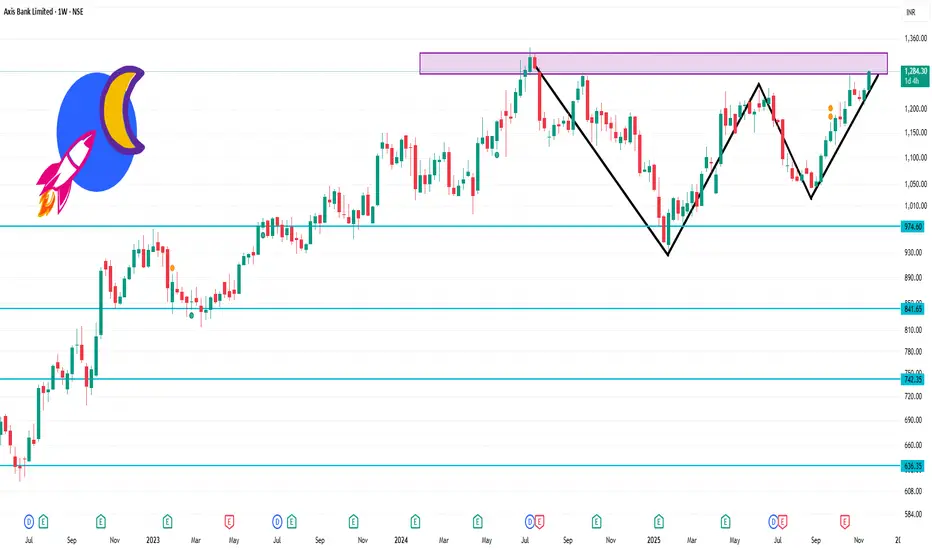
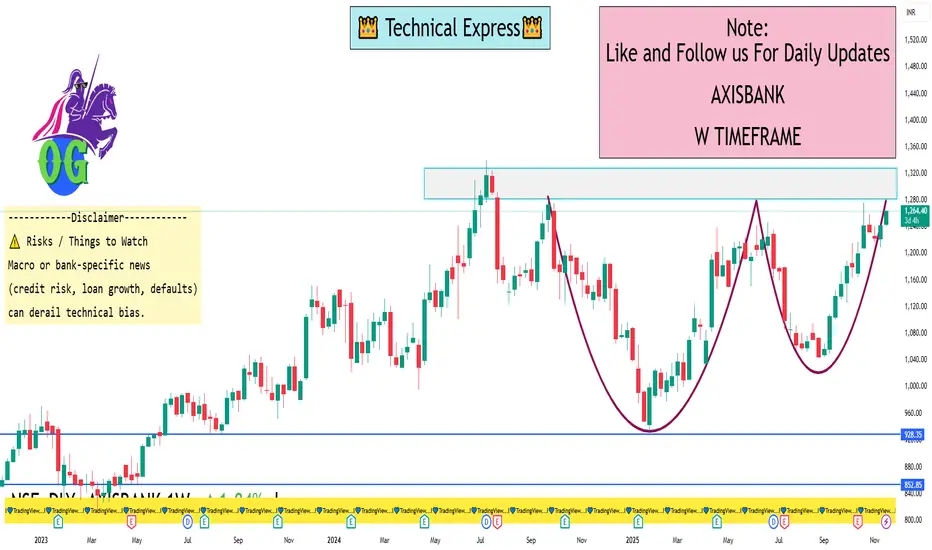
AXISBANK 1 Week Time Frame 🔍 Key Levels for the Week
Based on recent pivot/technical data:
Resistance levels: ~ ₹1,276 to ₹1,282 (around daily R1/R2)
Higher resistance: ~ ₹1,290-₹1,302 if uplink happens
Support levels: ~ ₹1,252-₹1,246 as near-term floor
Broader weekly support: ~ ₹1,232-₹1,218 region if deeper pullback
⚠️ Things to keep in mind
Current price is near the 52-week high region (~₹1,284) which increases risk of resistance/strain.
Short-term signals/pivots are useful but market news, macro banking events, FII/DII flows can quickly shift dynamics.
Use stop-losses or risk-controls if trading around these levels given the tight range and possible whipsaw.
CAMS 1 Week TIme Frame 📊 Key current context
The stock is trading around ₹4,020 to ₹4,040 (approx).
52-week range: ~₹3,031 (low) to ~₹5,367 (high).
Technical pivot data shows weekly support/resistance and pivot levels.
If price holds above ~₹3,900-₹4,000 zone and shows strength, a move toward ~₹4,100-₹4,150 is plausible.
If price breaks below ~₹3,900 decisively, then ~₹3,800 and even ~₹3,670 could become the next zones to watch.
Break above ~₹4,150-₹4,200 would increase odds of testing ~₹4,300-₹4,400 zone.
⚠️ Things to watch & caveats
The technical levels are approximate and different sources give slightly different numbers; always use stop-loss discipline.
Weekly charts smooth out short-term noise, but in volatile sectors things can move fast.
Always check for upcoming news, earnings, macro conditions, as these can override technicals.
These levels are not guaranteed entry/exit signals — treat them as potential zones.

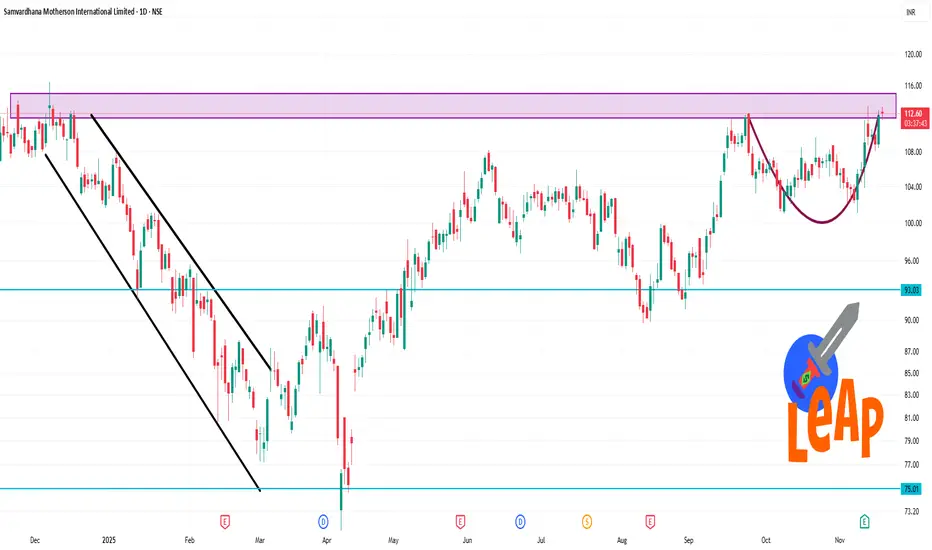
MOTHERSON 1 Day Time Frame 📊 Latest Price & Range
Last traded around ₹112.40 (as of 20 Nov 2025) on NSE.
Day’s intraday high ~ ₹113.39, intraday low ~ ₹111.78.
52-week range: ~₹71.50 (low) to ~₹116.38 (high).
✅ What to Watch Today
If price holds above ~₹112.50 and moves toward ~₹113.50-₹115, bullish bias.
If price fails to hold support near ~₹111.50 or drops below ~₹110, risk of pull-back.
Volume & broader auto-ancillaries sector trend will matter — weak sector may weigh.
Time-frame is short (intraday / daily) so tight stops and quick reactions recommended.
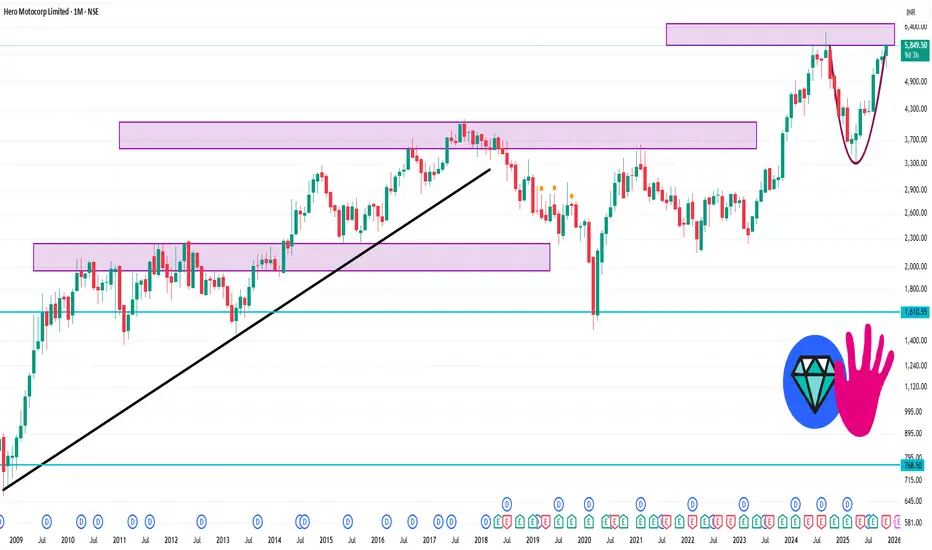
HEROMOTOCO 1 Month Time Frame 🎯 Key Price Levels (1-Month Timeframe)
Here are approximate support & resistance levels you may watch in the next month:
Resistance levels:
~ ₹5,850-₹5,900: Price is already trading around this band (Trendlyne shows ~₹5,850).
Next major resistance might lie closer to ~ ₹6,000-₹6,100 if momentum carries on (psychological level + prior swing highs).
Support levels:
First major support: ~ ₹5,600-₹5,650 (just under current trading zone)
Secondary support: ~ ₹5,300-₹5,400 zone — a deeper pull-back level if the first support gives way.
Pivot / mid-zone:
A pivot or neutral zone around ~ ₹5,700-₹5,800 may act as a battleground between bulls & bears.
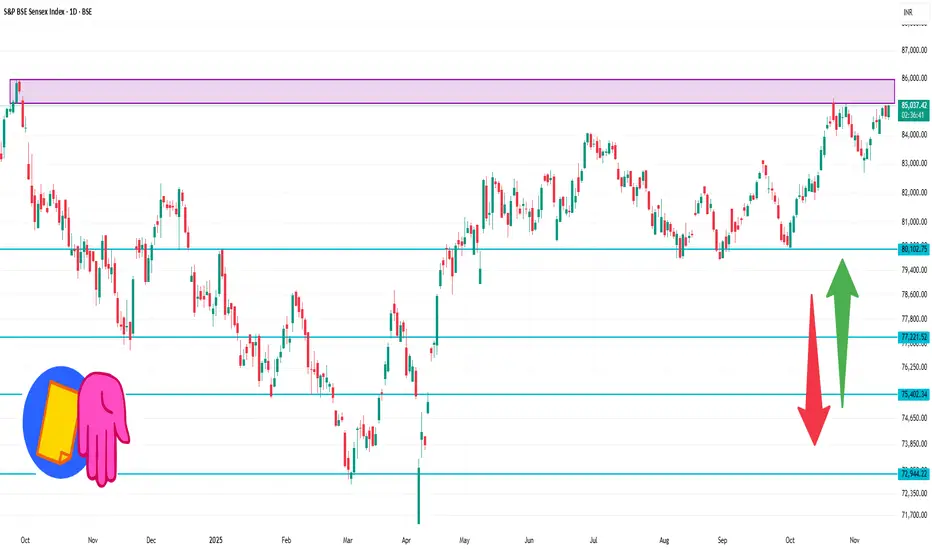
Sensex 1 Day Time Frame ✅ Current value
The index is trading around ~ 85,040 points.
Today’s high has been ~ 85,080 and low ~ 84,525.
📍 Key pivot & support/resistance levels (Daily)
From recent technical data:
Pivot Point: ~ 84,757.93
Resistance 1 (R1): ~ 84,957.50
Resistance 2 (R2): ~ 85,241.98
Support 1 (S1): ~ 84,473.45
Support 2 (S2): ~ 84,273.88
Support 3 (S3): ~ 83,989.40
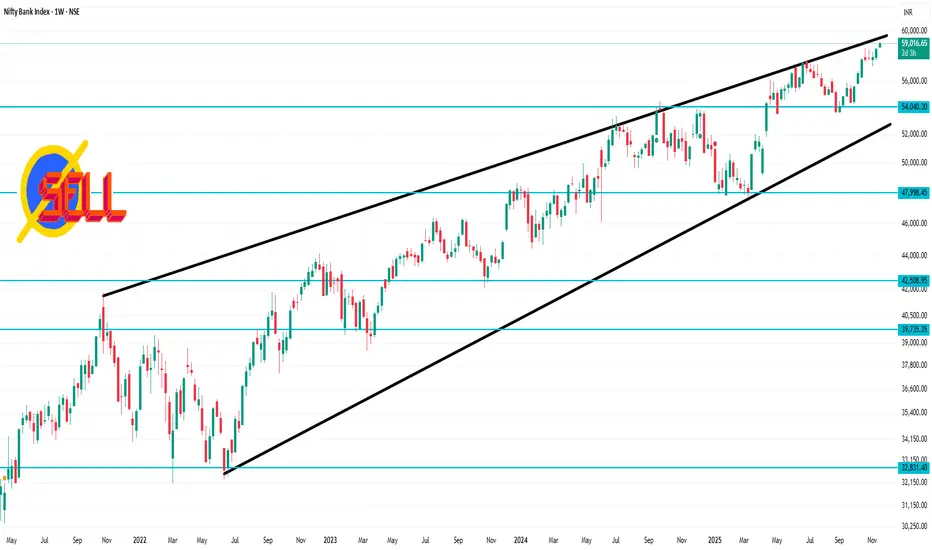
Bank Nifty 1 Week Time Frame🔍 Current snapshot
The index is trading around ~ 58,900-59,000 points.
It recently hit a fresh all-time high of around 59,100 points in recent sessions.
The structure shows it is near upper-resistance territory and signs of short-term exhaustion appear.
✅ Key Weekly Time-Frame Levels
Resistance zones
~ 59,100 – 59,300 points: This is the immediate upper resistance (recent ATH level) which bulls need to clear for a fresh leg up.
On a breakout above ~59,300, the next psychological target zone might be ~59,500-60,000+.
Support zones
~ 58,600 – 58,300 points: A key near-term support zone. Breakdown below ~58,800 may trigger weakness toward this zone.
A stronger support below that is around ~ 57,500 – 57,200 points, which becomes relevant if heavy selling or structural break occurs.
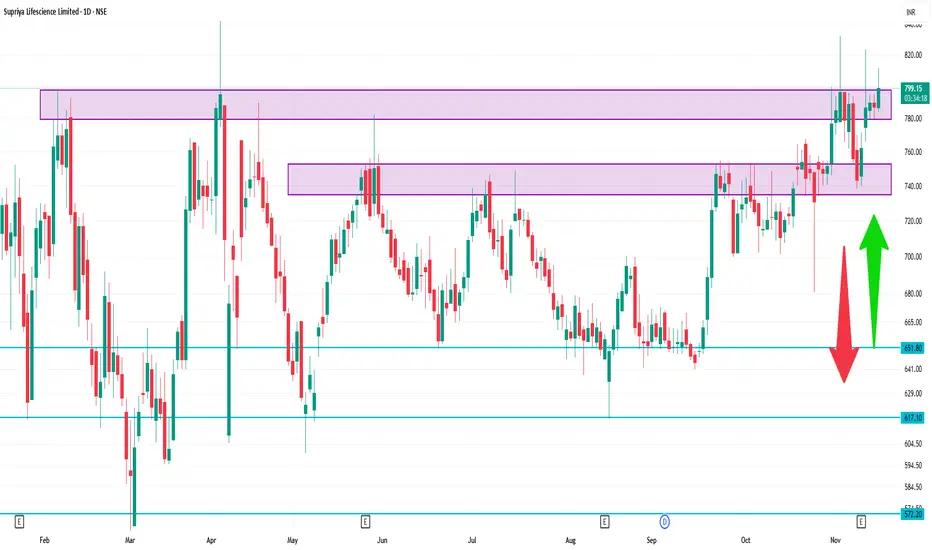
SUPRIYA 1 Day Time Frame Level ✅ Latest Price Snapshot
Most recent price: ~ ₹ 789.70 according to Groww.
Previous close in other sources: ~ ₹ 743.35 (Moneycontrol) for an earlier timestamp.
Day’s trading range (recent): ~ ₹ 779.45 – ₹ 795.10
📊 Key Levels (1-Day)
From recent pivot, support & resistance calculations:
Pivot / central range
Daily pivot approx: ~ ₹ 792.05
Another reference: pivot ~ ₹ 782.65
Resistance levels
R1 ~ ₹ 803 (approx)
R2 ~ ₹ 816
Longer-term upper band: ~ ₹ 842 (52-week high)
Support levels
S1 ~ ₹ 769
S2 ~ ₹ 748
S3 ~ ₹ 735
BEL 1 Day Time Frame 🔍 Current Context
The last quoted price for BEL was around ₹424.55 on the NSE.
The recent day-range (low to high) is approx ₹424.20 to ₹429.40.
52-week high ₹436.00 and low ~ ₹240.25.
🎯 Key Technical Levels (1-Day Chart)
Here are approximate support/resistance levels for the day, based on the recent range and price action:
Major Resistance: around ₹430 to ₹433 — price has approached this zone recently, so it’s an upper hurdle.
Immediate Resistance: near ₹429 to ₹430 given recent high of ~₹429.40.
Current Price Floor / Near Support: around ₹424 to ₹422 — the region where price is trading now.
Strong Support: around ₹417 to ₹420 — this would act as next key floor if the current support fails.
Lower Support / Risk Zone: ~ ₹410 to ₹412 — if price breaks down further, this zone could become relevant.

AXISBANK 1 Week View 📌 Key Levels & Data
Latest price roughly ₹1,250-₹1,260 per share.
52-week high ~ ₹1,276.10.
52-week low ~ ₹933.50.
Weekly (20-period) moving average ~ ₹1,143.27.
Weekly Bollinger Bands: Upper band ~ ₹1,285.22, Lower band ~ ₹1,001.32.
Weekly Pivot levels (Classic):
Pivot ~ ₹1,232.33
R1 ~ ₹1,255.27, R2 ~ ₹1,268.93, R3 ~ ₹1,291.87
Support S1 ~ ₹1,218.67, S2 ~ ₹1,195.73, S3 ~ ₹1,182.07
⚠️ Risks / Things to Watch
Macro or bank-specific news (credit risk, loan growth, defaults) can derail technical bias.
If weekly candle closes strongly below the 20-week SMA (or lower support), it could invalidate the bullish case.
Volume confirmation: For a strong breakout or pullback, check weekly volume — weak volume may lead to false moves.
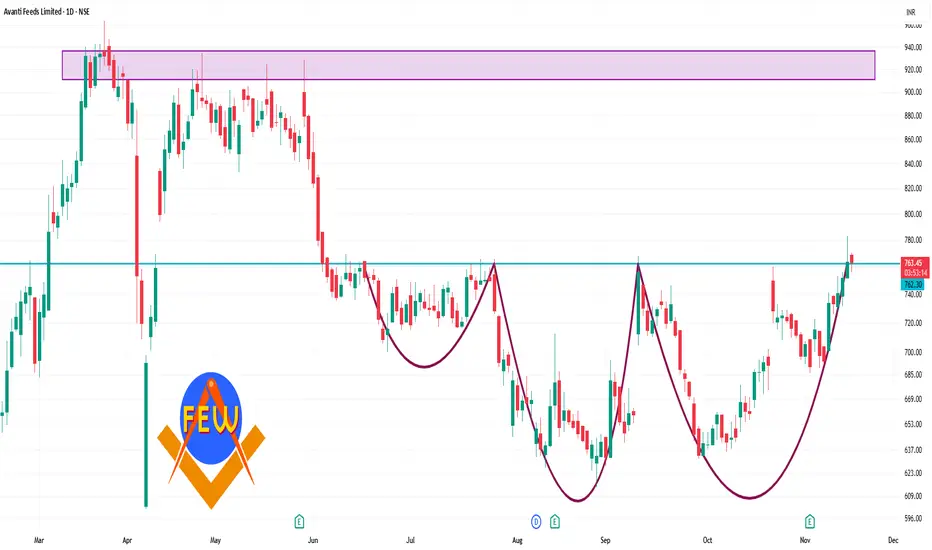
AVANTIFEED 1 Day Time Frame 🔍 Key Levels
Pivot (Daily): ~ ₹ 746.47
Resistance levels:
R1 ~ ₹ 761.48
R2 ~ ₹ 770.92
R3 ~ ₹ 785.93
Support levels:
S1 ~ ₹ 737.03
S2 ~ ₹ 722.02
S3 ~ ₹ 712.58
✅ Interpretation & Use
If price holds above ~₹ 746.47 and shows strength, the next meaningful resistance zone is ~ ₹ 761-771.
If price drops below the pivot, then supports around ~ ₹ 737, and further down ~ ₹ 722 or ~ ₹ 712 become relevant.
The momentum indicators (RSI ~67.6, MACD positive) suggest bullish bias but note: when RSI gets high → risk of pull-back increases.
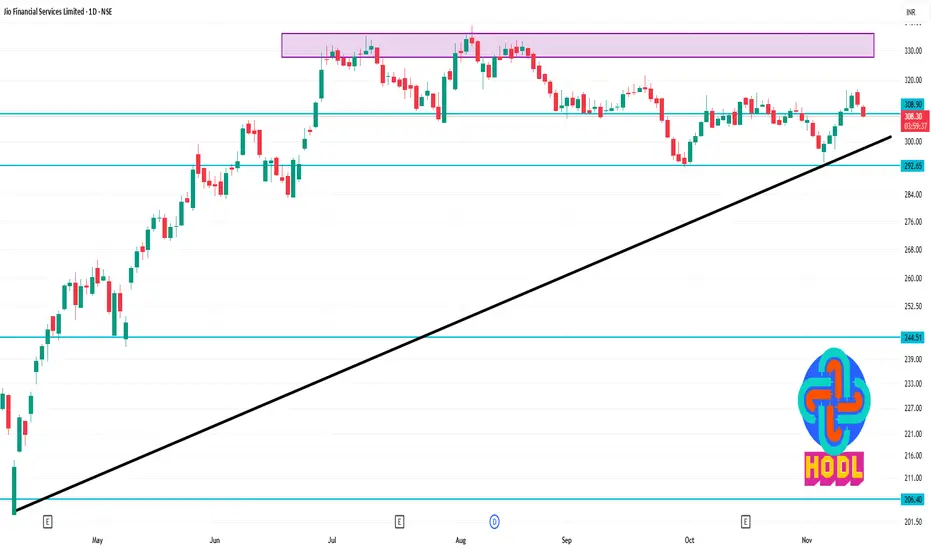
JIOFIN 1 Day Time Frame 📊 Key Daily Levels (1-Day Timeframe)
1. Support Levels
~ ₹309.8 — identified by Research360 as a support.
~ ₹307.6 — second support per Research360.
~ ₹304.1 — a lower support per pivot-point analysis.
Broader support zone (per some analysts) lies around ₹305–325, but for day trading, the ~304–310 area is more relevant.
2. Resistance Levels
~ ₹315.5 — first resistance per pivot analysis.
~ ₹319.0 — second resistance point per the same.
~ ₹321.2 — third resistance.
3. Pivot / Reference
Daily central pivot is ~ ₹313.3 (from pivot-point analysis).
Motilal Oswal’s pivot point (daily) is ~ ₹308.
4. Trend and Indicators
According to Investing.com, the technical indicators on daily chart lean strong buy.
On Research360, the RSI is around ~56 (neutral-bullish).
5. Larger View / Risk Zone
According to a TradingView analysis, there's a potential short-term dip toward ₹285–290 area if the current structure breaks down.
On the upside, that same analysis believes medium-term targets could go to ₹335+ if a breakout happens.
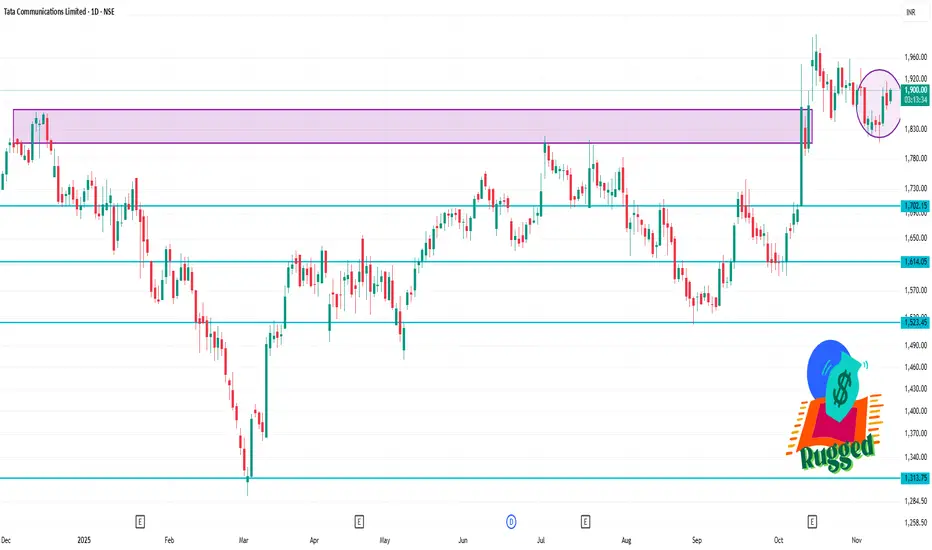
TATACOMM 1 Day Time Frame 🎯 Key Levels
Current price (recent quote): ~ ₹1,876.
Pivot levels (daily classic):
Pivot ≈ ₹1,895.73
Support 1 (S1) ≈ ₹1,890.36
Resistance 1 (R1) ≈ ₹1,900.86
Additional support/resistance: S2 ≈ ₹1,885.23, R2 ≈ ₹1,906.23
Moving Average supports:
50-day SMA ≈ ₹1,858.81
100-day SMA ≈ ₹1,882.54
200-day SMA ≈ ₹1,846.83
✅ Trading Implications
If the stock manages to break and hold above the pivot (~₹1,895.7), then the next target is near ₹1,900–₹1,906 (R1/R2 area).
If it fails and drops below support levels (~₹1,890 and ~₹1,885), then watch for deeper support around the 50-day SMA (~₹1,858) or even ~₹1,846 (200-day SMA) in a more significant correction.
Given the bullish indicators, the preferred scenario is a break to the upside, but one must be aware of risk of reversal/weakness if momentum fades.
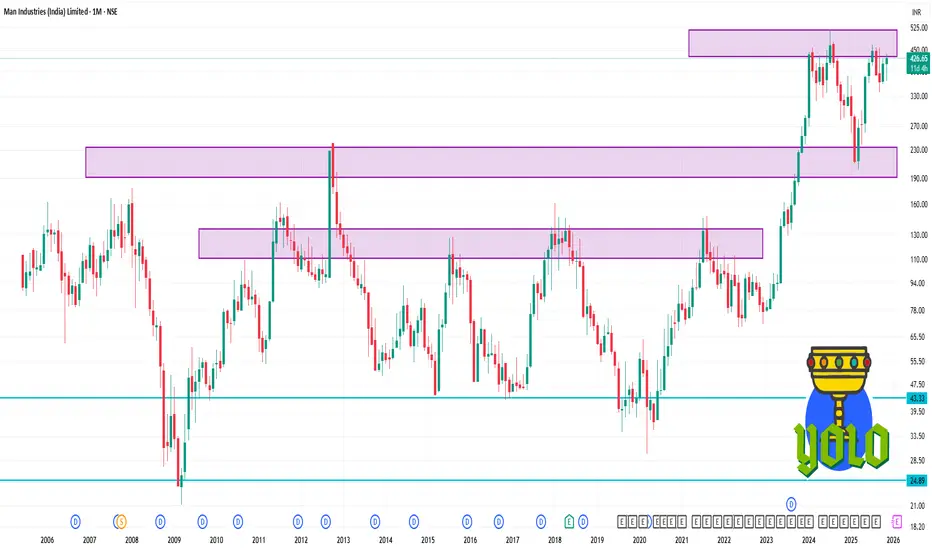
MANINDS 1 Month Time FrameCurrent Context
1. Stock Price: As of mid-November 2025, Man Industries is trading around ₹426–433.
2. 52-Week Range: Its 52-week low is ~₹201.55, and the high is ~₹468.
3. Business: It manufactures large-diameter LSAW and HSAW steel pipes for oil, gas, water, etc.
4. Financial Outlook: According to Tickertape, the company claims a strong order book (~₹4,700 Cr) and ongoing capex projects.
5. Regulatory Risk: Very importantly — SEBI has barred Man Industries and three top executives from the securities market for 2 years, for alleged fund diversion.
Risks
The SEBI ban is not just reputational — it's a major governance red flag.
If execution of orders slows, or costs escalate, profitability could suffer.
Liquidity risk: being a mid/small-cap pipe manufacturer, it may have volatility.
Macro risk: demand for large-diameter steel pipes is tied to sectors like oil & gas, infrastructure, which can be cyclical.
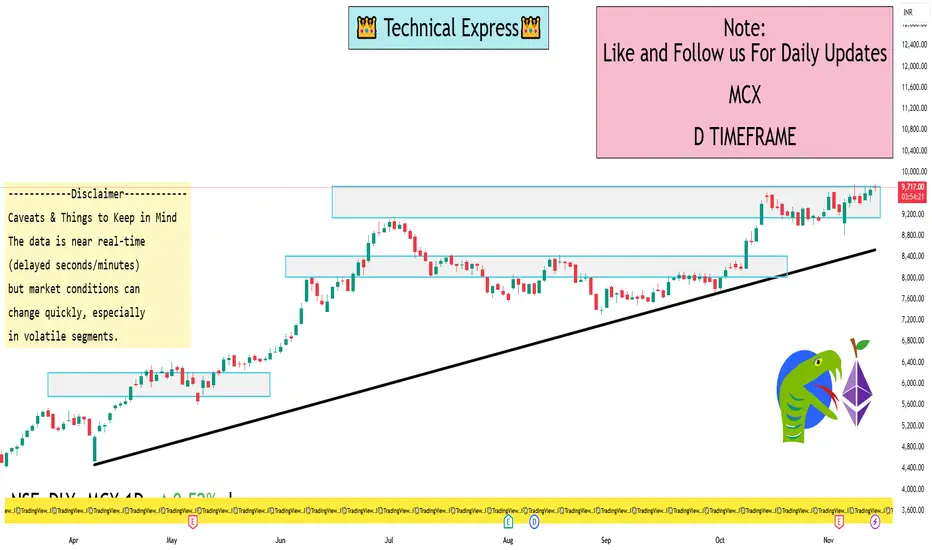
MCX 1 Day View Last traded price: ₹9,738.50 on 17 Nov 2025 (approx)
Previous day close: ~ ₹9,666.50
Day high so far: ~ ₹9,786.00
Day low so far: ~ ₹9,640.00
52-week high: ~ ₹9,786.00, 52-week low: ~ ₹4,408.15
One-Day Time-Frame Level Observations
The price is very near its recent all-time/52-week high (~₹9,700+), so there may be resistance around the recent high zone (~₹9,700-9,800).
It has already had an intraday high around ~₹9,744 today, so any breakout beyond that may open upside potential; conversely, dropping below the intraday low (~₹9,439) may indicate weakness.
Given its high valuation (P/E ~70.8x according to recent data) and that the stock is at a high level, one might be cautious of a pull-back risk or consolidation.
Caveats & Things to Keep in Mind
The data is near real-time (delayed seconds/minutes) but market conditions can change quickly, especially in volatile segments.
Even though the one-day frame gives a useful short-term view, longer-term fundamentals (earnings, growth, regulatory risk) matter for sustainability.
For example: Recently MCX had a system outage / capacity-breach that drew regulatory attention.
Also, brokerage views differ: One report noted a lower target for MCX despite the high latest price.
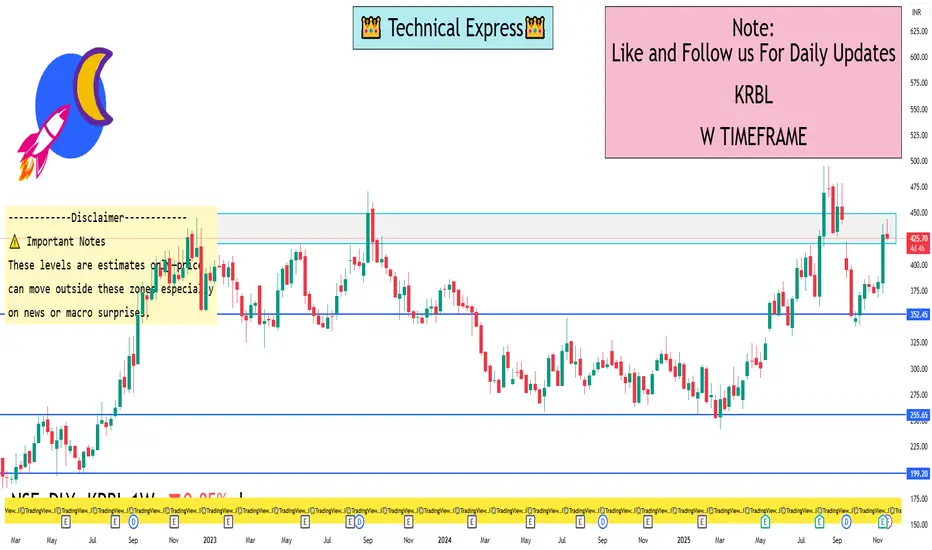
KRBL 1 Week View 🔍 Current data snapshot
Last quoted price: ~ ₹ 425 to ₹ 430.
Recent high trades around ~ ₹ 443.90 (1-day high) and low around ~ ₹ 424-425.
On the weekly view, the stock is in an upward leg, with recent momentum.
📊 1-Week Timeframe Support & Resistance Estimate
Support zone: ~ ₹ 410-420 — a near-floor based on recent consolidation around ~₹ 424-425.
Key pivot zone: ~ ₹ 430-435 — if price stays above this range, the short-term bullish bias remains intact.
Resistance zone: ~ ₹ 450-460 — an approximate upper barrier if momentum continues; the chart mentions ~₹ 480-490 as a broader resistance.
⚠️ Important Notes
These levels are estimates only—price can move outside these zones especially on news or macro surprises.
Use this as part of broader strategy (volume, trend, risk management) rather than relying solely on the levels.
Because the stock just bounced strongly, the risk of a short-term pullback to support is present.