EIFFL 1 Week Time Frame 📊 Current Price Context
Recent prices have been in the ~₹250-₹260 range recently.
📈 1-Week Key Levels (Short-Term Focus)
🔹 Immediate Resistance
~₹258–₹260 – first hurdle where buyers may face supply.
~₹264–₹269 – next upside zones if the stock clears the first resistance.
🔻 Support Zones
~₹247–₹248 – initial support area on week view.
~₹242–₹240 – secondary support if weakness extends.
~₹232–₹236 – deeper support on extended pullbacks.
📌 Pivots vary by provider, but overall the ~₹247-₹260 band is key this week for intraday traders.
📉 Short-Term Technical Lean
Most short-term indicators are mixed to slightly bearish/momentum weak (RSI around mid-range, volume not strong), though moving averages near current price keep it range-bound.
This suggests higher probability of sideways trading in the next few days unless there’s a substantial catalyst.
🧠 What to Watch This Week
✔ Break above ₹260-₹264 — could be early sign of strength.
✔ Drop below ₹247 — puts focus on lower supports near ₹240-₹235.
✔ Volume expansion on either move — strengthens that breakout/breakdown.
Chartreading

GPIL 1 Day Time Frame 📊 Current Price Snapshot (India)
• GPIL current live price: ~₹250–₹265 range in latest sessions (previous close ~₹250.97 to ~₹262.6 in intraday updates) — this can vary minute-by-minute during market hours.
• 52-week range: ₹145.75 (low) / ₹290.00 (high).
🔎 Daily Pivot Support & Resistance Levels (1-day time frame)
📍 These levels are typically computed from the prior day’s high, low & close and are key short-term reference points:
Classic Pivot (Key Levels)
• R3: ~₹267.07
• R2: ~₹259.48
• R1: ~₹253.97
➡️ Pivot Point (PP): ~₹246.38
• S1: ~₹240.87
• S2: ~₹233.28
• S3: ~₹227.77
✔ Interpretation:
Price above Pivot (~₹246–248) → short-term bullish bias.
Price bounces off S1/S2 → potential support zones if weakness continues.
Break above R2/R3 → stronger continuation of upward momentum.
📈 Alternate Pivot Reference (Daily Standard / Fib Levels)
Another pivot provider suggests similar short-term zones (approx):
• S3 ~₹242.60
• S2 ~₹250.21
• S1 ~₹254.60
• Pivot (CPR mid): ~₹254.60
• R1 ~₹262.21
• R2 ~₹266.60
• R3 ~₹274.21
📌 Moving Averages & Indicators (for context)
• 20/50/100/200 day EMAs are all clustered around mid-to-upper ₹240s–₹250s region — indicating neutral to mixed momentum on daily time frames.
• RSI ~47–48 suggests neutral momentum (neither strongly overbought nor oversold).
📍 What This Means for Today’s Trading
Bullish near-term scenario (price holds above pivot):
✔ If GPIL stays above ₹246–₹250, look for upside toward:
• R1 ~₹254–₹255
• R2 ~₹259–₹262
• R3 ~₹266–₹270+
Bearish near-term scenario (break below support):
✔ If price slips below ₹241–₹237 area:
• S2 ~₹233
• S3 ~₹227+
These levels can act as short-term support zones for pullbacks.

BRITANNIA 1 Month Time Frame 📍 Current Price & Range (approx)
Current share price around ₹5,800–₹5,900 (varies intraday) as of early Feb 2026.
1-month price action has seen modest pullbacks and minor swings around this zone.
📊 Key Levels to Watch (1-Month Timeframe)
🧱 Support Levels
These are price zones that may act as a floor if the stock corrects further:
Support 1: ~₹5,838 – immediate support region.
Support 2: ~₹5,790–₹5,800 — lower support cluster.
Support 3: ~₹5,720–₹5,760 — deeper short-term floor.
💡 If price dips below ₹5,720 with strong volume, it could signal a deeper correction.
🚧 Resistance Levels
These are upside barriers that may hold unless bullish momentum continues:
Resistance 1: ~₹5,944–₹5,950 — first upside hurdle.
Resistance 2: ~₹6,000–₹6,010 — psychological barrier near round number.
Resistance 3: ~₹6,050–₹6,060 — higher resistance level.
📈 Short-Term Trend Notes
Price has shown neutral/weak trend signals recently (mixed technical indicators around weekly charts).
Over last 1 month, price range has mostly stayed between ~₹5,780 and ~₹6,050 — a useful intraday/trading range.
🗓️ How to Use These Levels
Intraday traders: Watch pivot points around ₹5,880–₹5,900 with quick trades around support/resistance.
Swing traders: A breakout above ₹6,000 may signal bullish continuation; a break below ₹5,750 could mean short-term weakness.
Always pair key levels with volume and momentum indicators before placing trades.

TORNTPHARM 1 Week Time Frame 📊 Current Price (Approximate): ~₹3,930–₹3,970 on NSE/BSE.
📈 Short-Term (1-Week) Levels to Watch
🔹 Resistance (Upside)
R1: ~₹3,965 – ₹3,995 — near recent pivot resistance.
R2: ~₹3,990 – ₹4,020 — higher resistance zone, close to recent intraday highs.
R3: ~₹4,010 – ₹4,050 — psychological/upper range area and prior 52-week highs.
Note: A clear break and close above ~₹4,020–₹4,050 could shift short-term bias bullish within the week.
🔻 Support (Downside)
S1: ~₹3,910 – ₹3,920 — near pivot/support and recent short-term reaction low.
S2: ~₹3,880 – ₹3,890 — zone near 50-day moving average support.
S3: ~₹3,820 – ₹3,850 — deeper support if momentum weakens.
Weak market conditions or broader index decline could push prices toward the S2–S3 support zone.
🧠 What This Means in Practice
✔️ Above Resistance (~₹3,995–₹4,020) – bullish continuation might unfold within a week if buyers persist.
✔️ Below Support (~₹3,880) – increased risk of short-term pullback toward ~₹3,820.
✔️ RSI/oscillator readings tend to stay neutral–slightly bullish unless a strong trend emerges (indicators vary by platform).

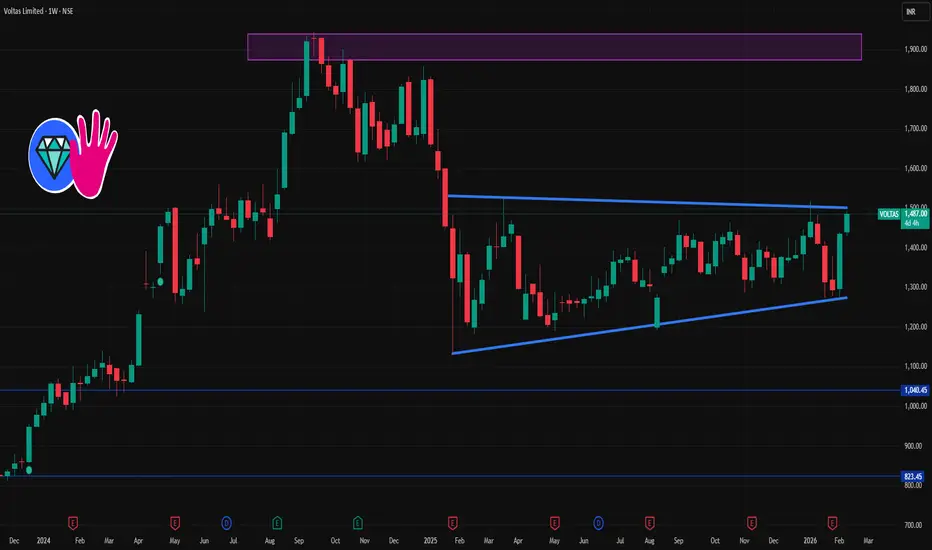
VOLTAS 1 Week Time Frame 💹 Current price range (approx): ₹1,430–₹1,485 (varies across platforms).
📊 Key Levels for Next Week
🔼 Upside / Resistance Levels
These are levels where price might face supply/selling pressure this week:
₹1,480–₹1,500 — near recent peaks and psychological zone
₹1,500–₹1,520 — secondary resistance (historical / pivot region)
🔽 Downside / Support Levels
Important zones where buyers might step in if price dips:
₹1,380–₹1,395 — near short-term support from pivots
₹1,350–₹1,370 — broader support zone where price has bounced recently
₹1,320–₹1,330 — deeper support if weakness continues
📌 Pivot Reference
Some pivot calculations for weekly help gauge trend direction:
Weekly Pivot ~₹1,381
R1 ~₹1,492 / R2 ~₹1,550 / S1 ~₹1,354 / S2 ~₹1,312 (depends on calculation method)
📉 What Technical Indicators Suggest
Short-term price action has shown strength in momentum indicators on intraday and daily (e.g., strong buy signals).
Some weekly indicators show mixed signals (momentum present but not overly strong).
Analyst screens show a variety of bias — some strong buy on short term, others neutral/weak on weekly.
🧠 Quick Strategy Notes (for traders)
Bullish break above ₹1,500 could open room toward ~₹1,520–₹1,550+ (short-term).
Sustained break below ₹1,380 may signal deeper pullback toward ~₹1,350–₹1,320.
Keep an eye on volume and candlestick signals around these key zones.
AUROPHARMA 1 Week Time Frame 📊 Weekly Support & Resistance (Key Levels)
Weekly Pivot (approx): ~₹1,180–1,190 area (reference level for weekly bias)
Resistance Levels:
R1: ~₹1,215–1,220 – first major upside hurdle (weekly)
R2: ~₹1,250–1,260 – possible next resistance above R1
R3: ~₹1,275–1,280+ – strong weekly supply zone if bullish momentum continues
Support Levels:
S1: ~₹1,155–1,160 – initial weekly support zone
S2: ~₹1,130–1,140 – deeper support if weekly price corrects further
S3: ~₹1,100 – structural support and breakdown zone for bears
📉 Weekly Momentum & Trend Signals
Weekly indicators (RSI, MACD, SMA) suggest mixed to slightly bullish bias, with price trading around medium‑term moving averages — not extremely overbought or oversold.
Earlier weekly data also showed strong weekly moving average support near ~₹1,100–1,140 range.
🧠 How to Use These Levels
Bullish Scenario: A clean weekly close above ~₹1,215–1,220 can open room toward ₹1,250–1,280+.
Bearish Scenario: Weekly rejection and close below ~₹1,155–1,160 may see support tests around ₹1,130 and ₹1,100.
Use these in combination with weekly candlestick patterns (like closes beyond support/resistance) to confirm breakouts or breakdowns.
⚠️ Note: Technical levels change with price action. These are indicative ranges based on recent weekly pivot computations and should be complemented with your own charting or broker platform data for precise decision making.

HAVELLS 1 Day Time Frame 📌 Current Market Snapshot (NSE)
• Current Price: ~₹1,345–₹1,352 range (intra‑day) — varies by source/data feeder 👆
📈 Daily Pivot & Key Levels (Daily Timeframe)
📊 Pivot Point Levels
Level Price (Approx)
🧮 Pivot (Daily) ₹1,270–₹1,275
🔼 Resistance 1 (R1) ₹1,287–₹1,291
🔼 Resistance 2 (R2) ₹1,301–₹1,305
🔼 Resistance 3 (R3) ₹1,316–₹1,318
🔽 Support 1 (S1) ₹1,259–₹1,265
🔽 Support 2 (S2) ₹1,243–₹1,245
🔽 Support 3 (S3) ₹1,230–₹1,232
(Classic pivot daily levels)
📊 Alternative Daily Support / Resistance Levels (Trendlyne / Research360)
✔ Pivot: ~ ₹1,324–₹1,325
✔ Support Levels:
• S1: ~ ₹1,294–₹1,294
• S2: ~ ₹1,276–₹1,276
• S3: ~ ₹1,245–₹1,246
✔ Resistance Levels:
• R1: ~ ₹1,342–₹1,343
• R2: ~ ₹1,373–₹1,373
• R3: ~ ₹1,391–₹1,391**
🔍 Short‑Term Daily Reference (Intraday Pivot)
From intraday pivot analysis (updated today):
• Central Pivot (CPR): ~ ₹1,319–₹1,320
• Daily R1: ~ ₹1,333–₹1,334
• Daily R2: ~ ₹1,349–₹1,350
• Daily R3: ~ ₹1,363–₹1,363
• Daily S1: ~ ₹1,290–₹1,291
• Daily S2: ~ ₹1,289–₹1,289
• Daily S3: ~ ₹1,303–₹1,303
(based on multiple pivot calculation methods including Standard & Camarilla)
📌 How to Use These Levels Today
Bullish scenario:
✅ Holding above Pivot / CPR (~₹1,270–₹1,324) → bias to R1 → R2 → R3 zones.
Bearish scenario:
❌ Break below S1/S2 (~₹1,259 / ₹1,243) → weakness toward S3.
Short traders often watch CPR for pullbacks and reversals within the day.

IIFL 1 Day Time Frame 📊 Daily Pivot & Key Levels (1‑Day Timeframe)
📍 Daily Pivot:
• ₹520.28 (reference level for bias)
📈 Resistance Levels:
• R1: ₹532.57 — first upside hurdle
• R2: ₹543.28 — next barrier above
• R3: ₹555.57 — extended resistance zone
📉 Support Levels:
• S1: ₹509.57 — immediate support
• S2: ₹497.28 — next support zone
• S3: ₹486.57 — deeper support below
📌 How to Use These Levels Today
📈 Bullish view:
Break above ₹532.5 – ₹543.3 can open room toward ₹555+ for the day.
📉 Bearish view:
If price drops below ₹509.5, sellers could push toward ₹497 and then ₹486.5.
🟡 Pivot reaction:
Holding above the pivot ₹520.28 suggests bias toward upside today.
Falling below pivot suggests weakness intraday.
🔍 Note on Current Price Trend
Some data (delayed) shows moving averages and indicators near oversold, but pivot levels remain useful for intraday decisions.

HDFCBANK 1 Week Time Frame 📌 Current Reference Price (approx): ~₹920–₹950 range recently after weekly sessions.
📉 Weekly Pivot & Key Levels (based on weekly pivot analysis)
(derived from pivot calculations for the weekly timeframe)
Pivot Point (Weekly)
Weekly Pivot (Central): ~₹945.47
Resistance Levels (Weekly)
R1: ~₹961.68
R2: ~₹981.92
R3: ~₹~1,000+ (higher band extensions)
Support Levels (Weekly)
S1: ~₹925.23
S2: ~₹909.02
S3: ~₹888.78
(Lower supports if breakdown continues)
These levels are pivot‑based and often watched by traders for entry/exit or stop placements.
🔎 Additional Reference Points
📊 52‑Week Range
High: ~₹1,020.50
Low: ~₹830.55
This gives broader context on where the weekly levels sit within the yearly trend.
📈 Recent Weekly Price Action
Weekly charts show HDFC Bank stock has been trading below its recent highs with some volatility and is within a range on weekly bars — this means weekly support/resistance bands can act as possible bounce zones or breakout triggers.
📌 Weekly Trading Bias and Key Zones to Watch
Bullish Scenario (weekly close above pivot):
A weekly close above ~₹961–₹965 may open momentum toward ₹980‑₹1,000+ zone.
Neutral / Range:
Price stuck between ~₹925 and ₹961 suggests sideways consolidation.
Bearish Scenario (weekly break below support):
Weekly close below ~₹909–₹888 could open deeper downside toward the 52‑week low zone near ₹830‑₹850.
⚠️ Notes
These levels are technical references, not buy/sell advice.
Market news, volume, macro cues & overall Bank Nifty moves can influence weekly levels significantly.
Always consider your risk tolerance and use stop‑loss orders appropriately.

ASIANPAINT 1 Day Time Frame 📊 Current Price (approx): ₹2,402 – ₹2,410 (NSE intraday/daily) as of latest market data.
🔁 Daily Pivot Levels
Pivot (central reference): ~₹2,379–₹2,380
Resistance Levels:
• R1: ~₹2,416–₹2,417
• R2: ~₹2,475–₹2,476
• R3: ~₹2,512–₹2,513
Support Levels:
• S1: ~₹2,320–₹2,321
• S2: ~₹2,283–₹2,284
• S3: ~₹2,224–₹2,225
(from classic daily pivot structure)
📈 How to Use These Levels (Daily Basis)
Bullish scenario (if buyers strong):
Sustained break above R1 (~₹2,416) targets R2 (~₹2,475) & then R3 (~₹2,512).
Neutral / sideways zone:
Price hovering between Pivot (~₹2,380) and R1 (~₹2,416) suggests range‑bound moves.
Bearish scenario (if selling pressure):
Break below S1 (~₹2,320) can open path towards S2 (~₹2,283) and then S3 (~₹2,224).
📌 Short‑Term Technical Snapshot
Asian Paints price action has been under pressure recently as technical indicators show muted momentum and the stock trading below several moving averages (20‑day/50‑day) reflecting short‑term neutral to weak bias.
Always combine pivot levels with volume and price action signals (e.g., breakouts with confirmation) for better trade decisions.

BSE 1 Day Time Frame 📌 Current Price & Daily Range (Live Context)
Estimated current market price: ~₹2,850–₹2,880 (indicative from multiple sources citing latest live price movement).
Today’s daily high/low range: Approx ₹2,793–₹2,929 (observed current session variation).
⚠️ Exact live price can differ by minutes — check your trading platform for exact tick.
📈 1‑Day Pivot & Levels (Daily timeframe)
Classic Pivot Zone:
Pivot Point: ~₹2,647–₹2,663 (key balance level)
Immediate Resistance (Upside Targets):
R1: ~₹2,765–₹2,775
R2: ~₹2,828–₹2,830
R3: ~₹2,940 or higher (extended resistance)
Key Support (Downside Levels):
S1: ~₹2,584–₹2,625
S2: ~₹2,466–₹2,575
S3: ~₹2,403–₹2,537 — major downside pivot safety zone.
👉 Price above pivot generally signals bullish intraday bias; below pivot suggests weakness.
📊 Trend & Momentum (Daily)
Indicators & moving averages:
Price is trading above 20/50/100/200‑day EMAs, indicating a bullish trend on the daily chart.
RSI near neutral‑to‑positive zone (~50), showing room for further continuation before overbought.
This suggests bullish bias on daily timeframe, but resistance zones near ₹2,828–₹2,940 are key to break for sustained upside.
🧠 How to interpret the daily levels today
Bullish scenarios (1‑Day):
✔ Above ₹2,828–₹2,830 — expands move toward ₹2,940+.
✔ Sustained above pivot ~₹2,650+ — retains short‑term bullish structure.
Neutral / consolidative:
➡ Between ₹2,650 – ₹2,828 — range balance, sideways action likely.
Bearish scenarios (1‑Day):
✘ Break below ₹2,584 — could pull toward ₹2,466 / ₹2,403 supports.

JAMNAAUTO 1 Day Time Frame • Last close: ~₹124 – ₹124.36 on NSE/BSE.
• Recent daily range: Low ~₹116.60 – High ~₹126.55.
📊 Daily Support & Resistance Levels (Key Zones)
Pivot Point (Daily)
Daily Pivot ~ ₹120 – ₹123.55: Key reference for intraday bias — above is bullish, below is bearish.
Resistance Levels
R1: ~ ₹125–₹125.32 – first hurdle above pivot.
R2: ~ ₹128–₹128.38 – stronger resistance near recent swing highs.
R3: ~ ₹130–₹130.15 – extended upside pivot.
Support Levels
S1: ~ ₹120 – ₹120.49 – first support near pivot/MA levels.
S2: ~ ₹118.5 – ₹118.72 – next layer of downside support.
S3: ~ ₹115.5 – ₹115.66 – deeper support zone.
These pivot-derived levels are commonly used for intraday and next-day trading reference.
📈 What Technical Indicators Suggest (Daily)
Moving Averages / Momentum
Short-term MAs around 20–50 DMA are near the pivot zone, indicating mixed momentum around the current price.
On some technical panels, oscillators like RSI may be neutral or slightly bearish/bullish depending on the source — indicating no strong momentum bias right now.
🧠 How to Use This for a 1-Day View
Bullish Bias (short-term) if:
✔ Price sustains above daily pivot (~₹122–123)
✔ Break of R2 (~₹128–₹128.4) with volume
Bearish / Caution if:
❌ Price closes below S1 (~₹120)
❌ Momentum indicators turn down from resistance
⚠️ Risk & Notes
These levels are technical guides — not investment advice.
Price can gap on news earnings, market sentiment, or sector moves.
Always combine with your own risk management (stop-loss, position sizing).

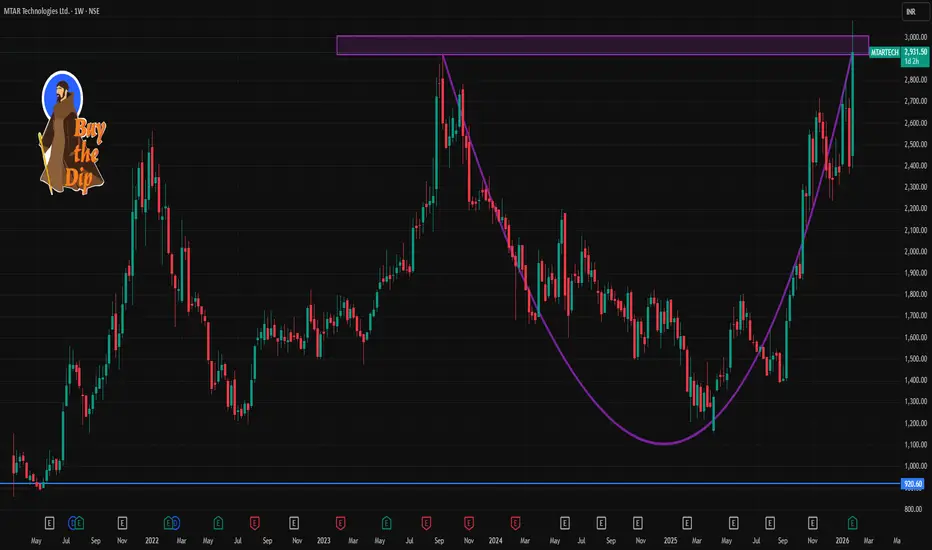
MTARTECH 1 Week Time Frame 📊 Current Price Snapshot
MTAR Technologies closed around ₹2,931–₹2,932 recently.
📈 Weekly Pivot & Support/Resistance Levels
(Important zones likely to act as reference over ~1 week)
🔹 Pivot Levels
These are calculated based on recent price activity and help gauge short-term bias:
Central Pivot ≈ ₹2,909–₹2,954 (key balance level)
🔹 Resistance Levels
Potential upside barriers where price may slow/reverse:
₹2,995–₹3,031 near short-term upper range
₹3,100–₹3,178 next resistance cluster
Above ₹3,200 breakout target (longer weekly/extension)
🔻 Support Levels
Important zones to watch if price pulls back:
₹2,741–₹2,762 area (S1) — near immediate short-term support
₹2,562–₹2,600 range (S2) — strong secondary support
₹2,461–₹2,500 (S3/S4) — deeper pullback zone
These resistances/supports are based on pivot point calculations & Fibonacci extensions covering multiple pivot methods.
📊 Technical Indicators (Short-Term Context)
Moving averages (20, 50, 100, 200 DMA) are largely bullish in daily/weekly analysis, supporting upward momentum.
RSI is near bullish territory but approaching overbought on shorter frames — indicating possible consolidation ahead.
Some technical tools show short-term buy signals; others show neutral — indicating range movement with upside bias.
📌 How to Use These Levels
Bullish Scenario:
➡ Price sustaining above the pivot (~₹2,890-₹2,950) suggests continuation toward ₹3,000 → ₹3,100+ resistance levels.
Bearish/Retracement Scenario:
➡ Failure below pivot or key support near ₹2,740 could trigger pullbacks toward ₹2,600 → ₹2,500 support zones.
This setup works well for 3–7 day trading or planning entry/exit zones.
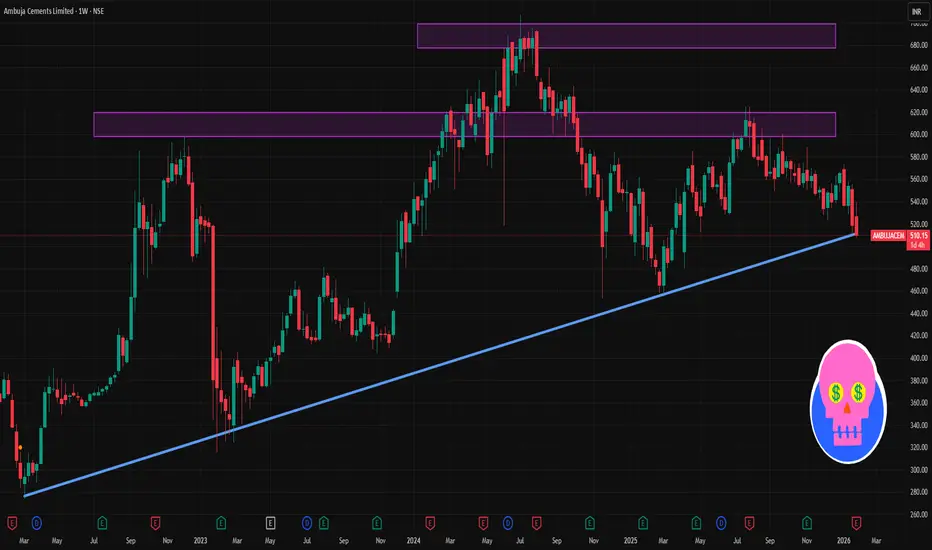
AMBUJACEM 1 Week Time Frame 📊 Current Price Context
The stock has recently traded around ₹510 – ₹536 after earnings‑related volatility.
The 52‑week range is roughly ₹455 (low) to ₹625 (high).
🔁 1‑Week Technical Levels (approx)
Key resistance (levels where sellers may step in):
₹542‑₹545: Near recent pivotal resistance zone.
₹552‑₹558: Secondary resistance cluster short‑term.
Key support (levels where buyers may defend):
₹527‑₹528: Initial support within the week.
₹521‑₹516: Next support zone if the dip extends.
₹500 – ₹495: Stronger longer‑term support if selling intensifies.
📉 Short‑Term Trend & Signal
Technical aggregators rate the stock as weak/neutral to bearish on the 1‑week timeframe — meaning downside risks currently outweigh upside signal.
Price below recent pivot and moving averages suggests bearish short‑term momentum absent close above resistance.
📌 Practical Swing Levels (Simple Guide)
Bullish trigger zone: closing above ₹545‑₹550 on weekly closes could make higher levels nearer ₹560+ possible.
Bearish trigger zone: closing below ₹520 may open path toward ₹500 and deeper.
INDIANB 1 Month Time Frame 📌 Current Price Context (as of latest trading)
Indian Bank is trading near ₹910–₹920 levels on NSE.
📈 1‑Month Key Resistance Levels (Upside)
These are the levels where price may face selling pressure or reversal if bulls weaken:
R1 — ₹918–₹920 — immediate resistance area just above current trade.
R2 — ₹927–₹930 — secondary resistance zone.
R3 — ₹935–₹940 — further upside resistance zone for continuation moves.
Summary: Immediate upside capped around ~₹918–₹930. Break and close above this band can signal stronger bullish continuation.
📉 1‑Month Key Support Levels (Downside)
Important levels that can act as rebound zones on pullbacks:
S1 — ~₹880–₹885 — first meaningful support near recent swing lows.
S2 — ~₹860–₹865 — secondary support from broader short‑term structure.
S3 — ~₹830–₹835 — major zone where bigger trend buyers may step in.
Summary: Minor supports start ~₹880, stronger support cluster around ~₹860‑₹835.
📊 Pivot / Neutral Reference
Pivot around ~₹907–₹910 — current central reference area.
Price above pivot suggests bullish bias, below could tilt neutral to bearish within the month.
📌 Interpretation For 1‑Month View
Bullish scenario:
Holds above ₹900–₹910 pivot → targeting ₹927–₹940 zone.
Neutral / consolidation:
Trading between ₹880–₹910.
Bearish risk:
Break below ₹860–₹845 could open deeper correction toward ₹830.

TDPOWERSYS 1 Day Time Frame 📊 Live/Intraday Summary (Today’s Trading)
• Current price: ~₹735 – ₹745* (showing a strong upside on the day).
• Day’s high: ₹767.95.
• Day’s low: ₹642.30.
• Previous close: ₹676.90.
• Range (1‑day): ₹642.30 – ₹767.95.
• Volume: Several million shares traded (indicating active intraday participation).
• Circuit limits: Upper ₹812.25 / Lower ₹541.55.
📈 Intraday Price Behavior (1‑Day Chart Insight)
Although I can’t draw the live chart, major market data sources show the stock rising significantly above its previous close, with intraday volatility spanning over ₹125+, suggesting strong buying interest today.
🔎 What this means for your 1‑day view
The stock opened lower near ₹661 and trended up strongly, testing higher intraday levels toward ₹767+ — a bullish intraday range.
Today’s range and levels are useful for intraday support/resistance as:
• Support: ~₹640 – ₹660 (earlier day lows).
• Resistance: ~₹760 – ₹770 (near today’s high).
⚠️ Notes
• Market prices intraday change rapidly — data above reflects the latest available snapshot for today’s session.
• If you’re planning trades, check real‑time charts from your broker or a live market platform (e.g., NSE/BSE or charting tools like Chartink).

IDEA 1 Day Time Frame📈 Current Snapshot (Daily)
📍 Approx Price Range Today: ₹10.00 – ₹11.00 per share (indicating recent heavy trading and a bounce)
📍 RSI (Daily): ~38.5 – showing slightly weak momentum but not deeply oversold yet
📍 50 / 100 / 200 DMA: ~₹10.58 / ₹9.94 / ₹9.34 – price around these averages suggests mixed consolidation near crucial pivot zones
🔑 1-Day Key Levels (Pivots)
✔ Pivot Point
Pivot: ~ ₹9.98 → Daily balance point (trend bias flips above / below)
🟢 Support Levels
S1: ~ ₹9.75 → 1st immediate support
S2: ~ ₹9.46 → secondary support zone
S3: ~ ₹9.23 → lower daily support
👉 Below ₹9.23 — increased bearish risk on intraday breakdown.
🔴 Resistance Levels
R1: ~ ₹10.27 → first resistance
R2: ~ ₹10.50 → near daily average resistance
R3: ~ ₹10.79 – ₹11.00 → stronger daily resistance & psychological level
👉 Sustained move above ~₹10.50-₹10.80 can shift short-term bias toward recovery.
📌 Important Context (Market News)
Today’s market action showed a strong positive catalyst: Vodafone Idea shares surged ~13% to ~₹11.36 on Jan 30 2026 after management revealed a large turnaround plan including ₹45,000 cr capex strategy and AGR relief news — indicating significant bullish sentiment shift.
Recent fundamentals: Q3 loss narrowed and ARPU increased, which supports sentiment.
These news catalysts can influence price reaction at key technical levels, so combine them with the pivot levels above for better context.

PIRAMALFIN 1 Day View 📌 Current Price (Live NSE)
• ~₹1,750.30 (down ~‑2.16%)
• Day Low ~₹1,741.00
• Day High ~₹1,779.90
📊 Daily Pivot Levels (Classic)
(calculated from previous trading session price range)
Level Value
Pivot Point (PP) ₹1,776.93
Resistance 1 (R1) ₹1,838.37
Resistance 2 (R2) ₹1,882.83
Resistance 3 (R3) ₹1,944.27
Support 1 (S1) ₹1,732.47
Support 2 (S2) ₹1,671.03
Support 3 (S3) ₹1,626.57
📌 Intraday Interpretation (1D TF)
Bullish if:
✔ Price holds above Pivot ~₹1,777
✔ Break above R1 ~₹1,838 signals stronger upside bias
Bearish if:
🔻 Price stays below Pivot ~₹1,777
🔻 Break below S1 ~₹1,732 could open slide toward S2/S3 levels
Today’s trading bias (current):
• Price below pivot — short‑term bearish/neutral tone intraday
• Key support to watch: ₹1,732 → ₹1,671 zone
📈 Other Intraday Technicals (from recent session)
• RSI (short‑term) around ~58 (neutral/upper range)
• EMA/SMA 20 day near ~1,772–1,783 — acting as dynamic resistance area
• Volume & range suggest typical NBFC trading volatility today.

ECLERX 1 Day Time Frame 📍 Current Price Snapshot (Daily)
As of the latest available trading data:
• ECLERX daily price: ~₹4,710–₹4,740 region (intraday update) — fluctuating with bullish momentum near recent highs.
📊 Daily Technical Levels (Key Support & Resistance)
Classic Pivot Levels (Daily)
Based on recent pivot calculations from multiple technical sources:
Resistance
R3: ~₹4,748
R2: ~₹4,710–₹4,687
R1: ~₹4,626–₹4,649
Pivot Point: ~₹4,649
Support
S1: ~₹4,588–₹4,588
S2: ~₹4,561–₹4,611
S3: ~₹4,565 and lower
(values approximate based on classic & fibonacci pivot methods)
Simplified pivot zone (short)
Resistance Zone: ~₹4,710–₹4,750
Support Zone: ~₹4,560–₹4,590
Major pivot: ~₹4,648 (neutral decision level)
Additional Support / Resistance Levels (Alternate Sources)
From trendlyne / pivot screens:
• First Resistance: ~₹4,386–₹4,451
• Second Resistance: ~₹4,550–₹4,555
• Third Resistance: ~₹4,621–₹4,622
• Support Zones: ~₹4,254–₹4,215 and deeper ~₹4,161–₹4,111 if broader pullbacks occur.
👉 These can be useful as secondary trigger levels if price action tests below pivot or breaks above immediate resistance.
📌 How to Use These Levels Today
Bullish bias
➡ A daily close above ₹4,710–₹4,750 resistance cluster suggests continuation toward recent highs (potential next zone in higher time frames).
Bearish/Correction risk
➡ Weak price action below ₹4,590–₹4,560 support on the daily can expose the next support band around ₹4,500–₹4,450.
Key pivot confirmation
➡ The central range around ₹4,640–₹4,650 serves as a daily pivot — sustained trading above supports bullish control, below introduces caution.

STARHEALTH 1 Week Time Frame 📊 Weekly Price Range (1‑Week History)
High (last week): ~₹469.8
Low (last week): ~₹442.45
(Source: Marketscreener weekly price extremes)
📌 Key Weekly Support Levels
Support zones you may watch on the weekly timeframe:
1. Support 1: ~₹440–₹442 (recent weekly low)
2. Support 2: ~₹430 area (round‑number psychological / pivot cluster)
3. Support 3: ~₹408–₹415 range (broader structural support from pivot supports seen on shorter pivots)
Weakness below ₹430 could open the lower band towards ₹405–₹410.
📌 Key Weekly Resistance Levels
Potential weekly resistance zones to monitor:
1. Resistance 1: ~₹470–₹472 (recent weekly highs & EMA cluster)
2. Resistance 2: ~₹480–₹485 (psychological and medium MA area)
3. Resistance 3: ~₹495+ (upper pivot / longer‑term range top)
A weekly close above ₹480–₹485 would indicate stronger upside pressure.
📈 Technical Indicator Context (Weekly)
RSI and weekly momentum indicators on some platforms suggest neutral‑to‑slightly bullish conditions rather than extreme overbought levels.
Weekly pivot and moving average positions (when available) confirm ₹462–₹470 as an important zone for bullish continuation.

JLHL 1 Day Time Frame 📌 Current Live Price (1‑Day)
Last traded price: ~₹1,305–₹1,322 range today on NSE/BSE.
Day’s range: ~₹1,301–₹1,359.
📊 Intraday Technical Levels (1‑Day Time Frame)
🔹 Pivot & Reference
No concrete official pivot published for today across many free data sites, but general intraday pivot technique (based on brokers’ short‑term screens) focuses around mid‑range prices near ₹1,310–₹1,320 as neutral area.
🔼 Resistance Levels (Upside)
These are zones where the price may face selling pressure on the same trading day:
1️. ₹1,350–₹1,360 — initial resistance zone (recent intraday high area).
2️. ₹1,375–₹1,390 — secondary resistance if price clears the initial zone.
🔽 Support Levels (Downside)
These are zones where buyers may step in intraday:
1️. ₹1,290–₹1,300 — nearest support band (recent intraday low).
2️. ₹1,270–₹1,280 — next lower support cluster (near the 52‑week low region).
🧠 Intraday Trading Interpretation
Bullish bias intraday if:
Price breaks above ₹1,350–₹1,360 with volume → could test higher around ₹1,375–₹1,390.
Bearish bias intraday if:
Price loses ₹1,290 support → risk of slide toward ₹1,270+ zone.
Range‑bound scenario:
Price oscillates between ₹1,290–₹1,350 if participation stays muted.

CONCOR 1 Day Time Frame 📊 CONCOR — 1‑Day Time Frame Key Levels (Indicative)
Current Price (recent session)
• ~₹478–₹480 (down intraday) — trading near session lows.
🔁 Pivot & Classic Levels (from standard technical calculation)
These are typical pivot/SR levels used by traders for one‑day setups:
Pivot Point: ~₹520
➡️ The central reference level where bias may shift.
If price trades above this level intraday → bullish bias; below → bearish bias.
Resistance Levels:
• R1: ~₹524
• R2: ~₹527
• R3: ~₹531
➡️ Levels where selling pressure may emerge if price rallies.
Support Levels:
• S1: ~₹516
• S2: ~₹513
• S3: ~₹509
➡️ Key intraday levels where buyers may step in on pullbacks.
📉 Today’s Range & Observations
Day’s High: ~₹497–₹498
Day’s Low: ~₹477–₹478
➡️ CONCOR is trading nearer its session low, showing short‑term selling pressure.
52‑Week Context:
• 52‑week low ~₹472–₹478
• 52‑week high ~₹652 (prior broader trend)
📌 How Traders Use These Levels (1 Day Time Frame)
Bullish Scenarios (intraday):
✔ If price breaks above Pivot (~₹520) with volume → potential move toward R1 ~₹524 and beyond.
✔ Strength above R1/R2 indicates buyers stepping in.
Bearish Scenarios (intraday):
✔ Price staying below pivot and failing at R1/R2 → continuation lower.
✔ Breakdown below S1 (~₹516) and S2/S3 amplifies downside pressure.

DIXON 1 Day Time Frame 📉 Intraday Price Action (Today’s Range)
Day’s Range: ~₹10,274 – ₹10,790
This indicates where the stock has been trading so far today.
📊 Key Intraday Levels for 1‑Day Time Frame
🟢 Support Levels
S1: ~₹10,545 – ₹10,550
S2: ~₹10,359 – ₹10,360
S3: ~₹10,016 – ₹10,020
🔴 Resistance Levels
R1: ~₹11,070 – ₹11,075
R2: ~₹11,410 – ₹11,420
R3: ~₹11,600 – ₹11,605
These pivot‑derived support/resistance levels are typical for intraday reference (classic pivot methodology).
🧠 How to Use These Levels (Intraday)
Bullish bias: A sustained break above R1 ~₹11,070 with volume can open moves toward R2 ~₹11,410.
Bearish bias: If price loses S1 ~₹10,545, next support guards are S2 ~₹10,360 and S3 ~₹10,016.
