IOC 1 Month Time Frame 📌 CURRENT PRICE (as of 22 Jan 2026)
IOC share price: ~₹159.9 per share (NSE/BSE).
📊 1‑Month Technical Levels (Current & Accurate)
Resistance (Upside Levels)
These are levels where price may find selling pressure in the near term:
R1 – Immediate Resistance: ~₹160.6–₹162.5
R2 – Mid Resistance: ~₹162.5–₹163.9
R3 – Higher Resistance: ~₹164–₹165.2
A broader longer‑range resistance zone near ₹170–₹171+ remains significant if the market strengthens.
Why these matter:
Resistance levels show where the stock has historically paused or reversed on recent charts — useful for targets or exits.
Support (Downside Levels)
These are key near‑term supporting price zones:
S1 – Immediate Support: ~₹156.8–₹159.4
S2 – Secondary Support: ~₹154.7–₹157.9
S3 – Deeper Support: ~₹152.9–₹155.0
Note: If price breaks below ~₹155, it could signal further weakness in the short term.
🧠 How to Use These Levels
Swing traders: Use support zones for entry zones and resistance levels as targets.
Breakouts: A clear close above ₹164–₹165 could open room toward the ₹170+ zone.
Breakdown: A close below ₹155 could escalate selling into deeper support.
Chartreading

CUBEXTUB 1 Week Time Frame 📊 Current Price Context
Latest trading range (approx): ₹99–₹103 per share.
📈 Weekly Key Levels (Approximate)
🎯 Resistance Levels
These are areas where upside price movement may slow or reverse:
1. First Resistance: ~₹108–₹109 — near recent pivot resistance.
2. Next Resistance: ~₹113–₹116 — upper weekly resistance zone.
3. Higher Target: ~₹118–₹120+ — longer weekly resistance/extension.
📉 Support Levels
These are areas where price may find buying interest or a bounce:
1. Immediate Support: ~₹101–₹102 — just below recent price and short‑term pivot support.
2. Secondary Support: ~₹98–₹99 — next downside zone.
3. Lower Support: ~₹94–₹95 — deeper support if weakness continues.
📌 Weekly Pivot Reference
Pivot Level (central reference): ~₹106 — roughly the fulcrum of bulls vs. bears this week.
🛠 How to Use These Levels (Weekly Basis)
Bullish scenario:
✅ If the weekly close breaks and holds above ₹108–₹109, next resistance targets of ₹113–₹116 become active.
Bearish scenario:
❌ Failure below ₹101–₹102 could open the path toward ₹98–₹95 support.
Range bias:
🟡 Price may oscillate between ₹101–₹113 in the absence of a decisive trend signal.

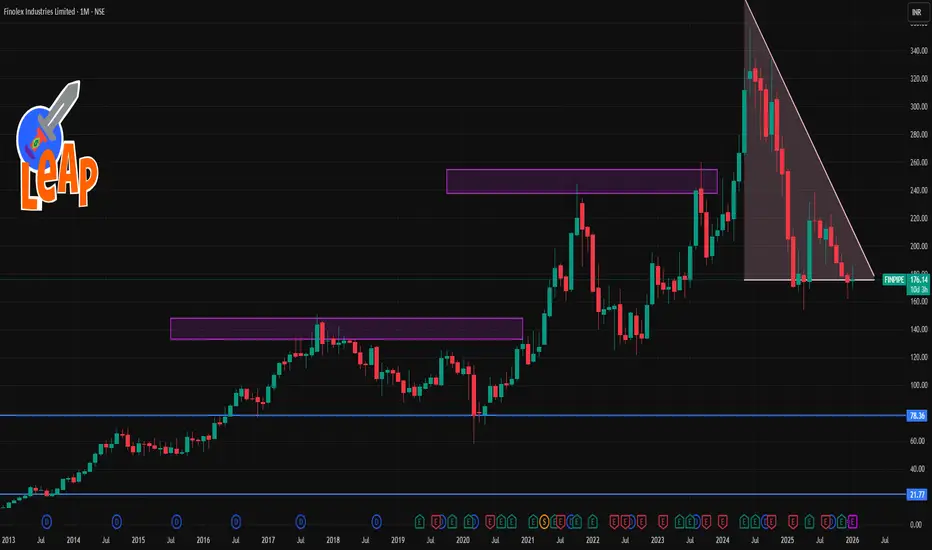
FINPIPE 1 Month Time Frame📊 Current Context
The share has been moderately positive over the past month (~+5–8% gains) in recent price data.
Recent share price (late Jan 2026) is near ₹175–177 levels.
📈 Key Levels (1‑Month Timeframe)
🔹 Resistance Levels
These are levels where the price may face selling pressure:
1. ~₹177–179 — Immediate resistance seen on short‑term pivot structure.
2. ~₹185–189 — Next meaningful resistance zone based on recent moving average clusters (20–50 day EMAs/SMAs).
3. ~₹194–198 — Higher resistance around 50–100 day average / upper consolidation of the last month/quarter.
Break above ₹185–189 with volume could signal a stronger short‑term uptrend continuation.
🔻 Support Levels
Important price floors where the price may find buyers:
1. ~₹173–175 — Near short‑term support and recent intraday pivot levels.
2. ~₹169–170 — Lower support seen from short swing lows over the past month.
3. ~₹164–165 — Deeper support from prior month low levels before recent recovery. (Estimated from recent historical lows.)
A close below ~₹169 on daily charts could indicate weakening short‑term structure.
🗺️ Trading Mindset (not financial advice)
Bullish view: A sustained move above ₹185–189 with increased volumes may target higher resistance near ₹195+.
Bearish view: A close under ₹170–169 could restart short‑term weakness toward lower support levels.
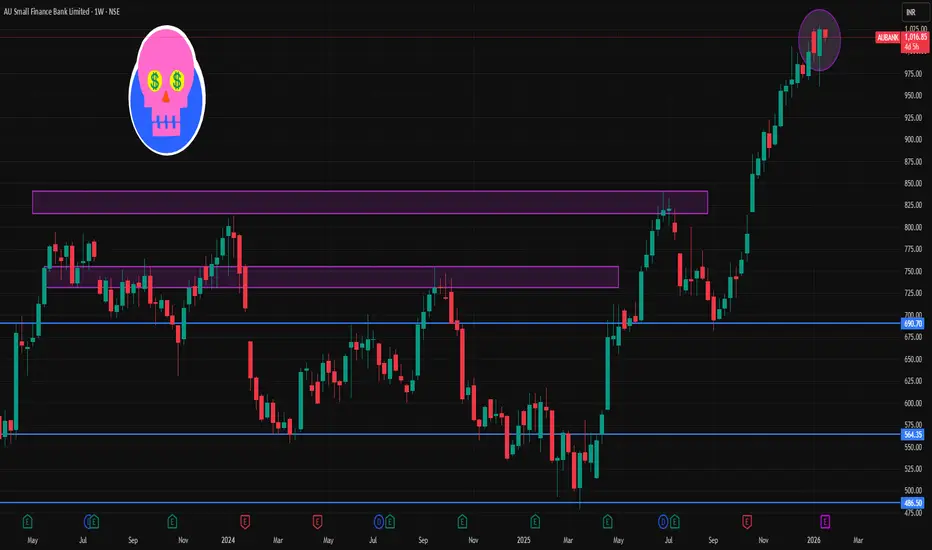
AUBANK 1 Week Time Frame 📌 1‑Week (Current) Key Levels
📍 Current Price Context
The stock has been trading around ₹1,020–₹1,030 area recently on NSE technical feeds.
🧱 Resistance Levels (Upside Targets)
1. Immediate Resistance (R1): ~₹1,050.35 – first barrier on the upside.
2. Major Resistance (R2): ~₹1,075.30 – next meaningful supply zone.
3. Higher Resistance (R3): ~₹1,120.65 – extended bullish breakout territory.
🛡️ Support Levels (Downside Defenses)
1. Immediate Support (S1): ~₹980.05 – crucial for weekly structure.
2. Major Support (S2): ~₹934.70 – deeper correction zone if S1 breaks.
3. Lower Support (S3): ~₹909.75 – extended bearish support for the week.
📊 Weekly Trading Range Projection
Bearish range: ~₹909–₹980
Bullish range: ~₹1,050–₹1,120 +
Price needs to hold above ₹980 weekly close to maintain bullish bias for the week.
📈 Trend & Indicators (Weekly)
Moving averages and oscillators on short‑term charts show neutral to mildly bullish momentum around ₹1,020–₹1,030.
EMA & SMA structures on daily charts support trend continuation if above key moving averages.
🔎 How to Use These Levels This Week
📌 Bullish setup:
Break and sustain above ~₹1,050 → potential run to ~₹1,075 → ₹1,120.
📌 Bearish setup:
Close below ~₹980 support → target ~₹935 → ₹910 on a deeper correction.
📌 Neutral / Swing range:
Between ₹980 and ₹1,050 → sideways action and range trades.
JSWSTEEL 1 Day Time Frame 📌 Daily Pivot Reference
Pivot (Daily): ~ ₹1,184 – ₹1,185 (central reference point)
📈 Resistance Levels (Upside)
1. R1: ~₹1,199 – ₹1,200 (first resistance)
2. R2: ~₹1,216 – ₹1,217 (second resistance)
3. R3: ~₹1,230 – ₹1,231 (third resistance / extended resistance)
📉 Support Levels (Downside)
1. S1: ~₹1,167 – ₹1,168 (first support)
2. S2: ~₹1,153 – ₹1,155 (second support)
3. S3: ~₹1,135 – ₹1,136 (third support)
📊 How to interpret on a 1D chart
A break above ₹1,200–₹1,216 with strong volume may open room for testing ₹1,230+ short-term.
On the downside, a slip below ₹1,167 could accelerate to ₹1,153 and then ₹1,135.
The pivot around ₹1,184–₹1,185 acts as a baseline: closes above suggest bullish bias intraday; closes below suggest bearish bias.

SOLARINDS 1 Day Time Frame 📊 Live Price Snapshot (approx)
Current NSE price: ~₹13,190 – ₹12,875 range (end of last session)
📈 Daily Pivot & Key Levels (1-Day Timeframe)
These come from recent pivot point calculations and live technical feeds:
Resistance Levels (Upside)
R1: ~₹13,577
R2: ~₹13,963
R3: ~₹14,214
(Potential upside barriers / targets)
Pivot Point
Pivot (Daily Reference): ~₹13,300 zone (approx midpoint)
Support Levels (Downside)
S1: ~₹12,940
S2: ~₹12,689
S3: ~₹12,303
(Zones where buying interest often emerges intraday)
🔍 Short-Term Bias & Indicators
Technical indicator signals today (1D):
RSI: Neutral/around mid-range → neither overbought nor oversold.
MACD: Bullish crossover on short timeframe.
Moving Averages (short & mid DMA/EMA): Mixed (some short EMAs bullish, some bearish), signaling consolidation bias around current price.
🕒 Summary for Today (1D)
Neutral to slightly bullish near current levels with balanced indicator setup
Key levels to watch:
Upside: 13,577 → 13,963 → 14,214
Downside: 12,940 → 12,689 → 12,303
Immediate pivot bias around ₹13,300 will determine intraday direction.

VEDL 1 Moth Time Frame 📌 Latest Market Context
• The stock is trading near multi‑month and all‑time highs (around ₹670+ on NSE) on strong momentum and positive sentiment after broker upgrades and structural catalysts.
• RSI readings suggest strong upside momentum but near overbought in some sources.
📈 1‑Month Timeframe Key Levels
(These combine pivot, swing support/resistance & recent price action ranges)
Resistance (Upside Targets)
₹656–₹660 — Upper daily pivot resistance zone.
₹650–₹656 — R2–R3 levels from technical pivot indicators.
Above ₹670–₹680 — Near current multi‑week highs / psychological zone (strong breakout if sustained).
Support (Downside Floors)
₹630–₹635 — Immediate pivot support (~S1) & short‑term cushion.
₹622–₹625 — Secondary demand zone near moving average clusters.
₹616–₹620 — Deeper swing support if short correction unfolds.
📊 What These Levels Mean
✅ Holding Above ₹630–₹635
Maintains bullish momentum in the 1‑month view.
Prospects for retesting ₹650+ and potentially ₹670–₹680 if buying continues.
⚠️ Break Below ₹620
Could open a pullback toward ₹616 and lower pivot zones before buyers re‑emerge.
A close below ~₹616 on monthly/daily charts may signal short‑term loss of structure.
📍 How to Use These Levels
Bullish Trade Setup (1M swing)
Buy or add near support ₹630–₹620 with stops slightly below ₹616
Targets: ₹650 → ₹670+
Neutral/Profit‑Taking Zone
₹650–₹670+ is the next potential resistance breakeven/exit zone
Bearish/Defensive
If price decisively closes below ₹620–₹616, reduce risk exposure and watch for support at lower levels.

ASIANPAINT - STWP Equity Snapshot________________________________________
STWP Equity Snapshot – Asian Paints Ltd (ASIANPAINT)
(Educational | Chart-Based Interpretation)
________________________________________
📌 Intraday Reference Levels (Structure-based)
Reference Price Zone: ~2,890–2,910
Risk Reference (If price weakens below structure): ~2,755
Observed Upside Areas: ~3,075 → ~3,195
________________________________________
📌 Swing Reference Levels (Hybrid Model | 2–5 days | Observational)
Reference Price Zone: ~2,890–2,910
Risk Reference (If structure breaks): ~2,685
Higher Range Area (If strength continues): ~3,325 → ~3,645
________________________________________
🔑 Key Levels – Daily Timeframe
Support Areas: 2,836 | 2,776 | 2,744
Resistance Areas: 2,928 | 2,960 | 3,020
________________________________________
🔍 STWP Market Read
Asian Paints remains in a clear upward trend. After a strong move, the stock faced selling near earlier highs and then moved into a short sideways phase. Price has now found support near the highlighted zone, showing that buyers are still active.
The structure remains positive as long as price holds above this support area. Momentum is healthy but controlled, suggesting the stock may move gradually rather than sharply in the near term.
________________________________________
📊 Chart Structure & Indicator Summary
Structure: Higher highs and higher lows
Trend: Up
Momentum: Strong but not stretched
RSI: Healthy zone (~62)
Volume: Above average, indicating participation
________________________________________
📈 Final Outlook (Condition-Based)
Momentum: Strong
Trend: Up
Risk: High (stock is near important resistance)
Volume: High
________________________________________
💡 STWP Learning Note
Strong stocks often pause before moving further. These pauses help price cool down and allow the trend to continue in a healthier way. Focus on structure, not predictions.
________________________________________
⚠️ Disclaimer
This post is shared only for educational and informational purposes. It is not a recommendation, advice, or solicitation. Equity markets involve risk. Please consult a SEBI-registered financial advisor before making any trading or investment decision.
________________________________________
📘 STWP Approach
Observe price behaviour. Respect risk. Let structure guide decisions.
________________________________________
💬 Did this snapshot help you read the chart better?
🔼 Boost to support structured learning
✍️ Share your views in comments
🔁 Forward to someone learning price action
👉 Follow for clean, beginner-friendly STWP insights
🚀 Stay Calm. Stay Clean. Trade With Patience.
Trade Smart | Learn Zones | Be Self-Reliant 📊
________________________________________

INDUSINDBK - STWP Equity Snapshot________________________________________
STWP Equity Snapshot – IndusInd Bank Ltd (INDUSINDBK)
(Educational | Chart-Based Interpretation)
________________________________________
📌 Intraday Reference Levels (Structure-based)
Reference Price Zone: ~906–908
Risk Reference (If price slips below structure): ~872
Observed Upside Areas: ~951 → ~980
________________________________________
📌 Swing Reference Levels (Hybrid Model | 2–5 days | Observational)
Reference Price Zone: ~906–908
Risk Reference (If weakness appears): ~871
Higher Range Area (If strength continues): ~981 → ~1,035
________________________________________
🔑 Key Levels – Daily Timeframe
Support Areas: 887 | 869 | 858
Resistance Areas: 916 | 926 | 945
________________________________________
🔍 STWP Market Read
IndusInd Bank has shown steady upward movement after a period of sideways trading. The price moved higher, pulled back briefly, and is now holding above an important support area. This suggests that buyers are still active and the structure remains positive.
Momentum is healthy but not aggressive. The recent move happened with normal to slightly higher trading activity, which supports the price but also indicates that the stock may move in a controlled manner rather than sharply. As long as price stays above the current support zone, the broader trend remains upward.
________________________________________
📊 Chart Structure Summary
Price Structure: Gradual rise with pauses
Trend Direction: Up
Price Strength: Stable
Momentum: Moderate
Trading Activity: Normal to slightly above average
________________________________________
📈 Final Outlook (Condition-Based)
Momentum: Moderate
Trend: Up
Risk: High (banking stocks can move quickly)
Volume: Moderate
________________________________________
💡 STWP Learning Note
Strong trends do not move in straight lines. Pullbacks and pauses are normal. Focus on how price behaves near support areas instead of trying to predict the next move.
________________________________________
⚠️ Disclaimer
This post is shared only for educational and informational purposes. It is not a recommendation or advice. Stock market investments involve risk. Please consult a SEBI-registered financial advisor before making any trading or investment decision.
________________________________________
📘 STWP Approach
Observe price behaviour. Respect risk. Let structure guide decisions.
________________________________________
💬 Did this help you understand the chart better?
🔼 Boost to support learning
✍️ Share your views or questions
🔁 Forward to someone learning chart reading
👉 Follow for clean, beginner-friendly STWP insights
🚀 Stay Calm. Stay Clean. Trade With Patience.
Trade Smart | Learn Zones | Be Self-Reliant 📊
________________________________________

PHOENIXLTD 1 Day Time Frame 📈 Current Price (approx)
Around ~₹1,867–₹1,907 on NSE during today’s session.
🔁 Daily Pivot & Key Levels (Today’s intraday reference)
Central Pivot Point:
📌 Pivot: ~₹1,903–₹1,912
Resistance Levels (Upside):
R1: ~₹1,936–₹1,940
R2: ~₹1,970–₹1,980
R3: ~₹1,994–₹2,000+
Support Levels (Downside):
S1: ~₹1,879–₹1,885
S2: ~₹1,855–₹1,866
S3: ~₹1,821–₹1,848
These are intraday pivot levels calculated from the previous day’s range and widely used for daily support/resistance barriers.
📊 Key Intraday Zones (to watch today)
Bullish Above:
Break above ~₹1,936–₹1,940 opens space toward R2 (~₹1,970) and potentially R3 (~₹2,000+).
Bearish Below:
Failure below ~₹1,885–₹1,866 may signal further downward pressure toward S3 (~₹1,821).
Pivot Reaction:
Price above pivot (~₹1,903–₹1,912) today suggests bullish bias.
Price below pivot suggests bearish/in‑range conditions.

BERGEPAINT 1 Week Time Frame 📌 Weekly Support & Resistance Levels (derived from recent weekly pivot analysis):
Resistance 3: ~570.0
Resistance 2: ~558.4
Resistance 1: ~541.3
Support 1: ~512.5
Support 2: ~500.9
Support 3: ~483.8 (lower weekly support)
📊 Alternate short‑term pivot levels (different provider):
Pivot: ~548.4
R1: ~554.8
R2: ~565.1
R3: ~571.5
S1: ~538.1
S2: ~531.7
S3: ~521.4 (intraday‑oriented pivot band)
Interpretation for 1‑Week Trading
Bullish Levels / Breakouts
Bullish breakout above ~558–570: could signal continuation to the next zone of resistance.
Holding above weekly pivot (~548–554): bullish bias for the week.
Bearish Levels / Breakdown
Major breakdown below ~512–500: opens deeper support near ~484.
Weakness under ~538: a sign of short‑term bearish pressure.
Price Context
Recent data suggests the stock has been oscillating in a range with short‑term weakness around the mid‑500s and support building around low‑500s.

UNIONBANK 1 Week Time Frame 📊 Current Price (Weekly Context)
~₹162 – ₹163 per share (latest live/NSE quote).
📈 Weekly Support & Resistance Zones (Approx)
Resistance Levels (Upside)
These are key levels to watch if the weekly price continues uptrend:
• R1 ≈ ₹167–₹168 – immediate resistance near recent 52‑week high.
• R2 ≈ ₹170–₹172 – near psychological/upper range targets.
• R3 ≈ ₹175+ – extended zone if momentum accelerates (trend continuation).
Support Levels (Downside)
Important weekly support levels where pullbacks could find buying support:
• S1 ≈ ₹158–₹159 – near recent short‑term pullback zone.
• S2 ≈ ₹155–₹156 – near mid‑range cluster of moving averages.
• S3 ≈ ₹150–₹152 – deeper support aligned with 50‑day average zone.
🔄 Technical Indicators Outlook (Weekly / Short‑Term)
Momentum & Trend:
Weekly technicals show bullish momentum with RSI moderately bullish and MACD positive on recent data.
Price remains above key EMAs (20, 50, 100, 200 averages), which supports the uptrend.
Volatility:
ATR and trend indicators suggest active movement, so breaks above/below key levels can lead to sustained swings.
📌 Quick Weekly Levels Summary (Approx)
Level Type Price Zone
R3 (Strong Resist) ₹172–₹175+
R2 (Next Resist) ₹170–₹172
R1 (Immediate Resist) ₹167–₹168
Current Price ₹162–₹163
S1 (Immediate Support) ₹158–₹159
S2 (Mid Support) ₹155–₹156
S3 (Strong Support) ₹150–₹152

PNB 1 Day Time Frame 📊 Daily Support & Resistance Levels
These are common pivot-style levels based on recent price action — good for short-term intraday/next-day reference:
Pivot (Daily Reference Zone): ~₹123.5-₹124 range (approximate)
Resistance Levels (Upside Targets)
R1: ~₹124.9–₹125.0 — first resistance zone near recent pivot upside.
R2: ~₹127.1–₹127.2 — higher resistance zone on daily.
R3: ~₹128.4–₹128.5 — extended resistance near recent highs.
Support Levels (Downside Barriers)
S1: ~₹121.5–₹121.8 — immediate support close below pivot.
S2: ~₹120.2–₹120.7 — secondary support zone.
S3: ~₹118.0–₹118.0+ — deeper support if price weakens.
📉 Other Short-Term Levels From Recent Technical Tools
Pivot-based support (Choice India): ~₹101.7, ~₹100.5, ~₹98.4 — longer-range levels (not daily but multi-session reference).
Bollinger bands (approx high/low daily bands): ~₹124.6 upper, ~₹115.0 lower.
🧠 Context from Indicators
RSI around mid-range (~50–65), suggests no extreme in daily momentum right now.
Moving average support around 50/100-day range (₹120–₹117) can act as dynamic support zones.
📌 How to Use These Levels
Bulls watch: Break above R1 (~₹125) for continuation toward R2/R3 (~₹127-128).
Bears watch: If price breaks below S1 (~₹121.5), next support comes around S2/S3 (~₹120 / ~₹118).
Pivot levels near ₹123-124 act as a short-term sentiment line — above is bullish, below is cautious.

MTARTECH - STWP Equity SnapshotPrice moved up strongly earlier, pulled back and found support.
Now it is testing the same selling area again, showing strength.
Watching how price behaves near this level is important.
STWP Equity Snapshot – MTARTECH(Educational | Chart-Based Interpretation)
📌 Intraday Reference Levels (Structure-based)
Reference Price Zone: 2,742
Risk Reference (If structure fails): 2,351.84
Observed Upside Zones: 3,210.19 → 3,522.32
📌 Swing Reference Levels (Hybrid Model | 2–5 days | Observational)
Reference Price Zone: 2,742
Risk Reference (If price weakens): 2,156.76
Higher Range Area (If strength continues): 3,912.48 → 4,790.34
Key Levels – Daily Timeframe
Support Areas: 2,548 | 2,407 | 2,310
Resistance Areas: 2,786 | 2,883 | 3,024
🔍 STWP Market Read
MTAR Technologies Ltd has moved up strongly after spending time in a sideways range. The rise happened with very high trading activity, which shows strong interest from bigger market participants. The stock also stayed strong even when the overall market was weak, which is a positive sign.
The price strength is steady and not overdone. Buying interest is clearly visible, and the move does not look rushed. As long as the price stays above the earlier breakout area, the overall price structure remains positive.
🧭 News-Linked Price Behaviour (Simple Scenarios | Educational)
Recently, a large global institution bought a stake in the company. This news has already had a positive impact on the stock price. Based on how markets usually behave after such news, a few outcomes are commonly seen:
Scenario 1: Strong and Stable Start
The stock may open slightly higher or stable and continue to trade above recent levels. This shows buyers are comfortable at higher prices.
Scenario 2: Sideways Movement
The stock may open flat and move in a narrow range. This means the market is taking time to adjust after the recent rise. This is normal and healthy.
Scenario 3: Early Rise, Then Pause
The stock may rise early in the day and then slow down or move sideways. This usually happens when short-term traders book profits and does not mean the trend has turned weak.
A sharp fall only because of this news is unlikely unless the overall market turns very negative.
📊 Chart Structure Summary
Price Structure: Strong move after a long pause
Trend Direction: Up
Price Strength: Strong
Momentum: Positive
Trading Activity: Very high, supporting the move
📈 Final Outlook (Condition-Based)
Momentum: Strong
Trend: Up
Risk: High (price can move fast both ways)
Volume: High
💡 STWP Learning Note
News can bring attention, but price behaviour after the news matters more. When price stays strong after a rise, it shows confidence. Focus on how price holds important levels instead of guessing what will happen next.
⚠️ Disclaimer
This post is for educational purposes only. It is not a recommendation or advice. Stock market investments involve risk. Please consult a SEBI-registered financial advisor before making any trading or investment decision.
📘 STWP Approach
Watch price behaviour. Control risk. Let the chart guide you.
💬 Did this help you understand the market better?
🔼 Boost to support learning
✍️ Share your thoughts or questions
🔁 Forward to someone who is learning trading
👉 Follow for simple, structured STWP insights
🚀 Stay Calm. Stay Clean. Trade With Patience.
Trade Smart | Learn Zones | Be Self-Reliant 📊

BEL 1 Day Tie Frame 📍 Current Quote & Daily Price Range (approx)
Current Price: ~ ₹418.65 (latest close / last traded price)
Day’s Low / High: ~ ₹415.85 – ₹424.55
📊 Daily Pivot & Levels (Standard / Fibonacci)
(Calculated from most current data available)
🔥 Pivot Points (Fibonacci Basis):
Pivot (Central): ₹417.55
Resistance 1 (R1): ₹420.95
Resistance 2 (R2): ₹423.05
Resistance 3 (R3): ₹426.45
🛡️ Support Levels:
Support 1 (S1): ₹414.15
Support 2 (S2): ₹412.05
Support 3 (S3): ₹408.65
📌 Alternative Broker‑Derived Levels (Correlation)
These are close to the pivot model above and help confirm zones:
From another live technical feed:
Pivot: ~ ₹417.55
First Support: ₹412.15
First Resistance: ₹421.05
Second Support: ₹408.65
Second Resistance: ₹426.45
Third Support: ₹403.25
Third Resistance: ₹429.95
This confirms the support zone ~₹408–412 and resistance zone ~₹421–427+.
📈 How to Interpret (Today’s Daily Chart)
✔️ Bullish continuation if price holds above:
Pivot: ₹417.55
Support zone: ₹412–₹408
✔️ Upside breakout triggers stronger moves above:
R1 / R2: ₹420.95 → ₹423+
Above ₹426+ opens room toward fresh highs.
❌ Bearish risk if price drops below:
S1‑S2 zone: ₹414 → ₹412
Break below ₹408 — downside pressure toward lower supports.

BTC/USD 1 Month Time Frame 📊 Current Price Snapshot (Latest Available)
$90,478.00
📊 1‑Month Key Levels — BTC / USD
🛑 Resistance Levels (Upside)
These are areas where price has struggled to break above recently:
1. Major Resistance: ~$108,000–$112,000
• Multiple tests and sellers here — strong supply zone.
2. Intermediate Resistance: ~$100,000
• Psychological barrier and past pivot point.
💡 A successful break above these could signal bullish continuation and a shift in momentum.
🟩 Support Levels (Downside)
These are floors where price tends to stabilize or bounce:
1. Immediate Support: ~$84,000–$87,000
• Critical support zone on monthly chart — losing this could strengthen bearish momentum.
2. Secondary Support Zone: ~$80,000
• Structural support from past price action.
3. Lower Support: ~$75,000
• Major defense area if broader sell‑offs continue.
📉 If these support levels break decisively with volume, risk increases for deeper pullbacks.
📌 How to Use These Levels
🕐 1‑Month Time Frame Interpretation
Bullish bias if BTC holds above ~$90k–$100k, especially with higher highs.
Neutral / Range‑bound if price oscillates between ~$84k–$108k.
Bearish bias if BTC breaks below ~$84k with conviction (higher volume and clear close below).
These levels reflect recent technical structure and psychological zones, commonly used by traders to set entries, exits, and risk management.

RVNL 1 Week Time Frame 📍 Current Status (as of latest market data):
RVNL trading around ₹356–₹360 on NSE/BSE.
📈 Key Levels for this Week (Intraday / Swing)
🔹 Resistance Levels
1. ₹369‑₹373 — Immediate resistance zone where short‑term counter may face selling pressure.
2. ₹377‑₹380 — Higher resistance; a breakout above this could signal short‑term bullish continuation.
🔻 Support Levels
1. ₹362‑₹357 — First support; holds short‑term pullbacks intraday.
2. ₹354‑₹350 — Deeper support — breach of this could see more downside.
3. ₹345‑₹340 — Strong support zone seen from recent chart structures (near 50DMA and consolidation).
📊 What This Means for the Next Week
✅ Bullish scenario
If RVNL closes above ₹373‑₹377 on daily closes, momentum could push towards ₹385‑₹395 in the coming sessions (momentum breakout).
Sustained buying and above‑average volumes would strengthen upside bias.
❌ Bearish scenario
A breakdown below ₹350‑₹345 could lead to a slide to ₹330‑₹325, where longer‑term support zones lie.
Daily closes below ₹350 increases the chances of deeper correction.
⚡ Neutral / Consolidation
If price stays between ₹350–₹373, expect sideways range‑bound trade before a clearer breakout direction.
🧠 Traders’ Focus This Week
✔ Watch daily closing levels above resistance / supports.
✔ Breakouts with higher volumes matter more than intraday spikes.
✔ Stop losses below the strong support zones (e.g., ~₹345) if positioning long.

HCLTECH 1 Month Time Frame 📌 Current Price Snapshot
Approx. live share price: ₹1,640–₹1,650 range on NSE today.
📅 1‑Month Price Context
Over the past month, HCLTECH has generally traded between roughly ₹1,590 – ₹1,680 before recent moves.
📊 Key 1‑Month Technical Levels
🔹 Immediate Support Levels
These are short‑term levels where price may find buying interest:
S1: ~₹1,620
S2: ~₹1,605
S3: ~₹1,592
(support levels from pivot analysis)
Additional support areas if price falls further:
~₹1,580–₹1,570 (psychological region and recent consolidation area)
🔺 Immediate Resistance Levels
These are short‑term levels where price may face selling pressure:
R1: ~₹1,647–₹1,650
R2: ~₹1,660
R3: ~₹1,670–₹1,675
(pivot‑based resistance zones)
If bulls push higher:
~₹1,690–₹1,700 is a possible zone of next resistance before bigger range tests.
📈 Trend & Moving Averages (1‑Month)
20 DMA: ~₹1,659
50 DMA: ~₹1,610
100 DMA: ~₹1,536
200 DMA: ~₹1,564
(latest moving averages reflect neutral‑to‑bullish alignment with price above most SMAs)
📌 How to Use These Levels
Bullish scenario:
If HCLTECH sustains above ₹1,650–₹1,660, the next resistance to watch is ₹1,675–₹1,700, and potential testing of recent broader highs.
Bearish scenario:
If it breaks below ₹1,592–₹1,580, short‑term support weakens and price could drift toward ₹1,550–₹1,570.

ELECON 1 Day Time Frame 📊 Live/Recent Price (India Market)
Approx. share price: ~₹479–₹515 range today (prices vary across live sources/delays).
Previous close was around ₹497–₹499.
Intraday price range seen: ~₹480 (low) to ₹517 (high).
📈 Key One‑Day Pivot & Levels
(Useful for short‑term trading/entry‑exit zones)
Pivot Points (daily):
Pivot (central) ~ ₹485–₹494 — reference mid‑point for today’s trend.
Resistance Levels:
R1: ~ ₹495–₹500 — first hurdle above current price.
R2: ~ ₹509–₹510 — next resistance / potential target on upside.
R3: ~ ₹518–₹524 — stronger upside barrier.
Support Levels:
S1: ~ ₹476–₹477 — nearest intraday support.
S2: ~ ₹470–₹471 — next downside buffer.
S3: ~ ₹461–₹462 — deeper support zone.
Pivot and fib levels are often calculated using previous day’s high‑low‑close prices to forecast intraday turning points.
📌 Summary for Today’s 1‑Day View
Bullish bias
✔ Close above R1 (~₹495) could push price toward R2 (~₹509–₹510) and R3 (~₹518–₹524).
Bearish caution
✘ A break below S1 (~₹476) might expose S2 (~₹470) and then S3 (~₹461) supports.

RELIANCE 1 Week Time Frame 📌 Current Price Snapshot
RELIANCE.NS is trading around ~₹1,507 – ₹1,510 per share on NSE.
📉 Key Weekly Support Levels
These are levels where price may find buying support on pullbacks:
🟩 Support 1: ~₹1,518 – ₹1,520 — near short‑term pivot support zone for the week.
🟩 Support 2: ~₹1,498 – ₹1,500 — next floor if sellers dominate early week.
🟩 Lower Support: ~₹1,479 – ₹1,480 — broader weekly downside reference.
👉 A weekly close above ₹1,518 would suggest short‑term stabilization before potential bounce.
📈 Key Weekly Resistance Levels
Levels where upside may face selling pressure:
🔴 Resistance 1: ~₹1,555 – ₹1,560 — nearest upside hurdle.
🔴 Resistance 2: ~₹1,600 – ₹1,612 — mid‑week challenge zone (~52‑week area).
🔴 Higher Resistance: ~₹1,630 – ₹1,668 — stretch target if bullish momentum picks up.
👉 A weekly close above ~₹1,612–₹1,620 would signal stronger bullish bias and possible follow‑through to higher levels.
📊 Weekly Price Range Estimate
Expected trading corridor for this week:
📉 Downside: ~₹1,498 – ₹1,500
📈 Upside: ~₹1,630 – ₹1,668
This range represents the key support and resistance boundaries traders may watch for breakouts or breakdowns during the week’s sessions.

WIPRO 1 Week Time Frame 🔎 Current Market Price
Approx Current Price: ~₹265–₹272 per share (latest trading range) — price moving around mid‑260s.
📅 1‑Week Timeframe Key Levels
🔥 Resistance (Upside Targets)
Level Meaning
R1: ~₹273.8 First Weekly Resistance — immediate upside ceiling.
R2: ~₹278.7 Higher Weekly Resistance — breakout level for more bullish momentum.
R3: ~₹285.0 Extended Resistance — major top zone for the week if breakout happens.
🛡 Support (Downside Floors)
Level Meaning
S1: ~₹262.7 Immediate Weekly Support — key near‑term buying zone.
S2: ~₹256.4 Secondary Support — next lower cushion if price weakens.
S3: ~₹251.6 Major Weekly Support — broad downside safety zone for this week.
➡️ Weekly Trading Range (expected): ~₹251.6 — ₹285.0 depending on strength and volatility.
📊 What This Implies
📈 Bullish Scenario
Above ~₹273.8: break past this zone could open room toward ~₹278–₹285 resistance.
Bullish continuation may be confirmed if the stock closes the week above ₹278–279.
📉 Bearish Scenario
Below ~₹262.7: breakdown under this support can expose deeper support at ~₹256 and further near ~₹251.6.
A weekly close lower than key supports suggests range continuation or mild negative bias.

RAMCOCEM 1 Week Time Frame📌 Current Price (Approx)
~₹1,060 per share (latest trading range) — stock has been trading around this level recently.
📉 1-Week Key Levels (Support & Resistance)
🔹 Support Levels
Support 1: ~₹1,050 — short-term support zone.
Support 2: ~₹1,040–₹1,042 — secondary support.
Support 3: ~₹1,032–₹1,035 — deeper weekly support.
👉 If price closes below ₹1,040 on weekly basis, it may signal short-term weakness.
🔺 Resistance Levels
Resistance 1: ~₹1,068–₹1,070 — first near-term hurdle.
Resistance 2: ~₹1,077–₹1,078 — higher weekly resistance.
Resistance 3: ~₹1,087–₹1,093 — extended resistance zone.
👉 Break above ₹1,070–₹1,078 could open room toward ~₹1,087–₹1,093+ levels this week.
📊 Weekly Price Action Summary
Price has been trading near ~₹1,060 range, making this region a pivotal short-term level.
Short-term oscillators and technical ratings are mixed/neutral to mild buy.
Bullish bias this week if price stays above ₹1,050–₹1,055 and takes out ₹1,070+.
Bearish tilt if price closes below ₹1,040–₹1,050 on a weekly chart.
📍 Summary: 1-Week Levels
Level Type Price Zone
Major Support ₹1,050
Next Support ₹1,040–₹1,042
Lower Support ₹1,032–₹1,035
First Resistance ₹1,068–₹1,070
Higher Resistance ₹1,077–₹1,078
Extended Resistance ₹1,087–₹1,093+

BAJAJ-AUTO 1 Week Time Frame 📈 Current Price Context (Approx)
Bajaj Auto trading around ₹9,000–9,600 range recently (data from live quotes).
🔹 Weekly Resistance Levels
These are key upside levels where price may face selling pressure on a weekly chart:
1. ~₹9,650–₹9,700 — First major resistance zone
2. ~₹9,800–₹9,920 — Stronger resistance band
3. ~₹10,000+ — Higher breakout zone if trend continues up
(above this, momentum can accelerate)
Weekly resistance summary (approx):
R1 ~ ₹9,650
R2 ~ ₹9,800–9,920
R3 ~ ₹10,000+
🔻 Weekly Support Levels
These are key downside levels that might act as support in a correction on the weekly timeframe:
1. ~₹9,331–₹9,380 — Short-term weekly support
2. ~₹9,150–₹9,200 — Important weekly zone
3. ~₹9,000 — Psychological and minor weekly support
4. ~₹8,800–₹8,900 — Stronger lower support (break here could weaken trend)
Weekly support summary (approx):
S1 ~ ₹9,330
S2 ~ ₹9,150–₹9,200
S3 ~ ₹9,000
Lower support ~ ₹8,800–₹8,900
📊 Trend & Momentum Indicators
Weekly/daily technical indicators broadly show buy signals / positive trend structure (moving averages mostly below price) — suggesting upside continuation if major resistance zones are taken out.
