BSE – Heavy Call Writing Indicates Resistance Ahead________________________________________
📈 BSE – Heavy Call Writing Indicates Resistance Ahead | OI + Price Action Analysis
🕒 Chart Type: 15-Minute
📆 Date: July 7, 2025
________________________________________
🔍 What’s Catching Our Eye:
BSE is trading near ₹2636, and the Option Chain is showing aggressive Short Build-Up on Calls from 2650 to 3000, clearly highlighting a resistance zone above current price. Meanwhile, Put writers are unwinding, especially at ₹2600 PE, confirming weak bullish conviction. Traders are playing defensively with bearish bias dominating.
________________________________________
📌 What We’re Watching For:
If BSE breaks below ₹2600, we may see a quick slide toward ₹2550–2500. However, a sharp breakout above ₹2700 with strong volume may trigger a round of short-covering. Until then, upside looks capped due to excessive Call writing.
________________________________________
📊 Volume Footprint:
Options activity is backed by strong volume —
• Over 8.9k contracts at ₹2700 CE
• Over 8.1k contracts at ₹2800 CE
• Over 7k contracts at ₹3000 CE
→ Traders are betting on price staying below 2700–2800 levels, creating a strong supply wall.
________________________________________
📈 Option Chain Highlights:
• Calls (Short Build-Up):
o ₹2700 CE: +81,375 OI | Price ↓ 8.82%
o ₹2800 CE: +18,375 OI | Price ↓ 11.07%
o ₹3000 CE: +77,250 OI | Price ↓ 16.60%
o ₹2650 CE: +38,250 OI | Price ↓ 8.01%
• Puts:
o ₹2600 PE: -42,375 OI | Price ↓ 10.94% → Long Unwinding
o ₹2500 PE: +102,375 OI | Price ↓ 16.55% → Short Build-Up
📌 Inference:
Bulls are on the back foot. CE writers are dominating across all key strikes, and only the 2500 PE is showing fresh interest — which is far from spot, indicating potential room for further downside.
________________________________________
🔁 Trend Bias:
🔴 Bearish to Neutral – Unless 2700 breaks cleanly
________________________________________
🧠 Trade Logic / Reasoning:
Every CE strike from ATM to OTM is under short build-up — that's a clear ceiling forming. With no visible strength in Put writing near spot, the path of least resistance appears to be on the downside. Keep a close eye on ₹2600.
________________________________________
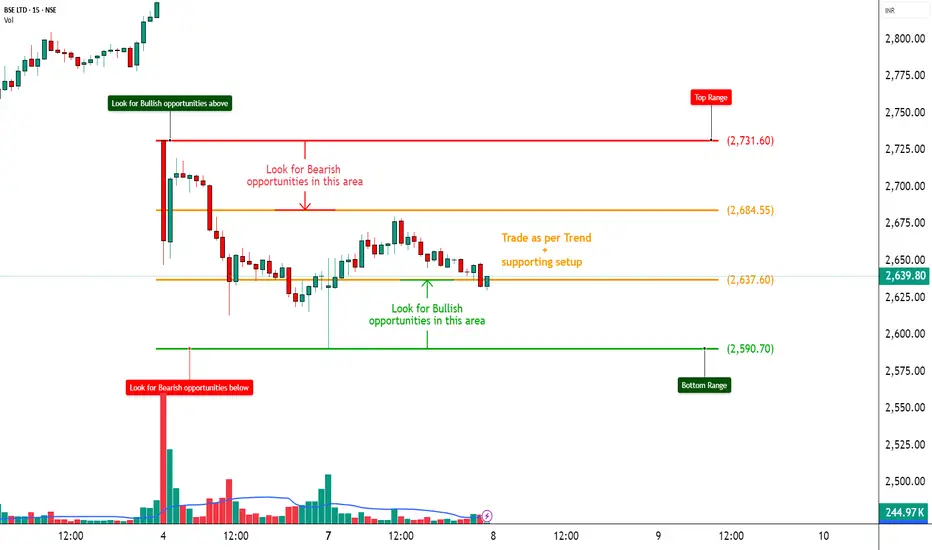
📍 Important Levels to Mark:
🔺 Top Range (Resistance): ₹2731.60
🔻 Bottom Range (Support): ₹2590.70
________________________________________
🎯 Trade Plan (Educational Purpose Only):
✅ Best Buy (Equity): Only if BSE crosses ₹2700 with volume
✅ Best Sell (Equity): Below ₹2600 for target ₹2550–2500
✅ Best CE to Long: ❌ None – All major Calls under Short Build-Up
✅ Best PE to Long: ₹2500 PE – Showing fresh bearish positioning
🟢 Demand Zone: NA
🔴 Supply Zone: NA
⚠️ Invalidation Below:
Bullish view invalidated if price sustains below ₹2600
________________________________________
⚠️ Disclaimer:
This analysis is for educational purposes only.
STWP is not a SEBI-registered advisor.
No buy/sell recommendations are made.
Please consult your financial advisor before trading.
STWP is not responsible for trading decisions based on this post.
________________________________________
💬 Spotting the weakness early helps plan smarter.
What’s your view on BSE – comment below ⬇️
🔁 Share this if you're tracking BSE this week
✅ Follow STWP for clean price + OI based setups
🚀 Be Self-Reliant | Trade with Patience | Learn with Logic
________________________________________
Chartstudy
HINDUNILVR – TECHNICAL ANALYSIS________________________________________
📈 HINDUNILVR – TECHNICAL ANALYSIS
📆 Date: July 8, 2025 | ⏱ Timeframe: Daily Chart
🔍 Educational Breakdown – For Learning & Study Use Only
________________________________________
🔹 Price Action Zones
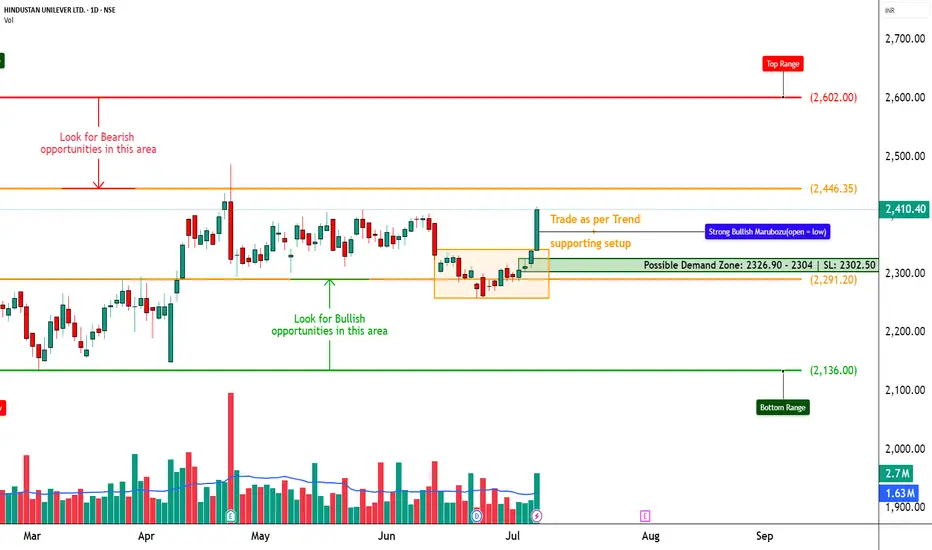
• 🔴 Top Range: 2602
• Resistance: 2437.07 – 2463.73 – 2511.77
• 🟢 Bottom Range: 2136
• Support: 2287.67 – 2314.33 – 2362.37
________________________________________
🔹 Chart Pattern: ✅ Bullish Marubozu Breakout
Price bounced from a demand zone near 2326.90 – 2304| SL: 2302.50 with a powerful Marubozu candle and reclaimed structure strength. This breakout aligns with STWP’s HNI setup and suggests the beginning of a strong bullish leg.
________________________________________
🔹 Reversal Candlestick Patterns:
✅ Bullish Marubozu
✅ Strong follow-through near support
✅ High conviction breakout from base – Open = Low
________________________________________
🔹 Volume Footprint:
✅ Volume spiked to 2.7M (vs average 1.63M)
✅ Indicates institutional participation backing the breakout
🚨 Watch for continuation volume above 2415 to confirm momentum
________________________________________
🔹 Trend Bias: ✅ Bullish
Clear bullish trend forming after breakout. Supports are holding, and resistance levels are now being tested with strength.
________________________________________
📌 What’s Catching Our Eye:
• STWP HNI Setup triggered at 2400–2415 range
• Breakout above strong support near 2300–2320
• OI Data and Option Chain analysis supports upward continuation
________________________________________
👀 What We’re Watching For:
• Sustained close above 2415 = bullish continuation
• Option build-up hints at possible follow-through toward higher zones
• Strong CE activity at 2420, 2440, and 2460 levels
________________________________________
🔹 OPTION CHAIN ANALYSIS – KEY TAKEAWAYS
💥 CALL Side (Bullish Builds):
• 2420 CE: 40.05 – 📈 OI up +158%, Long Build-Up
• 2440 CE: 31.25 – 📈 OI up +182%, Long Build-Up
• 2460 CE: 24.50 – 📈 OI up +345%, Long Build-Up
• 2500 CE: 14.45 – 📈 OI up +22%, Long Build-Up
🚀 Indicates participants are positioning for extended upside toward 2460–2500
📉 PUT Side (Writers in Control):
• 2300 PE: Down -60%, Short Build-Up
• 2400 PE: Down -52%, Short Build-Up
💡 Suggests confidence that price will hold above 2400
🧠 Conclusion from OI Data:
Strong bullish sentiment — Call Writers/Buyers increasing exposure at higher strikes, Puts being shorted. Volume + OI = directional strength.
________________________________________
⚠️ Risks to Watch:
• Close below 2390–2395 = early weakness sign
• Bearish divergence + volume fade risk
• Watch 2460–2512 for rejection
________________________________________
🔮 What to Expect Next:
• ⚡ Price retesting 2460 zone likely
• 🔄 Pullbacks toward 2395–2405 may offer low-risk re-entry
• ⚠️ Watch for spikes in volatility near 2500
________________________________________
📊 Trade Plan (Educational Only – Based on Logic + Volume Confirmation)
🔼 Breakout Long Setup
• Entry: Above 2415
• Stop Loss: 2339.30
• Risk–Reward: 1:1 to 1:2 +
📌 Why:
• Bullish Marubozu + Volume
• OI Long Build-Up at 2420–2460
• STWP HNI Setup alignment
🔁 Pullback Long Setup
• Entry Zone: 2395–2400
• Stop Loss: 2365
• Risk–Reward: 1:1 to 1:2 +
📌 Why:
• Breakout retest zone
• Tight SL with continuation logic
🔽 Bearish Setup (Only on Failure)
• Entry: Below 2360
• Stop Loss: 2410
• Risk–Reward: Flexible (trader-defined)
📌 Why:
• Only valid on strong breakdown with volume
• Reversal below structure
________________________________________
📊 Option Trade Ideas – For Learning Purpose Only
🔼 Best CE (Bullish Bias)
➡️ 2420 CE @ 40.05
• Risk–Reward Potential: 1:1 to 1:2+
🛑 SL: 26
📌 Why: Clean momentum zone, well-aligned with breakout
🟡 Alternate CE (Momentum Extension)
➡️ 2440 CE @ 31.25 – if expecting further move toward 2490–2510
• Slightly lower Delta, higher risk-reward
🔽 Best PE (Only if Breakdown)
➡️ 2400 PE @ 34.40
• Use only below 2390 with high-volume reversal
• Risk–Reward Potential: 1:1 to 1:2 +
🛑 SL: 21
________________________________________
❌ Invalidation Triggers:
• Daily close below 2360
• Long unwinding on CE strikes
• PE Long Build-Up + Volume = Bearish Shift
________________________________________
⚠️ Disclaimer:
This analysis is for educational purposes only.
“STWP HNI Setup” is a proprietary internal model shared for study and learning.
STWP is not a SEBI-registered advisor.
This is not a buy/sell recommendation.
Please consult your financial advisor before taking any action.
STWP is not responsible for trading decisions based on this post.
________________________________________
💬 Found this helpful?
Did the STWP HNI Setup help you anticipate the move?
💭 Drop your thoughts in the comments ⬇️
🔁 Share this with fellow traders
✅ Follow STWP for volume-based, logic-driven setups
🚀 Be Self-Reliant | Trade with Patience | Learn with Logic
________________________________________
RELIANCE – Trapped Between Strikes📈 RELIANCE – Trapped Between Strikes | Option Chain + Price Action Insights
🕒 Chart Type: 15-Minute
📆 Date: July 3, 2025
________________________________________
🔍 What’s Catching Our Eye:
RELIANCE is hovering just above ₹1,517.8 and facing resistance from rising short positions on Calls across 1540–1580 levels. Despite minor short covering at the 1500 and 1520 CEs, fresh Short Build-Up is visible across most strikes, suggesting upward moves are being capped. On the flip side, Puts between 1500–1530 are also witnessing Short Build-Up, indicating traders aren't expecting a major breakdown either.
________________________________________
📌 What We’re Watching For:
RELIANCE appears range-bound, and clear directional strength is missing. Price needs to decisively break above ₹1,540 for bullish strength to materialize. On the downside, support exists around ₹1,500, but if that breaks, expect pressure to mount quickly.
________________________________________
📊 Volume Footprint:
Heavy volume on both sides:
• 13k+ contracts at 1520 CE
• 11k+ contracts at 1600 CE
• Over 9k contracts traded at 1500–1530 PE
→ Traders are actively betting on both sides, suggesting volatility ahead.
________________________________________
📈 Option Chain Highlights:
• Call Side:
o 1530 CE → Long Build-Up (+2.45% OI)
o 1540 CE → Long Build-Up (+2.45%)
o 1550–1580 CE → Short Build-Up, signaling resistance buildup
o 1520 CE → Short Covering
• Put Side:
o 1500–1530 PE → Short Build-Up, hinting at base support around 1500
Inference: The tug-of-war is real. Calls are being written at higher strikes while Puts are being sold at lower strikes. That creates a tight range of ₹1,500–1,540, with traders unsure of breakout direction.
________________________________________
🔁 Trend Bias:
🟡 Neutral to Slightly Bullish – Only if ₹1,540 is reclaimed with volume
________________________________________
🧠 Trade Logic / Reasoning:
Price is squeezed between the ₹1,500 Put writers and ₹1,540+ Call writers. This is a textbook “compression zone” where a breakout or breakdown may soon follow. If bulls want control, they must push above ₹1,540 with volume and follow-through. Else, expect the sideways to weak bias to continue.
________________________________________
📍 Important Levels to Mark:
🔺 Top Range (Resistance): ₹1,540 – Break & sustain needed for upside
🔻 Bottom Range (Support): ₹1,500 – Breakdown will shift sentiment bearish
________________________________________
🎯 Trade Plan (Educational Purpose Only):
✅ Best Buy (Equity): Only above ₹1,540 with confirmation
✅ Best Sell (Equity): If price breaks below ₹1,500
✅ Best CE to Long: 1530 CE – Strong long build-up with good delta
✅ Best PE to Long: Avoid – PE sellers still active; no breakdown confirmed
🟢 Demand Zone: NA
🔴 Supply Zone: NA
⚠️ Invalidation Below:
Bullish view invalid if price fails at ₹1,540 or slips below ₹1,500 with volume
________________________________________
⚠️ Disclaimer:
This analysis is for educational purposes only.
STWP is not a SEBI-registered advisor.
No buy/sell recommendations are made.
Please consult your financial advisor before trading.
STWP is not responsible for any trading decisions based on this content.
________________________________________
💬 Found this helpful?
Drop your feedback in the comments ⬇️
🔁 Share with traders who track RELIANCE
✅ Follow STWP for consistent zone + option chain insights
🚀 Let’s trade smart, with patience and clarity!

DMART – Mixed Signals with Option Chain Clues________________________________________________________________________________📈 DMART – Mixed Signals with Option Chain Clues | Option Chain + Price Action Analysis
🕒 Chart Type: 15-Minute
📆 Date: July 3, 2025
________________________________________________________________________________
🔍 What’s Catching Our Eye:
DMART is displaying notable volatility near its technical range. While the option chain reveals contrasting setups across strikes—with several Calls showing short build-ups and some Puts indicating long build-ups—the overall price action remains undecided. The current equity price (spot at 4348.70) is being carefully watched in relation to its normalized chart range.
________________________________________________________________________________
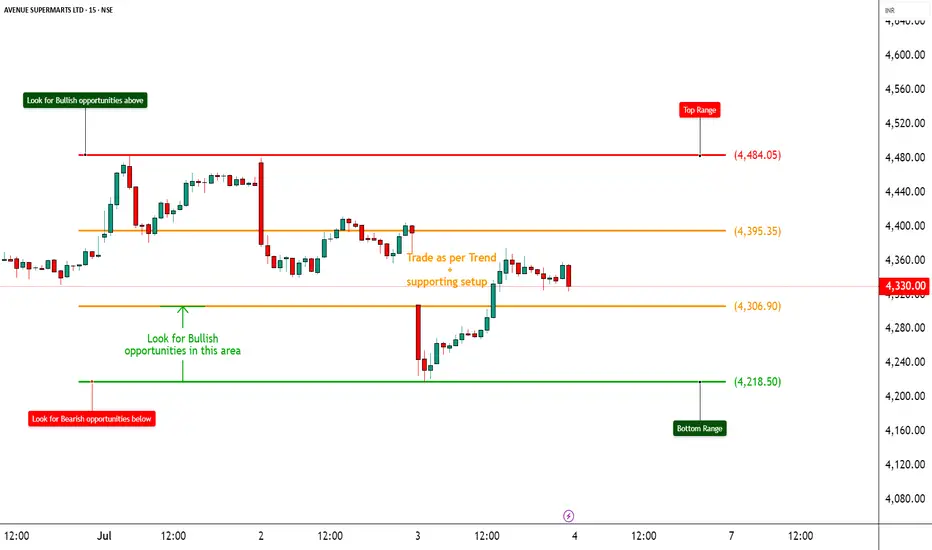
📌 What We’re Watching For:
We’re monitoring for a decisive move beyond the established range. A sustained move above the Top Range of 2464.4 (normalized chart level) could validate a bullish reversal; conversely, a breakdown below the Bottom Range of 2326.1 might trigger a bearish slide. Given the option chain dynamics, any clear directional breakout—supported by volume—will be key to shaping our view.
________________________________________________________________________________
📊 Volume Footprint:
Today’s volume is recorded at 1.83M, significantly higher than the previous 836.47k, indicating an active session. A continued high volume reading on a breakout or breakdown from our range will be critical for confirmation.
________________________________________________________________________________
📈 Option Chain Highlights:
• On the Call side, the 4,500 CE and 4,300 CE are showing strong short build-ups, while the 4,400 CE stands out with a long build-up—hinting at an emerging bullish bias if the price rallies. Additionally, the 4,600 CE continues to exhibit short build-up pressure.
• On the Put side, the 4,200 PE displays a strong long build-up, suggesting downside protection, and the 4,000 PE also shows long build-up. A notable short covering is observed in the 4,300 PE and the 4,250 PE shows additional long build-up.
These option-chain cues—combined with the volatility in the underlying—highlight the market’s mixed expectations.
________________________________________________________________________________
🔁 Trend Bias:
The bias remains directionally dependent—bullish if a reversal above the top range is confirmed, or bearish if the price falls below the bottom range.
________________________________________________________________________________
🧠 Trade Logic / Reasoning:
DMART’s price action is teetering near its critical range. The normalized technical levels (Top Range: 2464.4, Bottom Range: 2326.1) serve as key decision zones. On the options side, the presence of long build-up in the 4,400 CE suggests that, if the price reverses, buyers could step in. In contrast, the strong long build-up on the 4,200 PE underlines the protective positions if the price breaks lower. With a higher session volume amplifying the move’s significance, caution is warranted until a clear breakout or breakdown occurs.
________________________________________________________________________________
📍 Important Levels to Mark:
🔺 Top Range: 2464.4 – Look for a breakout or a reversal candlestick pattern with confirmatory volume
🔻 Bottom Range: 2326.1 – Watch for a breakdown or a bullish reversal pattern with volume support
________________________________________________________________________________
🎯 Trade Plan (Educational Purpose Only):
✅ Best Buy (Equity): Enter long on DMART if a robust bullish reversal is confirmed—ideally when the price reclaims above the top range (2464.4) with strong volume and supportive candlestick action.
✅ Best Sell (Equity): Take short positions if the price decisively breaks and holds below the bottom range (2326.1) on high volume.
✅ Best CE to Long: Opt for the 4,400 CE when the reversal is underway; its long build-up in the option chain signals the initiation of bullish interest.
✅ Best PE to Long: In a bearish scenario, consider the 4,200 PE—its long build-up indicates traders are positioning for a downside move.
🟢 Demand Zone: NA
🔴 Supply Zone: NA
⚠️ Invalidation Below:
Any bullish setup becomes invalid if DMART breaks and holds below the bottom range of 2326.1 (normalized level) with strong volume.
________________________________________________________________________________
⚠️ Disclaimer:
This post is for educational purposes only.
STWP is not a SEBI-registered advisor.
This is not a buy/sell recommendation.
Please consult your financial advisor before trading.
STWP is not responsible for any trading outcomes.
________________________________________________________________________________
💬 Found this helpful?
Drop your thoughts in the comments ⬇️
🔁 Share with fellow traders
✅ Follow STWP for zone-based price action & option chain insights
🚀 Let’s boost awareness of smart & patient trading!
________________________________________________________________________________
ASIANPAINT – Strong Bounce from Demand Zone________________________________________________________________________________📈 ASIANPAINT – Strong Bounce from Demand Zone | Option Chain + Price Action Breakdown
🕒 Chart Type: 15-Minute
📆 Date: July 3, 2025
________________________________________________________________________________
🔍 What’s Catching Our Eye:
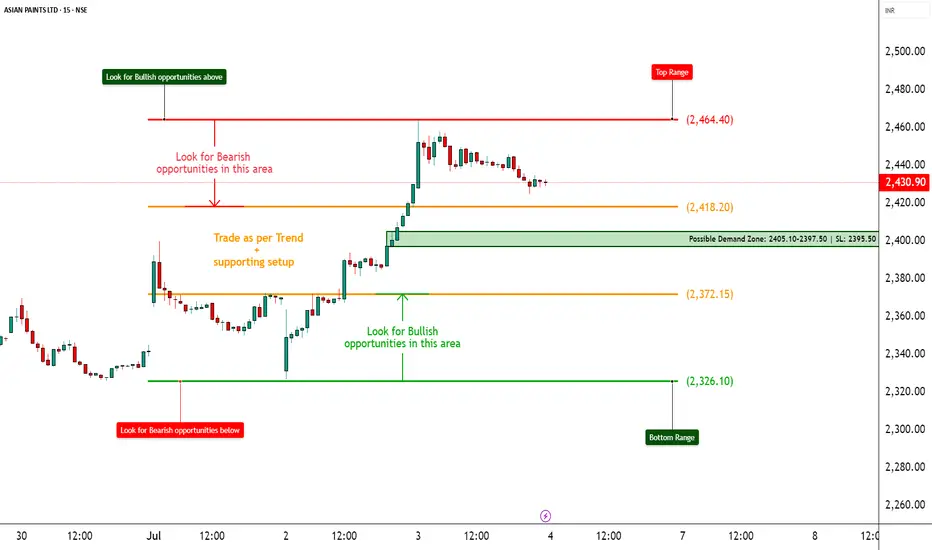
ASIANPAINT saw a sharp intraday rebound from its marked demand zone at ₹2405–₹2397.50, with price closing near ₹2,430.90. The reversal occurred on higher volume and in the presence of long build-ups across multiple Call strikes. This suggests institutional interest and a potential shift in short-term sentiment.
________________________________________________________________________________
📌 What We’re Watching For:
The key observation is that ASIANPAINT respected its demand zone and bounced with strength. If the price sustains above ₹2,440, it could trigger continuation toward the top range of ₹2,464.40. On the downside, any failure to hold the demand zone may bring back pressure toward ₹2,400. Option chain data supports the bullish bias, with fresh long positions across ATM and OTM calls.
________________________________________________________________________________
📊 Volume Footprint:
Today’s volume was 1.55M, higher than the previous 1.36M, signaling strong participation during the bounce. A continuation move with volume > 1.5M may validate breakout setups.
________________________________________________________________________________
📈 Option Chain Highlights:
The 2,500 CE, 2,460 CE, and 2,440 CE all witnessed strong long build-ups, confirming bullish positioning. Even the deep OTM 2,600 CE showed healthy open interest increase. Meanwhile, 2,400 PE showed short build-up, suggesting put writers are confident that the ₹2,400 level will hold. Notably, 2,400 CE also saw short covering, adding further weight to the bullish narrative.
________________________________________________________________________________
🔁 Trend Bias:
🟢 Bullish above ₹2,440, especially if volume confirms a clean move
________________________________________
🧠 Trade Logic / Reasoning:
The bounce from demand was technical and backed by derivatives activity. The presence of long build-ups across multiple Calls and the short covering at 2400 CE suggests strength. Since price closed above key EMA zones and respected the lower boundary, it builds a solid case for an upward move, unless volume suddenly drops or a fresh supply emerges.
________________________________________________________________________________
📍 Important Levels to Mark:
🔺 Top Range Resistance: ₹2,464.40 – Watch for bullish breakout or reversal candlestick
🔻 Bottom Range Support: ₹2,326.10 – Deeper support; unlikely to come into play unless 2400 breaks
________________________________________________________________________________
🎯 Trade Plan (Educational Purpose Only):
✅ Best Buy (Cash/Futures):
Buy above ₹2,440 with bullish price action and volume confirmation. Reversal from the demand zone is valid as long as price holds above ₹2,405.
✅ Best Sell (Cash/Futures):
Sell only below ₹2,405 if the price breaks the demand zone with high volume and bearish structure. Downside may open toward ₹2,380–₹2,360.
💼 Best CE to Long:
2,440 CE or 2,460 CE – Both strikes show strong Long Build-Up; ideal for directional continuation above ₹2,440.
📉 Best PE to Long:
2,400 PE – Consider only if price breaks and sustains below ₹2,405 with heavy volume and weak candle close. Risk-reward turns favourable for downside hedging.
🟢 Demand Zone: ₹2405.10 – ₹2397.50 | SL: ₹2395.50
🔴 Supply Zone: Not clearly visible yet (watch ₹2464+ for fresh seller emergence)
⚠️ Invalidation Below:
Bullish bias invalid if price closes below ₹2,395 with strong volume and momentum.
________________________________________________________________________________
⚠️ Disclaimer:
This post is for educational purposes only.
STWP is not a SEBI-registered advisor.
This is not a buy/sell recommendation.
Please consult your financial advisor before trading.
STWP is not responsible for any trading outcomes.
________________________________________________________________________________
💬 Found this helpful?
Drop your thoughts in the comments ⬇️
🔁 Share this with fellow traders
✅ Follow STWP for zone-based price action & option chain insights
🚀 Let’s grow awareness for structured & patient trading!
________________________________________________________________________________
NIFTY – Range-Bound but Bearish Tilt Emerging📈 NIFTY – Range-Bound but Bearish Tilt Emerging | Option Chain + Price Action Analysis
🕒 Chart Type: 15-Minute
📆 Date: July 3, 2025
________________________________________
🔍 What’s Catching Our Eye:
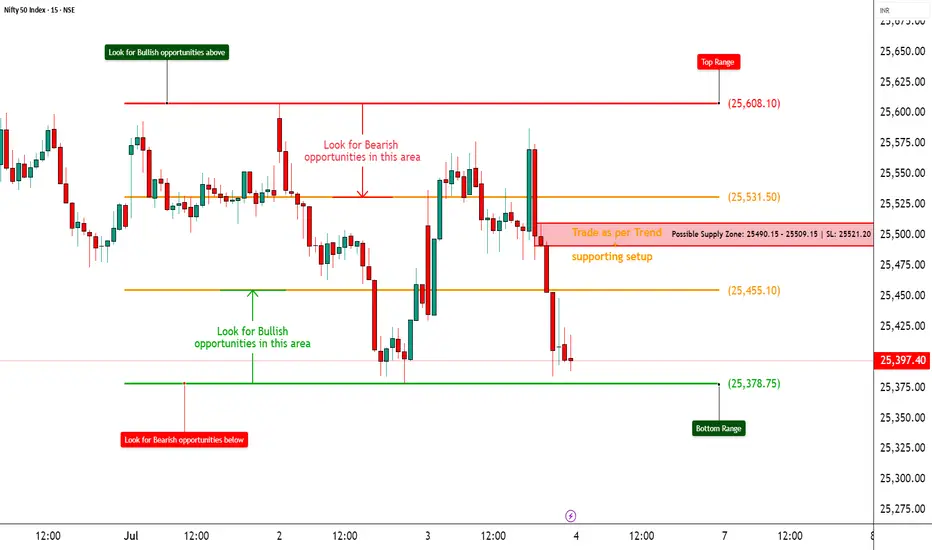
NIFTY closed at ₹25,397.40, hugging the key support zone at ₹25,378. The index remains inside a well-defined range, but the sharp rejection from the ₹25,490–₹25,509 supply zone highlights sustained selling pressure. The failure to reclaim ₹25,455 signals caution from buyers.
________________________________________
📌 What We’re Watching For:
The ₹25,378 level is crucial. A breakdown below it with volume could ignite fast momentum towards ₹25,300–₹25,250. On the other side, a bullish reversal setup is only valid if NIFTY reclaims ₹25,455 with a strong candle and high volume. Option data tilts clearly bearish, showing confidence from institutions—not speculation.
________________________________________
📊 Volume Footprint:
Current volume stands at 293.43M, lower than the previous session’s 330.09M, indicating reduced participation and indecision. Watch for a volume spike below ₹25,378 (for breakdown confirmation) or above ₹25,455 (to validate reversal strength).
________________________________________
📈 Option Chain Highlights:
The 25,500 CE shows heavy short build-up, with OI sharply higher—clear sign of strong resistance. The 25,600 CE adds to that pressure with additional short positions. Meanwhile, 25,400 PE is witnessing long build-up, and strong OI in 25,000 PE shows downside anticipation. Overall, OI positioning strongly supports a bearish view.
________________________________________
🔁 Trend Bias:
🔴 Bearish unless NIFTY reclaims and sustains above ₹25,455
________________________________________
🧠 Trade Logic / Reasoning:
Price remains in a supply-driven setup, with a sharp rejection seen from ₹25,490–₹25,509. Support at ₹25,378 has held so far but looks increasingly fragile. Option chain behaviour reinforces this bearish bias—Call writers dominating higher levels and Put buyers building exposure at lower strikes.
________________________________________
📍 Important Levels to Mark:
🔺 Top Range: ₹25,608 – Look for breakout or reversal candlestick pattern + volume
🔻 Bottom Range: ₹25,378 – Watch for breakdown or bullish reversal pattern + volume
________________________________________
🎯 Trade Plan (Educational Purpose Only):
✅ Best Sell: Long - 25,400 PE – If breakdown below ₹25,378 confirms with volume
✅ Best Buy: Long 25,300 CE if price reclaims ₹25,455 + ₹25,490 zone with a strong bullish candle + volume
🟢 Demand Zone: NA
🔴 Supply Zone: ₹25,490–₹25,509 (Confirmed rejection area)
⚠️ Invalidation Below:
Bullish view becomes invalid if NIFTY breaks and holds below ₹25,378 with strong volume
Bearish view loses strength if NIFTY reclaims ₹25,455 with follow-through
________________________________________
⚠️ Disclaimer:
This post is for educational purposes only.
STWP is not a SEBI-registered advisor.
This is not a buy/sell recommendation.
Please consult your financial advisor before trading.
STWP is not responsible for any trading outcomes.
________________________________________
💬 Found this helpful?
Drop your thoughts in the comments ⬇️
🔁 Share with fellow traders
✅ Follow STWP for zone-based price action & option chain insights
🚀 Let’s boost awareness of smart & patient trading!
BANKNIFTY – On the Edge of Breakdown📈 BANKNIFTY – On the Edge of Breakdown | Option Chain + Price Action Analysis
🕒 Chart Type: 15-Minute
📆 Date: July 3, 2025
🔍 What’s Catching Our Eye:
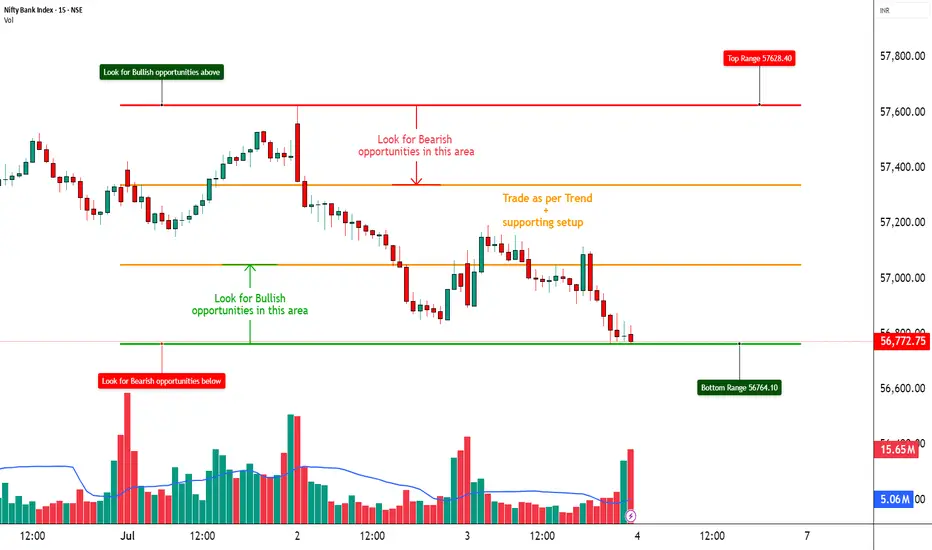
BANKNIFTY is sitting dangerously close to the ₹56,770 support zone, which has been tested multiple times. Price action remains weak, and failure to bounce indicates rising pressure on this level.
📌 What We’re Watching For:
We’re closely monitoring the price action near ₹56,770 — a breakdown below this key level could trigger a sharp pick-up in bearish momentum. On the flip side, any meaningful reversal setup will only be considered valid if BANKNIFTY reclaims ₹57,100 with a strong bullish candlestick supported by volume. As of now, the option chain data continues to heavily favor the bears, offering more confirmation than speculation for a potential downside move.
📊 Volume Footprint:
The current volume stands at 149.89M, slightly lower than the previous session’s 162.75M, indicating a mild drop in participation. This suggests that traders are in a wait-and-watch mode. A sharp surge in volume—especially on a move below ₹56,770—could validate a breakdown and trigger momentum on the downside.
📈 Option Chain Highlights:
The 57000 PE is showing a strong long build-up, signaling that traders are positioning for further downside. On the other hand, the 57000 CE has witnessed a heavy short build-up, reinforcing the bearish sentiment. Additionally, lower strike PEs between 56700 and 56900 are also displaying long build-up, further confirming downside pressure. Meanwhile, Call OI is increasing at higher strikes, indicating that resistance is likely forming in the 56900–57200 range.
🔁 Trend Bias:
🔴 Bearish unless we reclaim and sustain above ₹57,100 with confirmation
🧠 Trade Logic / Reasoning:
There is a visible and well-established supply zone between ₹57,400 and ₹57,600, which has consistently capped upside attempts. On the downside, the ₹56,770 support is showing signs of exhaustion due to repeated tests. Derivative data continues to favor the sellers, with strong bearish positioning in the option chain. As there is no visible sign of a reversal yet, it's prudent to remain cautious on taking any premature long positions.
📍 Important Levels to Mark:
🔺 Top Range: 57,600 - Look for breakout or reversal candlestick pattern + volume
🔻 Bottom Range: 56,770 - Watch for breakdown or bullish reversal pattern + volume
🎯 Trade Plan (Educational Purpose Only):
✅ Best Sell: 57000 PE – Long Build-Up present, indicating institutional downside play
✅ Best Buy: 56500 CE – if reversal above 57,100 is confirmed with price action
🟢 Demand Zone: NA
🔴 Supply Zone: NA
⚠️ Invalidation Below:
Any bullish view becomes invalid if BANKNIFTY breaks and holds below 56,750 with high volume
⚠️ Disclaimer:
This post is for educational purposes only.
STWP is not a SEBI-registered advisor.
This is not a buy/sell recommendation.
Please consult your financial advisor before trading.
STWP is not responsible for any trading outcomes.
💬 Found this helpful?
Drop your thoughts in the comments ⬇️
🔁 Share with fellow traders
✅ Follow STWP for zone-based price action & option chain insights
🚀 Let’s boost awareness of smart & patient trading!
Price Action Case Study: Weekly Price action chart of SIGACHI 🔹 Key Structural Elements:
-White Solid Line: Primary Counter-Trendline (CT) connecting multiple swing highs, acting as dynamic resistance over several months.
-White Dotted Lines: Hidden supply lines derived from intermediary highs, often acting as secondary resistance.
-Yellow Lines: Higher timeframe resistance zones (MTF) — offering confluence markers for potential supply zones ahead.
🔹Volume Expansion:
The breakout candle is supported by significant volume (~36M), indicating strong participation. Volume here acts as a confirmation trigger, suggesting institutional interest or broad-based buying.
🔹Structure:
The breakout occurs after an extended consolidation and a series of higher lows.

It will go up if break the upper resistance.This is a basic chart study of securkloud containing resistance and EMAs according to my analysis trend will be up if it breaks the upper support and will do in two to three days. According to the chart as u can see there is a strong resistance at the bottom so you can assure it is safe.


CUP & HANDLE IN CRUDE OILTarget is given
Wait for the re-test at neckline
Your encouragement expects with like and support

TATA STEEL: Rs 440 volts & Falling WedgeLower Highs and Lower Lows since the formation started in Jan 2018.
We had a huge move from Mar this year, wherein we had six months of bullish candles.
At Rs 440, its at an interesting juncture.
Is it bearish as it appears?
or is it some very bullish Chart pattern ?
I would go for a bearish stance.

Buy Accumulation BRNLAccumulated stocks can turn from Support 34 levels Looks buy with Target of 40 in coming weeks.SL 34

BTC Short we just seems have broken trend line
careful not a trade recommendation just for education purpose

ITC swing trade setup April'20Hello friends..
I've certain observation about ITC, and that i think let's share it with you.
As it can be seen on charts, volumes are increasing and price is trying to move in upward direction.
It appears a great swing trade setup in this bear market, comment your views on ITC?
Entry price: 173 to 180
Stop loss : 160
Target price : 216
return/risk ratio : 2.1
Disclaimer:
I am not a registered investment, legal or tax advisor or a broker/dealer. All investment/financial opinions expressed by me are from the personal research and experience. These are intended as educational material.
