INDIANB 1 Month Time Frame 📌 Current Price Context (as of latest trading)
Indian Bank is trading near ₹910–₹920 levels on NSE.
📈 1‑Month Key Resistance Levels (Upside)
These are the levels where price may face selling pressure or reversal if bulls weaken:
R1 — ₹918–₹920 — immediate resistance area just above current trade.
R2 — ₹927–₹930 — secondary resistance zone.
R3 — ₹935–₹940 — further upside resistance zone for continuation moves.
Summary: Immediate upside capped around ~₹918–₹930. Break and close above this band can signal stronger bullish continuation.
📉 1‑Month Key Support Levels (Downside)
Important levels that can act as rebound zones on pullbacks:
S1 — ~₹880–₹885 — first meaningful support near recent swing lows.
S2 — ~₹860–₹865 — secondary support from broader short‑term structure.
S3 — ~₹830–₹835 — major zone where bigger trend buyers may step in.
Summary: Minor supports start ~₹880, stronger support cluster around ~₹860‑₹835.
📊 Pivot / Neutral Reference
Pivot around ~₹907–₹910 — current central reference area.
Price above pivot suggests bullish bias, below could tilt neutral to bearish within the month.
📌 Interpretation For 1‑Month View
Bullish scenario:
Holds above ₹900–₹910 pivot → targeting ₹927–₹940 zone.
Neutral / consolidation:
Trading between ₹880–₹910.
Bearish risk:
Break below ₹860–₹845 could open deeper correction toward ₹830.
Charttechnik

IOC 1 Day time Frame 📊 Current Daily Price (Live / Latest)
Current price: ~₹162.8 – ₹163.8 (NSE) on 29 Jan 2026 during the session.
Today’s range so far: Low ~₹161.7, High ~₹164.6.
📈 Key Daily Levels (Support & Resistance)
📌 Immediate Support
S1: ~₹161.0 – ₹161.8 — today’s low region.
S2: ~₹158.6 – ₹159.0 — short‑term near support zone.
S3: ~₹156 – ₹157 — broader support if prices weaken further.
📌 Pivot / Neutral Zon
Pivot level: around ₹161.8 – ₹162.5 — inside today’s trading range.
📌 Immediate Resistance
R1: ~₹164 – ₹165 — today’s high zone.
R2: ~₹167 – ₹168 — next upside resistance cluster.
R3: ~₹170 – ₹170+] — stronger breakout region above recent swings.
📌 How to Use These Levels Today
Bullish scenario:
A clean break above ₹164–₹165 on strong volume could open the way toward ₹167–₹168+.
Bearish scenario:
A drop below ₹161 and especially below ₹158–₹159 could lead to deeper testing of ₹156–₹155 support.

GRSE 1 Day Time Frame 📈 Live Price & Intraday Range (as of mid‑session)
Current Price (approx): ₹ 2,570 – ₹ 2,573 (NSE) — showing a positive move vs previous close.
Today’s High: ~₹ 2,647.90
Today’s Low: ~₹ 2,550.00
This indicates bullish participation intraday so far.
📌 Intraday Pivot & Support / Resistance Levels
Based on standard pivot calculation using the previous session’s range:
Pivot Point (PP): ~₹ 2,480.8
Resistance Levels:
R1: ~₹ 2,565.9
R2: ~₹ 2,613.1
R3: ~₹ 2,698.2
Support Levels:
S1: ~₹ 2,433.6
S2: ~₹ 2,348.5
S3: ~₹ 2,301.3
📌 Interpretation (Day Trading)
Above pivot (~₹ 2,480): bullish bias for the session.
Key breakout trigger: above R1/R2 levels (~₹ 2,565–2,613).
Downside support zones: around ₹ 2,433 then ₹ 2,348 if sellers step in.
🧠 How Traders Use These Levels Today
✅ Bullish scenario:
If the stock sustains above R1 (~₹ 2,566) and R2 (~₹ 2,613) with volume, buyers could push towards R3 (~₹ 2,698).
❗ If price weakens below S1/S2 (~₹ 2,433 / ₹ 2,348), short‑term downward pressure could emerge.
📍 Pivot (~₹ 2,480) is the key “bull vs bear” session decision level — staying above it generally suggests bulls are in control.
⚠️ Quick Risk Notes
These are intraday technical levels, not investment advice.
Stock prices can move fast; levels won’t guarantee direction.
Combine with volume and real‑time charts for best intraday decisions.

TVSMOTOR 1 Day Time Frame 📊 Current Approx Price Range (recent trading): ~₹3,525 – ₹3,560 area according to community chart insights.
🔑 1‑Day Timeframe — Key Levels
📈 Resistance Levels (Upside Targets)
₹3,550 – ₹3,560: near‑term resistance zone — a breakout above this may indicate bullish continuation.
₹3,600: psychological resistance.
₹3,640 – ₹3,650: stronger resistance above.
📉 Support Levels (Downside)
₹3,510 – ₹3,520: immediate support zone — watches trade reaction here intraday.
₹3,480 – ₹3,490: short‑term support below.
₹3,400 – ₹3,450: deeper support zone if weakness extends.
📌 Intraday & Pivot‑style Levels
Some classic pivot/levels from historical pivot calculations (may be slightly outdated but useful as reference):
R1 ~ ₹3,594, R2 ~ ₹3,622, R3 ~ ₹3,647 (classic pivot levels).
S1 ~ ₹3,541, S2 ~ ₹3,516, S3 ~ ₹3,488 (support pivots).
📊 How to Interpret These Levels
Bullish scenario: Maintaining above ₹3,520‑₹3,530 and breaking above ₹3,560‑₹3,600 could signal continuation higher.
Bearish scenario: Failure to hold ₹3,510 and drop below ₹3,480 may increase downside risk toward ₹3,400‑₹3,450.

DIXON 1 Day Time Frame 📉 Intraday Price Action (Today’s Range)
Day’s Range: ~₹10,274 – ₹10,790
This indicates where the stock has been trading so far today.
📊 Key Intraday Levels for 1‑Day Time Frame
🟢 Support Levels
S1: ~₹10,545 – ₹10,550
S2: ~₹10,359 – ₹10,360
S3: ~₹10,016 – ₹10,020
🔴 Resistance Levels
R1: ~₹11,070 – ₹11,075
R2: ~₹11,410 – ₹11,420
R3: ~₹11,600 – ₹11,605
These pivot‑derived support/resistance levels are typical for intraday reference (classic pivot methodology).
🧠 How to Use These Levels (Intraday)
Bullish bias: A sustained break above R1 ~₹11,070 with volume can open moves toward R2 ~₹11,410.
Bearish bias: If price loses S1 ~₹10,545, next support guards are S2 ~₹10,360 and S3 ~₹10,016.

CUBEXTUB 1 Week Time Frame 📊 Current Price Context
Latest trading range (approx): ₹99–₹103 per share.
📈 Weekly Key Levels (Approximate)
🎯 Resistance Levels
These are areas where upside price movement may slow or reverse:
1. First Resistance: ~₹108–₹109 — near recent pivot resistance.
2. Next Resistance: ~₹113–₹116 — upper weekly resistance zone.
3. Higher Target: ~₹118–₹120+ — longer weekly resistance/extension.
📉 Support Levels
These are areas where price may find buying interest or a bounce:
1. Immediate Support: ~₹101–₹102 — just below recent price and short‑term pivot support.
2. Secondary Support: ~₹98–₹99 — next downside zone.
3. Lower Support: ~₹94–₹95 — deeper support if weakness continues.
📌 Weekly Pivot Reference
Pivot Level (central reference): ~₹106 — roughly the fulcrum of bulls vs. bears this week.
🛠 How to Use These Levels (Weekly Basis)
Bullish scenario:
✅ If the weekly close breaks and holds above ₹108–₹109, next resistance targets of ₹113–₹116 become active.
Bearish scenario:
❌ Failure below ₹101–₹102 could open the path toward ₹98–₹95 support.
Range bias:
🟡 Price may oscillate between ₹101–₹113 in the absence of a decisive trend signal.

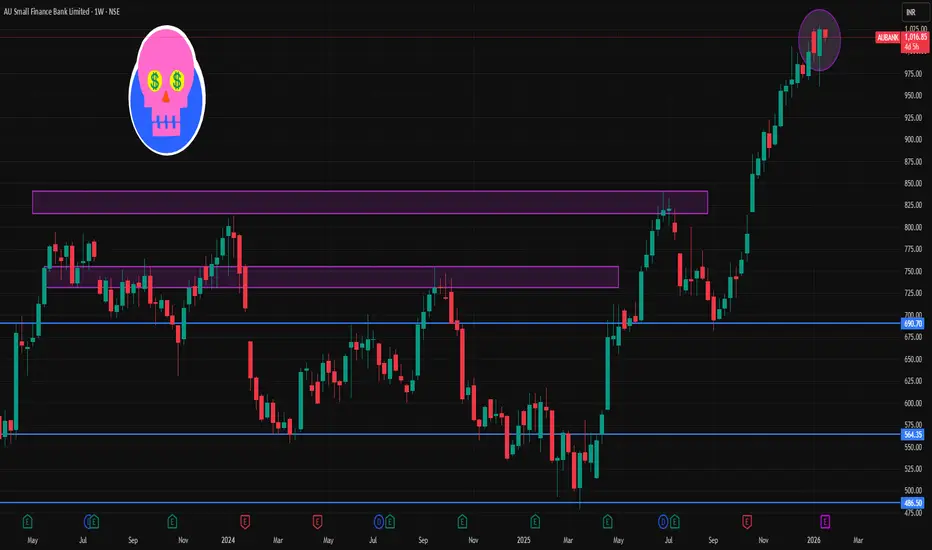
AUBANK 1 Week Time Frame 📌 1‑Week (Current) Key Levels
📍 Current Price Context
The stock has been trading around ₹1,020–₹1,030 area recently on NSE technical feeds.
🧱 Resistance Levels (Upside Targets)
1. Immediate Resistance (R1): ~₹1,050.35 – first barrier on the upside.
2. Major Resistance (R2): ~₹1,075.30 – next meaningful supply zone.
3. Higher Resistance (R3): ~₹1,120.65 – extended bullish breakout territory.
🛡️ Support Levels (Downside Defenses)
1. Immediate Support (S1): ~₹980.05 – crucial for weekly structure.
2. Major Support (S2): ~₹934.70 – deeper correction zone if S1 breaks.
3. Lower Support (S3): ~₹909.75 – extended bearish support for the week.
📊 Weekly Trading Range Projection
Bearish range: ~₹909–₹980
Bullish range: ~₹1,050–₹1,120 +
Price needs to hold above ₹980 weekly close to maintain bullish bias for the week.
📈 Trend & Indicators (Weekly)
Moving averages and oscillators on short‑term charts show neutral to mildly bullish momentum around ₹1,020–₹1,030.
EMA & SMA structures on daily charts support trend continuation if above key moving averages.
🔎 How to Use These Levels This Week
📌 Bullish setup:
Break and sustain above ~₹1,050 → potential run to ~₹1,075 → ₹1,120.
📌 Bearish setup:
Close below ~₹980 support → target ~₹935 → ₹910 on a deeper correction.
📌 Neutral / Swing range:
Between ₹980 and ₹1,050 → sideways action and range trades.
IEX 1 Day Time Frame 📊 Daily Support & Resistance (Short‑Term Levels)
Pivot‑based Daily Levels (from classical pivot calculations):
Resistance 1 (R1): ~₹145.5
Resistance 2 (R2): ~₹147.1
Resistance 3 (R3): ~₹148.2
Pivot Point: ~₹144.5
Support 1 (S1): ~₹142.9
Support 2 (S2): ~₹141.8
Support 3 (S3): ~₹140.2
➡️ These are typical classic pivot levels for the current trading day based on the previous day’s price action.
📈 Modern Technical Levels
From recent pivot analysis on a broader timeframe (but still relevant for daily intraday levels):
Immediate Resistance: ~₹183.7
Next Resistance: ~₹188.5
Higher Resistance: ~₹191.1
Immediate Support: ~₹176.3
Lower Support: ~₹173.7
Further Support: ~₹168.9
⚠️ These levels above are from recent pivot indicators (likely based on slightly longer lookback than 1D but often used by traders together with daily pivots).
✨ How to Use These Levels in 1‑Day Trading
Resistance levels → Possible price rejection or profit‑taking zones on upside rallies.
Support levels → Areas where price might find buying or bounce if selling pressure eases.
Pivot level (~₹144–145) → Balance point useful for gauging daily bias (above → bullish, below → bearish).

RVNL 1 Week Time Frame 📍 Current Status (as of latest market data):
RVNL trading around ₹356–₹360 on NSE/BSE.
📈 Key Levels for this Week (Intraday / Swing)
🔹 Resistance Levels
1. ₹369‑₹373 — Immediate resistance zone where short‑term counter may face selling pressure.
2. ₹377‑₹380 — Higher resistance; a breakout above this could signal short‑term bullish continuation.
🔻 Support Levels
1. ₹362‑₹357 — First support; holds short‑term pullbacks intraday.
2. ₹354‑₹350 — Deeper support — breach of this could see more downside.
3. ₹345‑₹340 — Strong support zone seen from recent chart structures (near 50DMA and consolidation).
📊 What This Means for the Next Week
✅ Bullish scenario
If RVNL closes above ₹373‑₹377 on daily closes, momentum could push towards ₹385‑₹395 in the coming sessions (momentum breakout).
Sustained buying and above‑average volumes would strengthen upside bias.
❌ Bearish scenario
A breakdown below ₹350‑₹345 could lead to a slide to ₹330‑₹325, where longer‑term support zones lie.
Daily closes below ₹350 increases the chances of deeper correction.
⚡ Neutral / Consolidation
If price stays between ₹350–₹373, expect sideways range‑bound trade before a clearer breakout direction.
🧠 Traders’ Focus This Week
✔ Watch daily closing levels above resistance / supports.
✔ Breakouts with higher volumes matter more than intraday spikes.
✔ Stop losses below the strong support zones (e.g., ~₹345) if positioning long.

HCLTECH 1 Month Time Frame 📌 Current Price Snapshot
Approx. live share price: ₹1,640–₹1,650 range on NSE today.
📅 1‑Month Price Context
Over the past month, HCLTECH has generally traded between roughly ₹1,590 – ₹1,680 before recent moves.
📊 Key 1‑Month Technical Levels
🔹 Immediate Support Levels
These are short‑term levels where price may find buying interest:
S1: ~₹1,620
S2: ~₹1,605
S3: ~₹1,592
(support levels from pivot analysis)
Additional support areas if price falls further:
~₹1,580–₹1,570 (psychological region and recent consolidation area)
🔺 Immediate Resistance Levels
These are short‑term levels where price may face selling pressure:
R1: ~₹1,647–₹1,650
R2: ~₹1,660
R3: ~₹1,670–₹1,675
(pivot‑based resistance zones)
If bulls push higher:
~₹1,690–₹1,700 is a possible zone of next resistance before bigger range tests.
📈 Trend & Moving Averages (1‑Month)
20 DMA: ~₹1,659
50 DMA: ~₹1,610
100 DMA: ~₹1,536
200 DMA: ~₹1,564
(latest moving averages reflect neutral‑to‑bullish alignment with price above most SMAs)
📌 How to Use These Levels
Bullish scenario:
If HCLTECH sustains above ₹1,650–₹1,660, the next resistance to watch is ₹1,675–₹1,700, and potential testing of recent broader highs.
Bearish scenario:
If it breaks below ₹1,592–₹1,580, short‑term support weakens and price could drift toward ₹1,550–₹1,570.

RELIANCE 1 Week Time Frame 📌 Current Price Snapshot
RELIANCE.NS is trading around ~₹1,507 – ₹1,510 per share on NSE.
📉 Key Weekly Support Levels
These are levels where price may find buying support on pullbacks:
🟩 Support 1: ~₹1,518 – ₹1,520 — near short‑term pivot support zone for the week.
🟩 Support 2: ~₹1,498 – ₹1,500 — next floor if sellers dominate early week.
🟩 Lower Support: ~₹1,479 – ₹1,480 — broader weekly downside reference.
👉 A weekly close above ₹1,518 would suggest short‑term stabilization before potential bounce.
📈 Key Weekly Resistance Levels
Levels where upside may face selling pressure:
🔴 Resistance 1: ~₹1,555 – ₹1,560 — nearest upside hurdle.
🔴 Resistance 2: ~₹1,600 – ₹1,612 — mid‑week challenge zone (~52‑week area).
🔴 Higher Resistance: ~₹1,630 – ₹1,668 — stretch target if bullish momentum picks up.
👉 A weekly close above ~₹1,612–₹1,620 would signal stronger bullish bias and possible follow‑through to higher levels.
📊 Weekly Price Range Estimate
Expected trading corridor for this week:
📉 Downside: ~₹1,498 – ₹1,500
📈 Upside: ~₹1,630 – ₹1,668
This range represents the key support and resistance boundaries traders may watch for breakouts or breakdowns during the week’s sessions.

LODHA 1 Week Time Frame 📌 Current Price Snapshot
LODHA is trading around ₹1,055 – ₹1,085 on NSE recently.
📊 Weekly Time Frame Levels (Support & Resistance)
🔹 Key Support Levels (Weekly)
Levels where price may find buying interest this week:
Support 1: ~₹1,063 – ₹1,064 (primary weekly support)
Support 2: ~₹1,060 – ₹1,061 (secondary zone)
Support 3: ~₹1,051 – ₹1,055 (deeper weekly support range)
📌 A decisive weekly close below ~₹1,050 – ₹1,055 could signal further downside momentum.
🔹 Key Resistance Levels (Weekly)
Levels where price may run into supply/selling:
Immediate Resistance / Pivot: ~₹1,077 – ₹1,082
Resistance 1: ~₹1,091 – ₹1,092
Resistance 2: ~₹1,097 – ₹1,100
Higher Resistance: ~₹1,110 + if bullish momentum accelerates
📌 Weekly close above ₹1,090 – ₹1,100 strengthens short‑term bullish bias.
📌 Weekly Trading Context
Bullish Scenario
Break & close above ~₹1,090‑₹1,100 on weekly chart → watch for continuation toward higher resistances.
Bearish Scenario
Breakdown and weekly close below ~₹1,063‑₹1,055 → could open path to deeper support near ~₹1,030‑₹1,020 in extended bearish move.

MARUTI 1 Month time Frame 📌 Current Price Context
The stock is trading near ₹16,600–₹16,750 levels (approximate latest market price).
52‑week high: ~₹16,818.
52‑week low: ~₹10,800.
📊 1‑Month Time Frame Key Levels (Support & Resistance)
🔺 Resistance Levels (Upside Targets)
Daily / Short‑Term
• R1: ~₹16,649–₹16,650 – First resistance zone based on pivot.
• R2: ~₹16,757–₹16,760 – Next upside likely supply area.
• R3: ~₹16,832–₹16,833 – Higher resistance near recent swing highs/upper pivot.
📈 Key level to watch: Above ₹16,830 could signal breakout continuation.
🔻 Support Levels (Downside Floors)
Daily / Short‑Term
• S1: ~₹16,466–₹16,470 – Immediate support zone.
• S2: ~₹16,390–₹16,420 – Secondary support cluster if first breaks.
• S3: ~₹16,320–₹16,330 – Lower pivot support for deeper pullbacks.
📉 Key breakdown area: Below ~₹16,320 may open deeper retracement into lower 1‑month range.
📊 Pivot Point (Central Reference)
Pivot (Daily/Short‑Term): ~₹16,574–₹16,576 – This mid‑point acts as neutral zone around current price action.
📌 1‑Month Outlook (What to Watch)
📊 Bullish Scenario
✔ Above ₹16,750–₹16,830 → Next focus towards ₹16,900+ range.
✔ Strong rejection off back‑to‑back support levels indicates buyers stepping in.
📉 Bearish Scenario
✔ Break & close below ₹16,400–₹16,320 → sellers gain edge, could test lower support near ₹16,200–₹16,000.

JAINREC 1 Day Time Frame 📌 Latest price context:
• The stock has been trading around ₹400–₹410 in recent sessions (range today ~396.5–409) with latest close near ₹401.30.
📊 Daily Technical Levels (Approximations)
🔵 Resistance Levels
R1: ~₹418–₹420 — 1st key upside hurdle — pay attention for breakout.
R2: ~₹425–₹430 — Secondary resistance at previous reaction highs.
R3: ~₹435–₹440+ — Strong supply zone from past tops/52‑wk range.
🔴 Support Levels
S1: ~₹400–₹401 — Immediate floor pivot area around current price.
S2: ~₹390–₹392 — Near short‑term support from recent pullbacks.
S3: ~₹383–₹385 — Deeper support zone below recent correction lows.
S4: ~₹370–₹375 — Major support if price loses the current range.
📍 Daily Pivot (approx)
• Pivot ~ ₹400–₹402 — Price around this level gives neutral bias until breakout.

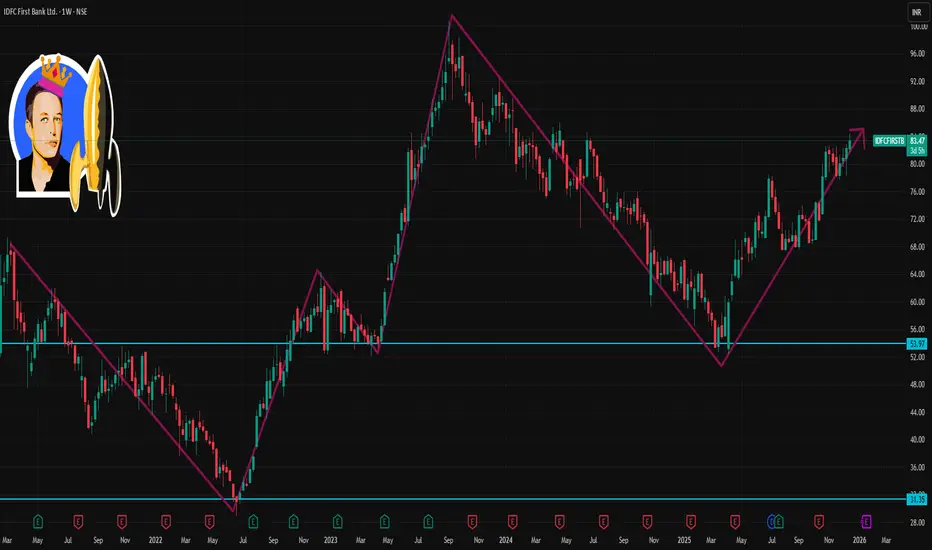
IDFCFIRSTB 1 Week Time Frame 📊 Weekly Support & Resistance Levels
Weekly Resistance Levels
R1: ~₹83.96 — immediate weekly resistance (key breakout level)
R2: ~₹85.63 — next major resistance
R3: ~₹88.44 — extended upside if trend is strong
Weekly Support Levels
S1: ~₹79.48 — first strong weekly support
S2: ~₹76.67 — secondary support zone
S3: ~₹75.00 — deeper support if weakness accelerates
Weekly Pivot (approx central point)
Around ₹81.15–₹81.72 based on weekly pivot analysis
📌 Key Reference Price Context
The stock is currently trading around ₹83‑₹84 on the NSE (Dec 16, 2025).
52‑week range is roughly ₹52.46 low to ~₹84.4 high; price is near its yearly peak.
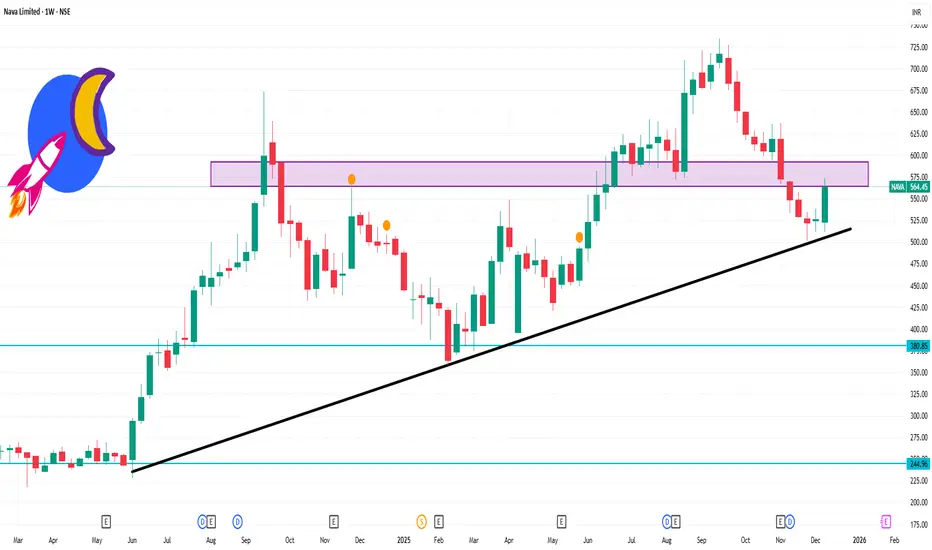
NAVA 1 Week Time Frame 📌 Current Price Snapshot
Last traded / recent price: ~₹560–₹567 on NSE/BSE (varies by source; live changes intraday)
52‑week range: ₹356 (low) to ₹735 (high)
📊 Weekly Timeframe Levels (Support & Resistance)
For a 1‑week (weekly candle) view you want levels that matter over the entire trading week — not just intraday:
🔹 Weekly Pivot & Key Levels (from pivot and technical sources)
Immediate Pivot (weekly): ~₹552–₹563
Weekly Resistance Zones:
R1: ~₹566–₹570 (near recent swing highs)
R2: ~₹587–₹590 zone
R3: ~₹600+ if momentum persists
Weekly Support Zones:
S1: ~₹531–₹535 (first strong support)
S2: ~₹517–₹520 (secondary weekly support)
S3: ~₹496–₹500 (deeper support if selling extends)
Summary of weekly levels:
📈 Bullish break‑above: ₹570–₹590
🧊 Neutral pivot zone: ₹552–₹565
🛑 Bearish below: ₹531 → ₹500
KALYANKJIL 1 Week Time Frame 📉 1‑Week Price Movement & Technical Snapshot
The share price has fallen by ~4–5% over the last week.
Current quote (around 9–10 Dec 2025) is in the ₹468–473 range.
From its 52‑week high of ₹794.60, the stock is down more than 40%.
Technical‑analysis commentary suggests “bearish momentum” and “mixed signals” — indicating consolidation or possible further downside in the short term.
📊 Fundamentals & Market Context
Recent financials show some strength: the company reported good revenue growth and profitability in recent quarters.
On the valuation side: the stock quotes a high P/E (price-to-earnings) and P/B (price-to-book) compared with some peers — implying expectations are already priced in.
Some analysts as per recent reports have highlighted structural headwinds (like weaker jewellery demand, gold‑price volatility, cautious consumer spending), which may weigh on near‑term performance.

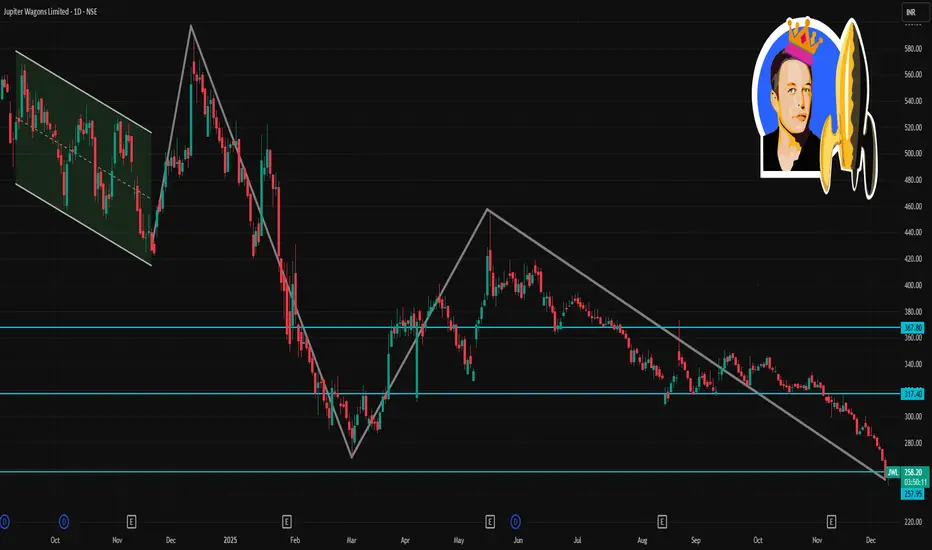
JWL 1 Day Time Frame 📌 Key recent price and context
Recent quoted share price of JWL is ~ ₹254–267 (on NSE/BSE, depending on source/time).
The 52‑week high / low range for JWL has been roughly ₹588 (high) and ₹266 (low).
🔧 Key 1‑Day Support / Resistance / Pivot Levels
Based on most recent public pivot‑point / support‑resistance breakdowns:
Level Approximate Price / Range
Immediate Support (S1) ~ ₹263.6
Lower Support (S2 / S3) ~ ₹260.2 and ~ ₹254.3
Pivot / Intra‑day Reference ~ ₹269.5
First Resistance (R1) ~ ₹272.9
Second Resistance (R2) ~ ₹278.9
Third / Upper Resistance (R3) ~ ₹282.3
Interpretation (for 1‑day horizon):
On a decline, watch ₹263.5–₹260 as first support zone — a drop below ₹254–₹255 could open up downside risk.
On a bounce/recovery, ₹272–273 may act as first resistance zone; ₹278–282 as the key target or supply zone.
If price trades near the pivot (~₹269), price action and volume around that will decide intraday bias (whether sellers or buyers dominate).
ZYDUSWELL 1 Day Time Frame 🔎 Current snapshot
Recent quoted share‑price: ~ ₹419.7 as on close of market.
52‑week high / low ~ ₹530.9 / ₹298.6.
✅ What this implies (for today / next trading session)
If price moves upward and clears ₹456–₹463, next target zone could be ₹470–₹475 — and if momentum persists, maybe up to ₹485–₹487.
If price falls, keep an eye on ₹441–₹453 as first support; a break below ₹420–₹422 could open risk of deeper slide.
Given current price (~₹420), the stock is nearer to support side — so a modest bounce is possible if broader market or sector sentiment improves.
⚠️ What to watch out for
Daily technicals work best with volume confirmation — weak volume may render levels less reliable.
Mid‑term factors (earnings, fundamentals, market news) can overrule technical‑only moves.
Given the stock’s 52‑week high/low spread, volatility remains significant — so manage risk (stop‑loss, position sizing) carefully.

HEROMOTOCO 1 Day View📈 Current Technical Snapshot
As of the most recent close, Hero MotoCorp is trading around ₹ 6,174–₹ 6,175.
Medium‑ to long‑term moving averages (20‑day, 50‑day, 100‑day, 200‑day) are all below current price — indicating a bullish trend on daily timeframe.
Momentum indicators (e.g. MACD, RSI, CCI) remain positive in recent technical overlays — reflecting continued bullish bias.
🧭 What this means (short‑term bias)
As long as the stock remains above ~ ₹ 6,098–6,100, positive bias likely remains intact — supports may hold if there’s a pullback.
A break above ₹ 6,200–6,205 could open near‑term upside toward ₹ 6,250–6,300+ (near recent highs / psychological resistance).
On downside — if price breaks convincingly below ~ ₹ 6,000, next real support comes only near ₹ 5,995–6,000.
⚠️ What to Watch / Limitations
Technical levels are zones, not precise lines — price may overshoot briefly before reaction.
Market‑wide factors or news (macroeconomic, demand for two‑wheelers, policy, daily volume) can override technicals.
These levels are short‑term / 1‑day to few‑day oriented. For swing or long‑term holdings, combine with weekly / monthly chart analysis.

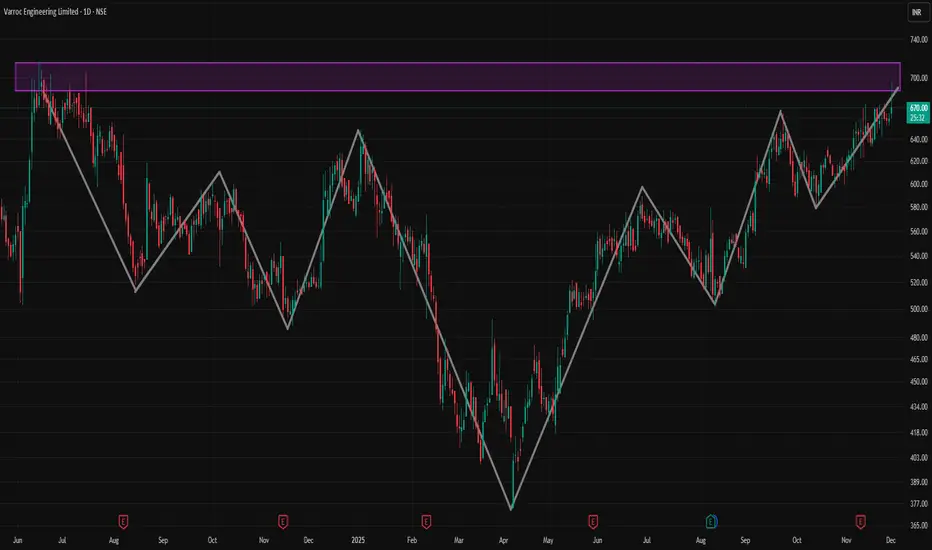
VARROC 1 Day Time Frame 📈 Where VARROC stands now
Recent quotes put VARROC around ₹ 659 – ₹ 692 per share.
On a 1‑day / very short‑term basis, the stock recently showed a jump of ~4‑5%.
The 52‑week range for the stock has been roughly ₹ 374 – ₹ 674–689 — so current levels are near the upper end of that band.
⚠️ What to keep in mind / Risks in 1‑day frame
The stock remains relatively volatile — intraday swings (highs/lows) have been wide in recent sessions.
Short‑term moves may be driven more by news/event‑driven sentiment (like EV contract wins) than by underlying long‑term fundamentals; such moves can reverse quickly if news is not sustained.
✅ My take (for a 1‑day horizon)
If you are looking at a 1‑day trade: VARROC could still have some upside — especially if momentum continues, given recent positive news + technical breakout. But treat it as a high‑risk, high‑reward speculative trade.
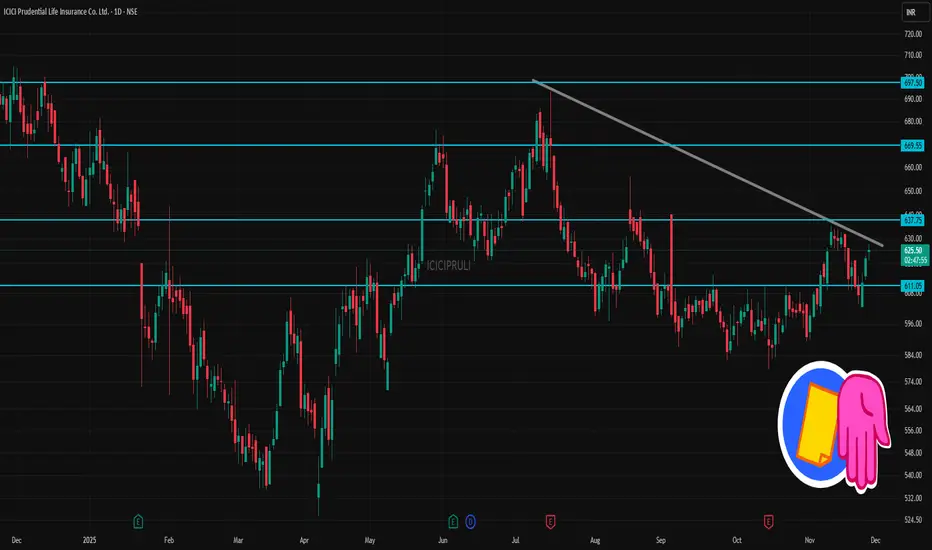
ICICIPRULI 1 Day Time Frame 📌 Latest Price & Context
Recent traded price: ~ ₹ 625–626.
52‑week range: Low ~ ₹525.80 — High ~ ₹704.70.
📈 What It Suggests (For 1‑Day / Short‑Term View)
As long as price remains above ~₹ 623–625, there is a short‑term bullish bias — next target could be ~₹ 630–635.
Dip toward ~₹ 615–620 could offer a buy‑on‑dip type entry (for traders), if volume and overall market sentiment stay supportive.
If price breaks below ~₹ 605–600, it may head toward the lower support zone — then caution/adapt strategy.
LICHSGFIN 1 Day Time Frame 📍 Key Current Levels
The stock is trading around ₹ 550 (recent quotes ~₹ 548-550) on the NSE.
Pivot & major levels (from one source) on the daily:
Classic pivot: ~₹ 550.32
Support levels: ≈ ₹ 547.39 (S1), ≈ ₹ 542.02 (S2)
Resistance levels: ≈ ₹ 555.69 (R1), ≈ ₹ 558.62 (R2)
Longer-term moving averages: 50-day MA ≈ ₹ 559.47; 200-day MA ≈ ₹ 570.32 — both above current price, indicating downward pressure.
RSI and oscillator reading: RSI around ~41 (neutral/leaning oversold) per one data point.
🔍 Interpretation & What to Watch
With price below major moving averages (50 & 200 day), the bias remains bearish on the daily chart.
The pivot around ₹ 550 is a key level: holding above may help stabilise; falling below could signal more weakness.
Important support to watch: ~₹ 547 and then ~₹ 542. If these break, risk of further downside.
Key resistance: ~₹ 555-558 zone. A break up through that with volume could offer short-term upside.
The RSI being relatively low (though not deeply oversold) suggests potential for a rebound if positive trigger arises, but trend is not yet positive.
Because the broader trend remains negative, any bounce should be treated cautiously unless backed by strong volume and a clear breakout above that resistance zone.
