Gold (XAU/USD) 3H Chart Analysis – Bullish Setup Toward $3,500 TCurrent Price: $3,254.26
EMA 70: $3,285.50 (Price is below EMA – cautious zone)
Bias: Bullish 📈 (if demand zone holds)
Key Zones:
🟦 Demand Zone: $3,200 – $3,260
✅ Strong buy interest expected here
⚠️ Good place to look for entry signals
🟥 Resistance Zone: $3,223.60 – $3,323.84
🔄 Price is currently testing this zone
A breakout here can lead to bullish momentum
🎯 Target Point: $3,500 – $3,529 💰
📌 Defined as "Target Point 3500"
High potential for profit-taking here
⛔ Stop Loss: $3,161.32
🚫 Placed below demand zone for risk control
❗ Important to exit if price drops here
Trade Idea 💡
📥 Buy Entry: Near or above $3,223.60
✅ Hold as long as price respects demand zone
🎯 Target: $3,500
⛔ Stop Loss: $3,161.32
⚖️ Risk:Reward ratio looks favorable!
Quick Summary:
🟢 Bullish Setup
💪 Demand zone is strong
📈 Breakout above resistance may fuel a rally
⏳ Wait for confirmation before entry!
Chatpatterns

S&P 500 Bearish Reversal Setup: Short Entry Below Key ResistanceEntry Point: Around 5,678.79
Stop Loss: Around 5,833.61 (above recent resistance zone)
Target Point: Around 4,831.37 (indicating a bearish target)
2. Technical Patterns:
The price hit a resistance zone (highlighted in purple) and reversed—this is often a bearish signal.
The trendline break (marked with the orange dot and blue arrow down) suggests a potential trend reversal.
The moving averages (likely 50 EMA and 200 EMA) indicate the price is still above the support zone but weakening.
3. Risk/Reward Ratio:
Risk (Stop Loss – Entry): ~154.82 points
Reward (Entry – Target): ~847.42 points
Risk/Reward Ratio: Approximately 1:5.5, which is favorable for shorting.
4. Trade Sentiment:
Bearish bias based on the breakdown from the resistance zone and confirmation from chart patterns.
If the price fails to hold above 5,682.87, a short trade may be validated with the target at 4,831.37.

EUR/USD Long Trade Setup – Buy Zone at 1.12757 with Targets at 11. Entry Point:
1.12757 is marked as the proposed buy entry zone, situated at the bottom of a consolidation range.
The price is currently just above this level, suggesting a potential reversal setup is forming.
2. Stop Loss:
Placed at 1.12413, which is below the support zone. This protects the position if the price breaks down further.
3. Target Points:
EA Target Point One: 1.14207 – this is the first take-profit target, aligned with a previous resistance zone.
EA Target Point: 1.1582 – this is the extended target, aligned with a stronger resistance area from a prior high.
4. Risk-to-Reward Consideration:
Risk: From 1.12757 to 1.12413 (approx. 34 pips).
Reward 1: Up to 1.14207 (approx. 145 pips).
Reward 2: Up to 1.1582 (approx. 306 pips).
This gives an excellent risk-to-reward ratio (>4:1 to the first target, >9:1 to the second target).
5. Market Context:
Price is trading below both the 50-period (blue) and 20-period (red) moving averages, indicating bearish short-term momentum.
However, this strategy anticipates a bounce off support, possibly a reversal or correction to the upside.

GBP/USD Short Trade Setup: Reversal from 1.34370 with Target at Entry Point:
Marked at 1.34370, where the analyst anticipates a reversal or price rejection.
Stop Loss:
Positioned above at 1.34975, covering a 2.62% risk margin. This is a protective level in case the price moves against the trade.
Target (Take Profit):
Set at 1.31015, just above a strong support zone around 1.30818. This is where the analyst expects the price to eventually fall.
Resistance Point:
Noted around 1.33007 – 1.32859, acting as an intermediate level of interest and possible price reaction zone.

(BTC/USD) 1H Trade Setup – Key Entry, Stop Loss & Dual TargetEntry Point: 95,431
Stop Loss: 95,264
Target Points:
Upside (Target 1): 100,674 (Potential gain: +5.36%)
Downside (Target 2): 86,614 (Potential loss: -7.57%)
Trade Setup:
Risk-Reward Ratio:
Approx. 1:0.7 (Not ideal; the reward is smaller than the potential loss)
Support Zones:
Highlighted in purple beneath the entry zone — this indicates a historically strong support area.
Resistance Zones:
The upper purple zone marks the next significant resistance around 100,000–100,795.
Technical Indicators:
50 EMA (Blue Line): Indicates mid-term trend support, currently holding price action.
Price Action: BTC appears to be retracing toward support after a bullish rally.
Interpretation:
The setup implies a long (buy) position with a very tight stop loss.
The price is nearing a support zone, and if it holds, there's potential for an upward move to the target at 100,674.
However, if price breaks below 95,264, a sharp drop to 86,614 is anticipated.

XAU/USD) Bullish Trade Setup – Targeting $3,506.52 with Entry atEntry Point: $3,221.19
Stop Loss: $3,169.80
Resistance Zone: Around $3,277.98 to $3,280.64
Target (TP) Point: $3,506.52 (Approx. 9.05% upside)
📊 Technical Indicators and Markings:
Moving Averages:
Likely a 50-period (blue) and 200-period (red) moving average.
Price is currently below both MAs, signaling a short-term downtrend.
Support & Resistance Zones:
Strong support around $3,207.67–$3,221.19 (entry area).
Resistance at $3,244.25–$3,280.64.
Stop-loss is strategically placed below support to limit downside risk.
Target Area:
Projected upside target is $3,506.52, with a potential 9.05% gain from the entry.
This is marked as the EA (Expert Advisor) Target Point, possibly suggesting this is a strategy from an automated trading system.
Orange Circles:
Likely indicate swing highs and lows, used to identify trend patterns and potential reversal points.
📈 Trading Idea Summary:
Bullish Setup: Buying at support, aiming for breakout above resistance to reach target.
Risk-Reward Ratio: Favorable, assuming price holds above $3,207.
Watch for Confirmation: Price needs to break above resistance around $3,280 for momentum continuation.

Gold (XAU/USD) Intraday Buy Setup with High Reward-to-Risk Ratio1. Entry Point Zone: Around 3,271.79 USD
This is identified as a potential buy entry area, marked in purple.
2. Stop Loss: Below the entry point at 3,257.71 USD
Risk management level in case the trade moves against the setup.
3. Target Point One: Between 3,313.75 and 3,317.07 USD
A short-term take-profit level, likely based on previous resistance.
4. Final Target (EA Target Point): Around 3,373.04 USD
A more ambitious take-profit, possibly based on a major resistance level or Fibonacci extension.
5. Trade Range:
Risk: 3,271.79 - 3,257.71 = 14.08 USD
Reward to First Target: ~42 USD

BTC/USD) Short Setup: Triple Top Formation Targeting 86,023 USD You’re seeing a potential Head and Shoulders structure (or at least a triple top) — with the orange circles marking failure to break higher around $95K.
The neckline (support) is slightly diagonal down toward the $94K region.
A breakdown is anticipated once the neckline fails.
2. EMAs Interaction:
30 EMA (red) is currently flattening, showing weakening momentum.
200 EMA (blue) is far below, around 88,181 USD, acting as a major support zone — and it aligns with the projected EA TARGET POINT.
EMA compression usually precedes a strong move.
3. Zones and Key Price Levels:
Entry Point: ~95,145.60 USD → high-probability short sell.
Stop Loss: ~96,000–96,957 USD → protects against unexpected breakout.
Target: ~86,023 USD → aligns with past accumulation zone and EMA200.
4. Risk/Reward Ratio:
Potential reward is about 9–10%.
Risk (from entry to stop) is about 1–2%.
Excellent Risk/Reward (>4:1).
5. Momentum and Volume (implied, not shown):
Given the topping pattern and lack of higher highs, buying momentum is weakening.
If volume increases on a breakdown, confirmation will be strong.
📊 Strategic Points:
Aspect Analysis
Trend Still bullish, but topping signs visible
EMA Behavior Short-term EMA flattening, long-term EMA rising slowly
Pattern Formed Triple Top / Head and Shoulders
Risk/Reward Very good (>4:1)
Recommendation Short bias around entry level, with strict stop-loss
⚡ Quick Trading Plan:
Entry: Short at ~$95,145
Stop Loss: ~$96,000–96,957
Target: ~$86,023

EUR/USD Bullish Trade Setup – Targeting 1.18089 with Strong RiskEntry Point: 1.13860
Stop Loss Zone: 1.13642 to 1.12578
Resistance Point: 1.14320
Target (TP) Point: 1.18089
🔍 Observations
Support Zone: Marked in purple near the entry and stop-loss area, suggesting a strong demand zone.
Resistance Zone: Around 1.14320, indicating a potential breakout level.
Trend: Short-term uptrend after a consolidation range.
Risk/Reward Ratio: Quite favorable, targeting a move of approximately 470+ pips (4.20% gain) from entry to target.
📊 Technical Indicators
Moving Averages:
Red (likely 20 EMA): Price recently crossed above, showing bullish momentum.
Blue (likely 50 or 200 EMA): Serving as dynamic support.
Price Action: Formation suggests a potential breakout from resistance toward the 1.18 target.
🧠 Conclusion
This is a long (buy) setup expecting a bullish breakout:
Buy entry above the support zone.
Stop-loss placed below major support (1.12578).
Target set significantly higher, aligning with prior structure or resistance at 1.18089

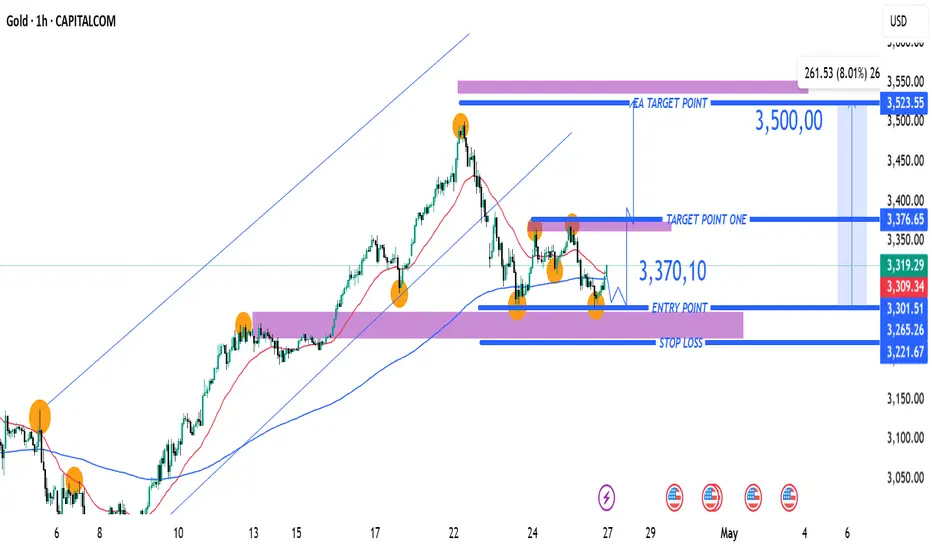
(XAU/USD) 1H Chart: Long Setup Targeting 3,500 with Key SupportEntry Point: Suggested near 3,301.51 USD (marked with the purple support zone).
Stop Loss Zone: Below 3,266.87 to 3,221.67 USD (marked in blue and purple). This is where you limit your loss if the trade goes wrong.
First Target (Target Point One): 3,376.65 USD.
Final Target (EA Target Point): 3,523.55 USD (~8.26% potential gain from entry).
Main Setup Idea:
The price is consolidating around the support zone.
There's a plan to buy (go long) at the purple zone (Entry Point) and aim for the two target points
ETH/USD Breakout Trading Setup – Long Entry with 16% Target PoteEntry Point: $1,593.08
Target Point: $1,807.83
Stop Loss: $1,472.68
Risk/Reward Ratio: Roughly 2.1:1
Indicators Used:
EMA 30 (Red Line) at $1,593.08 (near entry point)
EMA 200 (Blue Line) at $1,605.09
Analysis:
1. Consolidation Phase:
ETH is in a sideways range after a prior downtrend, consolidating within the purple support zone.
This zone (~$1,555 to ~$1,593) has been tested multiple times, suggesting a strong base.
2. Bullish Breakout Anticipation:
The setup expects a breakout above consolidation, targeting a 16.11% move to $1,807.83.
A breakout strategy is being applied, assuming ETH will reverse from this consolidation area a

Bitcoin Bearish Reversal Setup: Rising Wedge Breakdown Targeting1. Entry Point:
Marked around $86,853, this is where a potential short (sell) trade might have been initiated.
2. Stop Loss:
Placed above $88,783, protecting the trade in case the market goes against the position.
3. Target Point (Take Profit):
Aiming down toward $74,443.76, suggesting a large bearish move is anticipated.
4. EMA Indicators:
30 EMA (Red Line) at ~$84,271: Indicates short-term trend.
200 EMA (Blue Line) at ~$83,496: Indicates long-term trend.
Price is currently trading above the 200 EMA but slightly below the 30 EMA, showing mixed short-term momentum.

USD/JPY Bullish Reversal Setup – Long Entry at 141.964 Targeting ahemdsaeed25: USD/JPY Long Setup – Eyeing 150.537 Target"
"Potential Bullish Reversal on USD/JPY"
"Swing Trade Alert: USD/JPY Long from 141.964"
"USD/JPY Breakout Play – Buy Zone Identified"
Let me know your tone preference (technical, casual, professional, etc.) and I can tailor the title further.
ahemdsaeed25: This chart is for the USD/JPY (U.S. Dollar / Japanese Yen) pair on the 1-hour timeframe, and it's displaying a bullish setup with a clear trade idea. Here's a breakdown of the analysis:
Key Components:
Current Price: Around 142.574.
Entry Point: 141.964
Stop Loss: 140.547
Take Profit / Target Point: 150.537
Reward-to-Risk Ratio: Favorable (approximately 5.94% upside, large potential move).
Indicators:
EMA 50 (Red Line): 142.798 — acting as near-term dynamic resistance.
EMA 200 (Blue Line): 144.699 — major resistance and a trend filter (downward trend visible).
Zone Analysis:
Support Zone (Purple Box near 141.964 - 140.547): This is the accumulation/buy zone.

Gold (XAUUSD) Trade Setup: Bullish Breakout Toward $3,637 TargeCurrent Price: $3,309.18
EMA 30 (Red Line): $3,265.00
EMA 200 (Blue Line): $3,163.35
Trend Direction: Strong uptrend (price above both EMAs)
Timeframe: 1-hour (short-term analysis)
📍 Key Levels
Entry Point: Around $3,266.63 (just above EMA 30)
Stop Loss: Around $3,265.00
Target (EA Target Point): $3,637.23
Potential Profit: +$365.01 or +11.16%
🔍 Technical Patterns & Zones
Rising Channel: Price is moving within a rising wedge or channel, indicating bullish momentum but with narrowing range — a potential reversal signal if broken.
Support Zone: Highlighted purple box around the entry point; likely a demand zone.
Resistance Zone: $3,637.23 area marked as the EA Target Point — previous resistance or Fibonacci extension level.
✅ Bullish Signals
Price is consistently making higher highs and higher lows.
EMAs are aligned in a bullish formation (short EMA above long EMA).
Clear breakout above consolidation range recently.
Trade setup shows favorable risk-to-reward ratio.
⚠️ Risks / Caution
Rising wedge can sometimes break down — watch for volume drop or divergence.
Potential pullback to the entry zone is expected (indicated by the arrow).
News Events: Symbols below the chart indicate upcoming USD economic data, which could bring volatility.
📈 Strategy Summary
Buy on pullback to $3,266.63 with tight stop at $3,265.00.
Target: $3,637.23 — potential 11% gain.
Risk: Minimal if stop is respected, tight stop-loss.

Silver (XAG/USD) Bullish Trade Setup: Entry, Target & Stop-Loss Entry Point: ~32.35619
Take Profit (Target Point): 33.31252
Stop Loss: 31.87803
EMA 200 (Blue): 31.65932 – indicating long-term trend support.
EMA 30 (Red): 32.28304 – indicating short-term trend.
Current Price: 32.38220
The price is above both EMAs, which is typically bullish.
---
Analysis
1. Bullish Bias:
Price has broken and is holding above the entry zone.
Both EMAs are aligned in a bullish configuration (short-term EMA above long-term EMA).
The market structure shows higher lows and sideways consolidation, suggesting potential for a breakout.
2. Risk-Reward Ratio:
Risk (Entry to Stop Loss)

GOLD (XAUUSD) 15-Min Chart – Bearish Reversal Setup with Key EntPrice: $3,232.02 (at time of chart)
Trend: Price is consolidating near a resistance area after an upward move, with potential for a reversal.
🔍 Key Technical Levels
📈 Entry Point: $3,241.88
(Marked for a potential short entry)
🔻 EA Target Point (Take Profit): $3,187.70
This is the target for the short position; aligns with a strong previous demand zone and near the 200 EMA.
⛔ Stop Loss Zone: Above $3,243.48
Purple zone indicates the invalidation area for the short trade.
📉 Resistance Point: $3,229.87
(Red line, also the 30 EMA) – Important level where price is currently hovering.
🔵 Confirm Target Points: $3,223.04 & $3,218.25
Zones to watch for confirmation of downward momentum.
📘 EMA (30): $3,229.87
Acts as short-term dynamic resistance.
📘 EMA (200): $3,182.40
Acts as major support and long-term trend indicator. Also very close to the target area.
💡 Trade Idea Summary
Strategy: Short (Sell) from the resistance/entry point around $3,241.88.
Target: $3,187.70
Stop Loss: Above $3,243.48
Risk-Reward Ratio: Solid (approx. 1:2+ based on visual range)
🔎 Additional Notes
Price is testing resistance after forming a potential double top or lower high.
A breakdown below $3,223 could confirm bearish continuation.
Watch for confirmation candles on 15m or 1h before entering

EMA 30 (Red Line): Currently at 99.700 — tracks short-term trendEMA 30 (Red Line): Currently at 99.700 — tracks short-term trend, and price is hovering near this level.
EMA 200 (Blue Line): At 100.935 — indicates long-term trend, acting as dynamic resistance above.
📈 Trade Setup
✅ Entry Point:
Price: 99.699
Rationale: This level has been tested multiple times, forming a support zone. A bounce here signals a potential long entry.
🎯 Target Point (Take Profit):
Price: 102.738
Distance: ~3.04 points or 3.43% potential move upward.
Note: Marked as EA TARGET POINT, which suggests a calculated area possibly based on previous resistance or algorithmic strategy.
🛑 Stop Loss:
Price: 98.624
Reasoning: Just below the defined support zone (highlighted purple area), ensuring protection against downside breakouts.
📊 Risk-to-Reward Ratio
Entry: 99.699
Target: 102.738 → Gain of ~3.04
Stop: 98.624 → Risk of ~1.08
R/R Ratio: ~2.8:1 — favorable setup
📌 Overall Sentiment
This chart indicates a bullish reversal setup from a strong support zone, possibly targeting a mean reversion or trend reversal toward the 200 EMA and beyond.
However, keep in mind:
The price is currently below both EMAs, so the trend is still bearish.
The trade is counter-trend, relying on support holding and momentum shifting.

GBP/USD Short Setup – Rejection from Resistance Zone with High REMA 30 (red line)
EMA 200 (blue line)
---
Key Levels:
Entry Point: 1.31324
Stop Loss: 1.32303
Target (TP): 1.28102
---
Analysis:
1. Trend Context:
The market shows a recent bullish move approaching a key resistance zone (highlighted in purple).
The price is now reacting to that resistance zone and potentially forming a reversal.
2. EMA Insight:
Price is currently trading slightly above the EMA 200 and EMA 30, indicating short-term bullish momentum.
However, the suggested trade setup appears to be short (sell), anticipating a reversal from

GBP/USD Bearish Reversal Setup – Targeting 1.27451 (April 2025)"GBP/USD Sell Setup – Bearish Reversal Opportunity
⚙️ Trade Setup Summary
Entry Point (Sell Zone): Around 1.31668
Stop Loss: 1.32638
Take Profit (EA Target Point): 1.27451
Risk-Reward Ratio (R:R):
Risk: 1.32638 – 1.31668 = ~97 pips
Reward: 1.31668 – 1.27451 = ~422 pips
R:R ≈ 1:4.35 – very favorable
📊 Technical Analysis
Supply Zone (Resistance):
The purple zone near 1.31668–1.32638 is likely a key supply area where price previously reversed.
A small rejection wick is already forming near the entry, suggesting potential exhaustion.
Bearish Setup Expectation:
Anticipated reversal at resistance.
The plan likely involves waiting for a bearish confirmation (e.g., pin bar, engulfing candle) in the zone before shorting.
Moving Averages:
Price is above both the red (short-term) and blue (longer-term) moving averages, indicating current bullish momentum.
However, the trade anticipates a trend reversal or deeper retracement.
Target Zone:
The EA Target Point at 1.27451 is positioned at a prior demand/support zone — a logical level for take-profit.
🧠 Trade Thesis
This is a counter-trend trade aiming to catch a reversal from a resistance zone.
Strong confluence from price action and resistance makes this setup compelling, if proper confirmation appears.
⚠️ Risk Considerations
Bullish momentum is still strong, so aggressive entry without confirmation can be risky.
Monitor closely for rejection signs or bearish divergence before entry.
SL above 1.32638 provides safety buffer against stop hunts or spikes.
✅ Potential Title Suggestions
"GBP/USD Bearish Setup – Reversal from Resistance Targeting 1.2745"
"GBP/USD Short Trade Plan – Sell at 1.31668, Target 1.27451"
"GBP/USD Sell Opportunity – High R:R Bearish Setup

EUR/USD Long Opportunity – Entry at Support ZoneEntry Zone (Buy Area): Between 1.12729 and 1.13101
Stop Loss: 1.12100
Target (TP1): 1.16950
Risk-Reward Ratio (R:R):
Risk: 1.13101 - 1.12100 = 101 pips
Reward: 1.16950 - 1.13101 = ~385 pips
R:R ≈ 1:3.8 — excellent risk-to-reward
📈 Technical Observations
Bullish Momentum: Strong bullish candles leading into the setup suggest buyers are currently in control.
Support Zone (Entry Area):
The purple zone has acted as a previous resistance, now turned support.
Price may retest this zone before moving higher (as indicated by the blue path on the chart).
Moving Averages:
Red (likely 50 EMA) and blue (possibly 200 EMA) are showing a bullish crossover.
Price is above both MAs, reinforcing a bullish trend.
Projected Move:
The setup anticipates a pullback before a continuation to the upside toward 1.16950.
🧠 Trade Idea Summary
This is a buy-the-dip strategy within a bullish trend.
Entering on the pullback allows for:
Tighter stop loss
Better entry price
Higher R:R ratio
⚠️ Risk Considerations
A break below 1.12100 would invalidate the setup.
Monitor for bearish reversal patterns or news around the EUR/USD that might shift sentiment.

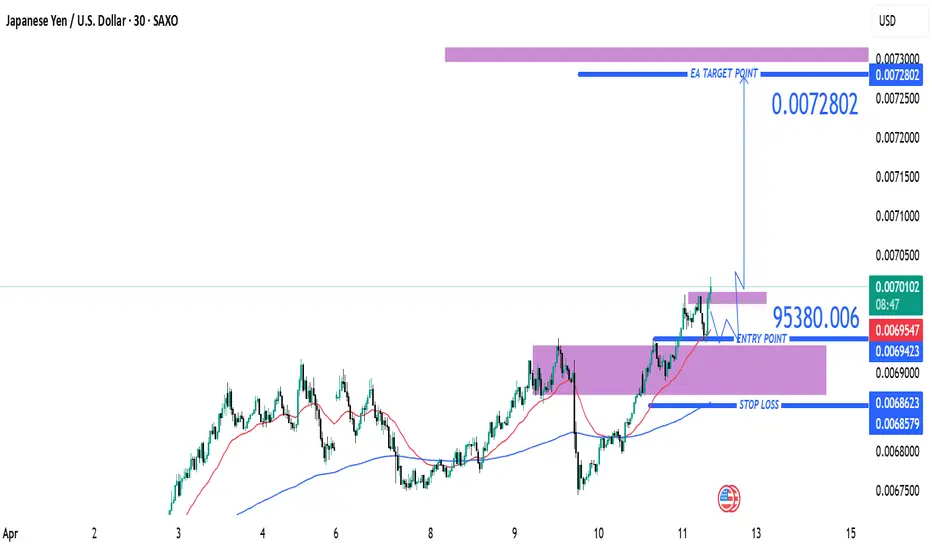
JPY/USD Bullish Breakout – Targeting 0.0072802 After Retest (AprEntry Point: ~0.0069539
Take Profit (TP): 0.0072802
Stop Loss (SL): 0.0068579
Risk/Reward Ratio:
Risk: ~0.000096
Reward: ~0.000326
Approx. R/R = 1:3.4 → Excellent reward-to-risk
🧠 Strategy Insight
Trade Type: Long (Buy)
This is a bullish continuation setup aiming for higher highs after a breakout from a consolidation range.
Price Action:
Strong bullish trend visible since early April.
Price consolidated in a purple zone (likely a demand/support zone), then broke out and is now retesting that zone — classic breakout and retest pattern.
Indicators:
Two moving averages (likely 50 EMA in red and 200 EMA in blue) are in bullish alignment:
Price is above both EMAs.
50 EMA is above the 200 EMA, confirming bullish momentum.
Support & Resistance Zones:
Entry near previous resistance turned support — solid structure for long positioning.
TP zone near prior highs, possibly based on historical resistance (purple shaded zone above).
SL placed below the most recent demand zone and 200 EMA — a conservative and safe stop.
🔁 Trade Scenarios
✅ Bullish Outcome (Preferred):
Price respects the retest zone and pushes toward 0.0072802.
Strong momentum or fundamental catalysts could support the breakout continuation.
❌ Bearish Risk:
Price dips below the entry and breaks the demand zone and EMAs.
SL at ~0.0068579 helps manage this risk effectively.
🧩 Summary
This is a well-structured trend continuation long setup with textbook breakout-retest logic. The high R/R makes it an attractive opportunity assuming bullish conditions persist.
📌 Suggested Title
"JPY/USD Long Trade Setup – Breakout Retest Toward 0.0072802 (April 11, 2025)"
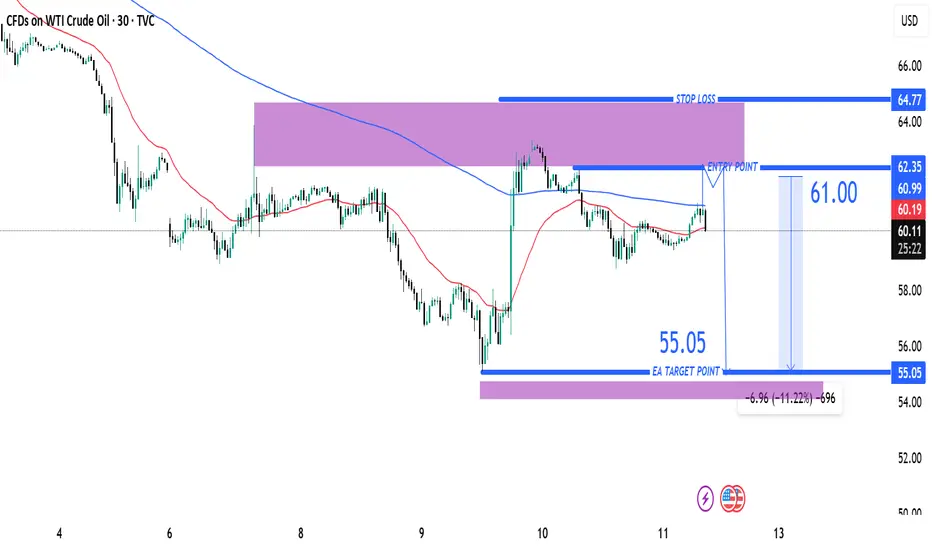
USOIL Short Trade Idea – Targeting $55.05 from $61.00Entry Point: ~61.00 USD
Stop Loss (SL): 64.77 USD
Target (TP): 55.05 USD
Risk/Reward Ratio: Favorable
Risk: ~3.77 USD
Reward: ~5.95 USD
Approximate R/R ratio: 1:1.58
🧠 Strategy Insight
Trend Context:
Prior to the entry zone, price shows a strong downtrend.
The price retraced upward into a resistance zone (highlighted in purple).
The setup suggests a short position anticipating rejection from this zone.
Indicators:
Moving Averages (red & blue):
Likely 50 EMA and 200 EMA showing bearish alignment (price mostly under both).
Resistance Zone:
The purple shaded region represents a supply zone, where price previously reversed.
Entry Zone Analysis:
Entry just below a recent rejection candle.
It's a conservative spot to catch a move back in the direction of the dominant trend.
Target Zone (55.05):
Likely based on a recent support level or demand zone from earlier price action.
Matches previous lows.
🔁 Possible Scenarios
✅ Bearish Scenario (Ideal Outcome):
Price gets rejected from the resistance zone and continues the downtrend toward the target at 55.05.
❌ Bullish Scenario (Risk):
Price breaks above 61.00 and continues toward 64.77, invalidating the short setup.
Bitcoin (BTC/USD) Long Trade Setup –with Target 88,573,60Current Price: $80,724.28
Entry Point: $80,671.23 (just above current price)
Stop Loss: $78,052.44
Target Point: $88,573.60
Resistance Point: $82,260.90
📈 Trend & Moving Averages
EMA 30 (red): $80,220.87 — Short-term trend.
EMA 200 (blue): $80,788.61 — Long-term trend.
The price is currently between the EMAs, indicating potential indecision or a shift in trend. A break above both EMAs with momentum would confirm bullish strength.
🔑 Trade Setup Summary
Element Level
Entry 80,671.23
Stop Loss 78,052.44
Target (TP) 88,573.60
Resistance 82,260.90
Risk-Reward ~1:2.7 (approx)
📊 Analysis & Expectations
Bullish Bias: The chart suggests a long trade with a breakout strategy.
Volume and momentum confirmation will be key above resistance.
Resistance at 82,260.90 may cause a brief pullback before continuation to the target.
The stop loss is well-placed below a support zone and the most recent swing low.
✅ What to Watch For
Break and close above EMA 200 and resistance at 82.2K.
Bullish volume increase on breakout.
Price action around the entry zone (wait for confirmation candle if unsure).
