ChennaiPetro: Wedge & Trendline BO with 61.8%, Chart of the WeekNSE:CHENNPETRO Explosive Breakout: Why This Refinery Stock Could Rally Another 30% After Its Q2 Turnaround. This PSU Refinery Stock Broke Through ₹979 Levels - Here's What Traders Need to Know About the Next Move. Let's Analyse in our Chart of the Week Below.
As per the Latest SEBI Mandate, this isn't a Trading/Investment RECOMMENDATION nor for Educational Purposes; it is just for Informational purposes only. The chart data used is 3 Months old, as Showing Live Chart Data is not allowed according to the New SEBI Mandate.
Disclaimer: "I am not a SEBI REGISTERED RESEARCH ANALYST AND INVESTMENT ADVISER."
This analysis is intended solely for informational purposes and should not be interpreted as financial advice. It is advisable to consult a qualified financial advisor or conduct thorough research before making investment decisions.
Price Action Analysis:
Trend Structure and Momentum:
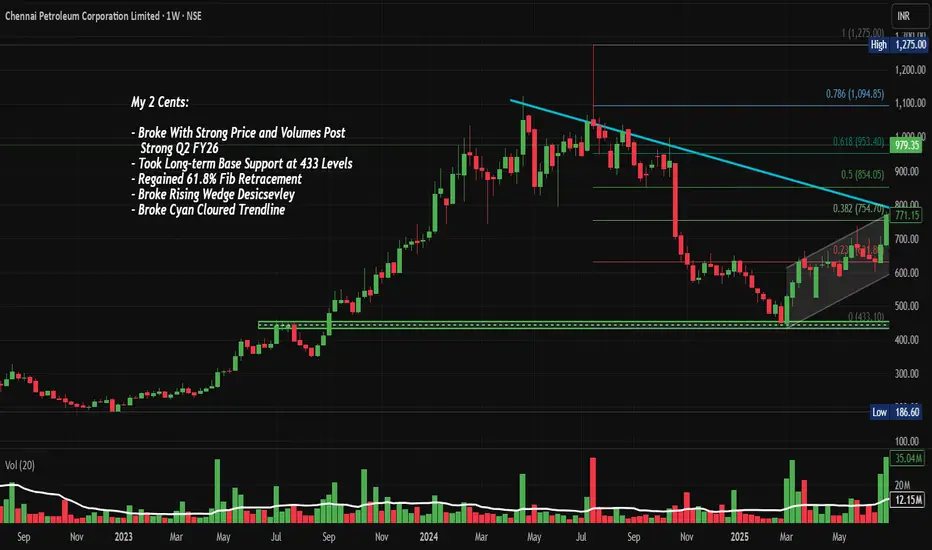
- The stock experienced a prolonged uptrend from March 2023 to July 2024, rallying from base levels around ₹433 to a peak of ₹1,275, representing approximately 195% appreciation
- Post the July 2024 peak, the stock entered a corrective phase characterised by lower highs and consolidation
- Recent price action shows a breakout above the descending cyan trendline that had been capping rallies since mid-2024
- Current price of ₹979.35 (as of October 31, 2025) represents a 26.80% gain, indicating strong buying momentum
- The stock is trading above all key Fibonacci retracement levels, having reclaimed the 61.8% level at approximately ₹953
Candlestick Patterns and Formations:
- The most recent candle shows a strong bullish close with a substantial body, indicating conviction in the upward move
- The chart displays a rising wedge/descending channel pattern that was broken decisively in recent sessions
- Prior consolidation between ₹700-₹850 formed a re-accumulation base, which has now been breached to the upside
- The breakout candle demonstrates strong price and volume expansion, a classic sign of institutional participation
Volume Spread Analysis:
Volume Characteristics:
- Recent volume surge to 90.39 million shares significantly exceeds the average volume of 13.46 million, representing approximately 6.7x normal trading activity
- The volume spike coincides with the price breakout, validating the move as genuine rather than a false breakout
- Historical volume analysis shows similar spikes during major trend reversals, particularly during the March 2023 base breakout
- Volume expansion without corresponding price weakness suggests strong demand absorption at current levels
Volume-Price Relationship:
- The volume profile indicates heavy accumulation in the ₹700-₹800 zone, which now serves as a critical support cluster
- Recent sessions show sustained above-average volume, suggesting institutional interest rather than retail speculation
- The volume pattern aligns with a classic "breakout with expansion" scenario, increasing the probability of trend continuation
Support and Resistance Levels:
Key Support Zones:
- Primary Support (S1): ₹854 - This represents the 0.5 Fibonacci retracement level and previous consolidation high
- Secondary Support (S2): ₹754 - The 0.382 Fibonacci level and recent breakout point from the descending trendline
- Critical Support (S3): ₹631 - The 0.236 Fibonacci level and long-term base support at ₹433-₹450 zone
- The grey trendline originating from the 2024 lows provides dynamic support, currently positioned around ₹720
Key Resistance Zones:
- Immediate Resistance (R1): ₹1,094 - The 0.786 Fibonacci retracement level
- Major Resistance (R2): ₹1,275 - The all-time high achieved in July 2024 and psychological resistance
- Extended Resistance (R3): ₹1,400-₹1,500 - Projected based on measured move from the consolidation range
Technical Patterns and Indicators:
Chart Patterns:
- Descending Channel Breakout: The stock has successfully breached the cyan-colored descending trendline that acted as resistance since July 2024
- Rising Wedge Resolution: The consolidation pattern between August and October 2025 has resolved to the upside
- Base-on-Base Formation: The ₹433 level established in early 2024 served as the foundation for the subsequent rally, demonstrating strong long-term base support
- Cup and Handle (Potential): If the stock consolidates between ₹950-₹1,050 and then breaks out, it could form a cup and handle pattern projecting toward ₹1,400+
Fibonacci Analysis:
- The 61.8% Fibonacci retracement at ₹953 has been convincingly reclaimed, suggesting the corrective phase may be complete
- Golden ratio support held perfectly during the September-October consolidation
- The next Fibonacci target at 0.786 (₹1,094) represents the immediate upside objective
- Fibonacci extension levels project Upmove at ₹1,350 (1.272 extension) and ₹1,500 (1.618 extension) if the rally extends
Risk Factors and Invalidation Levels:
- A close below ₹920 would signal a potential false breakout
- Sustained trading below ₹850 would invalidate the bullish setup and suggest resumption of the downtrend
- Weekly close below the broken trendline (currently around ₹940) would be a bearish reversal signal
- Failure to maintain above 61.8% Fibonacci retracement could trigger another corrective leg
Fundamental and Sectoral Backdrop:
Company Fundamentals:
- Chennai Petroleum Corporation (CPCL) reported Q2 FY26 revenue of ₹16,327 crore with profit after tax of ₹719 crore
- The company achieved a crude throughput of 3.013 million metric tonnes (MMT) with a Gross Refining Margin (GRM) of $9.04 per barrel in Q2 FY26
- However, Q1 FY26 saw challenges with a net loss of ₹40 crore compared to a profit of ₹357 crore in Q1 FY25, primarily due to inventory losses and lower GRM of $3.22 per barrel
- For H1 FY26, CPCL recorded net profit of ₹689.68 crore versus a net loss of ₹294.45 crore in H1 FY25, with average GRM at $6.17 per barrel
- The company achieved a record crude throughput of 11.642 MMT with 111% capacity utilisation
Business Operations and Product Portfolio:
- CPCL is engaged in refining crude oil to produce various petroleum products, including LPG, Motor Spirit, Kerosene, Aviation Turbine Fuel, High Speed Diesel, Naphtha, Fuel Oil, and Bitumen
- The company also produces speciality products like Paraffin Wax, Mineral Turpentine Oil, Hexane, and Petrochemical feedstocks
- Most fuel products are marketed by the parent company, Indian Oil Corporation (IOC), while CPCL directly markets speciality products
- In 2024, CPCL commissioned new infrastructure, including Pharma Grade Hexane production and Sustainable Aviation Fuel
Financial Metrics and Valuation:
- Market capitalisation stands at approximately ₹14,584 crore, with the company maintaining a healthy dividend payout of 35%
- CPCL has demonstrated strong return on equity with a 3-year ROE of 31% and has reduced debt levels
- Current price-to-earnings and other valuation metrics suggest the stock is reasonably valued considering sectoral challenges
Sector Outlook and Industry Trends:
- India's refining capacity increased to 258.1 MMTPA as of FY25, with domestic consumption at 239.2 MMTPA
- India is expected to drive global oil demand growth, with consumption projected at 5.74 million barrels per day in 2025 and 5.99 million bpd in 2026
- The country plans to expand refining capacity to 309.5 MMTPA by 2028
- Refinery output has been strong, with manufacturing IIP for refined petroleum products rising 4.24% in June 2025, driven by auto-fuel demand growth of 7.9% year-on-year
- However, refining margins are expected to fall below mid-cycle levels in FY25, indicating potential profitability challenges
Opportunities and Challenges:
Opportunities:
- Downstream activities driven by refinery-petrochemical integration are projected to post the highest 5.2% CAGR through 2030
- Growing domestic demand for petroleum products with urbanisation and economic growth
- Government initiatives supporting energy infrastructure development
- Indian refiners have benefited from processing discounted Russian crude, generating significant margins
Challenges:
- Net profit declined for the last two quarters, with an average decrease of 108.5% per quarter, and revenue fell 14.1% per quarter
- Volatile crude oil prices and fluctuating gross refining margins
- India's domestic crude oil production has fallen 26.3% and natural gas by 24.1% during FY12-FY25, leading to increased import dependency
- Environmental regulations and pressure to transition toward cleaner energy
- Institutional investment in CPCL decreased by 37.83% over the past 30 days
Competitive Position:
- CPCL is a subsidiary of Indian Oil Corporation, providing strategic advantages in product marketing and distribution
- The company competes with major refiners, including Reliance Industries, Bharat Petroleum, Hindustan Petroleum, and Mangalore Refinery
- CPCL's core vision is to be the most admired Indian energy company, creating value through world-class performance and ethical governance
- The company's location in South India provides strategic advantages for serving the region's growing energy needs
Fundamental Risks:
- The stock trades at reasonable valuations with potential upside to fair value estimates around ₹1,050
- Strong Q2 performance suggests earnings momentum is improving after a weak Q1
- Sectoral tailwinds from growing domestic demand support medium-term prospects
- Key risks include GRM volatility, crude price fluctuations, and regulatory changes
My 2 Cents:
- CPCL presents a compelling technical setup following the breakout from a multi-month consolidation pattern
- The combination of volume expansion, Fibonacci support, and trendline breach suggests potential for further upside
- Risk management is critical given sectoral volatility; strict adherence to stop losses is recommended
Full Coverage on my Newsletter this Week
Keep in the Watchlist and DOYR.
NO RECO. For Buy/Sell.
📌Thank you for exploring my idea! I hope you found it valuable.
🙏FOLLOW for more
👍BOOST if you found it useful.
✍️COMMENT below with your views.
Meanwhile, check out my other stock ideas on the right side until this trade is activated. I would love your feedback.
As per the Latest SEBI Mandate, this isn't a Trading/Investment RECOMMENDATION nor for Educational Purposes; it is just for Informational purposes only. The chart data used is 3 Months old, as Showing Live Chart Data is not allowed according to the New SEBI Mandate.
Disclaimer: "I am not a SEBI REGISTERED RESEARCH ANALYST AND INVESTMENT ADVISER."
This analysis is intended solely for informational purposes and should not be interpreted as financial advice. It is advisable to consult a qualified financial advisor or conduct thorough research before making investment decisions.
Chennaipetro
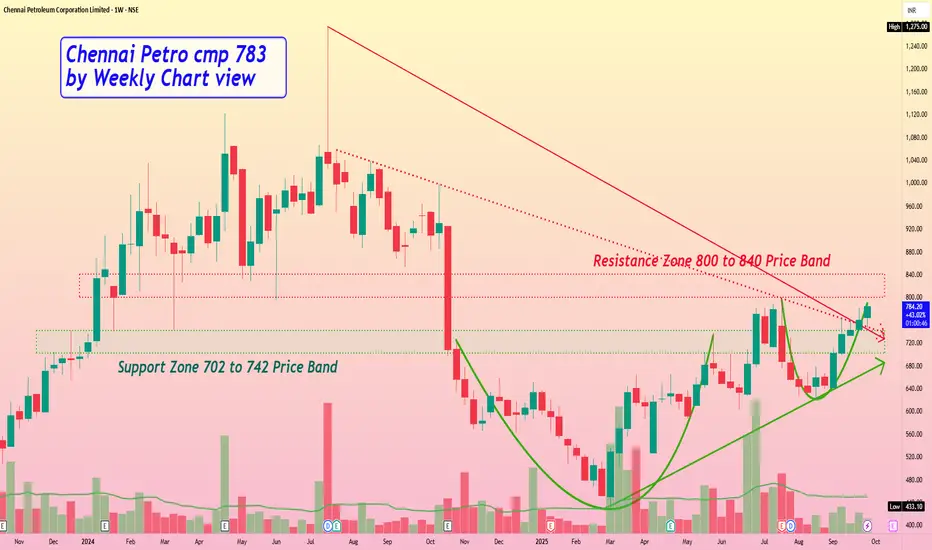
Chennai Petro cmp 783 by Weekly Chart viewChennai Petro cmp 783 by Weekly Chart view
- Support Zone 702 to 742 Price Band
- Resistance Zone 800 to 840 Price Band
- Stock Chart has made a good bullish technical setup
This Stock is Bouncing Back from Strong Support, Big Move ahead.Hello everyone , i hope you all will be doing good in your life and your trading as well. Today i have brought an idea on Chennai Petroleum which is Looking fantastic on chart. Let's analyse this and find opportunity for short term to long term.
Looking at the weekly chart of Chennai Petroleum Corp Ltd., the stock has previously made some huge moves — a 277% rally and even a bigger 462% swing . These past moves highlight that the stock has the potential for major price action when the right conditions align. Right now, the stock has found support at an important rising support trendline , which could set the stage for another upward move.
Recently, a bullish engulfing candle with a significant volume spike formed, which is a strong signal for a potential reversal. For those looking to enter, the 570-530 range could be a good spot. The first short-term target is 651 , followed by 750 and a medium-term target of 851 . For those in it for the long haul, the final target could be around 1065 . If the price moves against us, a stop loss at 433 will help manage the risk. Given the stock's history and recent chart formation, we might just see history repeat itself, making this a solid opportunity for both short-term and long-term trades.
Fundamental Ratio:
Market Cap
₹ 8,360 Cr.
Current Price
₹ 561
High / Low
₹ 1,275 / 433
Stock P/E
22.5
Book Value
₹ 518
Dividend Yield
9.80 %
ROCE
35.1 %
ROE
35.9 %
Face Value
₹ 10.0
Industry PE
20.3
Debt
₹ 6,114 Cr.
EPS
₹ 25.0
Promoter holding
67.3 %
Intrinsic Value
₹ 482
Return over 5years
53.6 %
Debt to equity
0.79
Net profit
₹ 372 Cr.
Disclaimer:- This analysis is for educational purposes only. Please trade responsibly and consult a financial advisor before making any decisions.
If you found this analysis helpful, don’t forget to like, follow, and share your thoughts in the comments below! Your support keeps me motivated to share more insights. Let’s grow and learn together—happy trading!

Chennai Petro: Breakout at 480, Eyeing Strong UpsideDetails:
Asset: Chennai Petroleum Corporation Ltd (CPCL)
Breakout Level: 480
Current Price: 555
Potential Target: Higher levels based on sustained momentum
Stop Loss: Below 540 or as per risk tolerance
Timeframe: Medium-term
Rationale: CPCL has given a breakout at 480 and is currently sustaining well at 555. If it holds this level, the stock has the potential for a strong rally.
Market Analysis:
Technical Setup: Strong breakout followed by sustained momentum, indicating possible further upside.
Sector Strength: Oil & gas refining sector has been performing well, with CPCL benefiting from improving margins and demand.
Risk Management:
Keep a stop loss below 540 to protect against volatility.
Timeframe:
Medium-term move expected with potential strong momentum.
Risk-Reward Ratio:
Favorable breakout setup with high upside potential.
Monitor for sustained volume and price action confirmation.

CPCL Made RSI Bullish Divergence From a Key Level NSE:CHENNPETRO today made a good upmove with good volumes from previous key breakout levels in Sep 2023 with RSI Bullish Divergence on Daily Charts on Back of TVC:UKOIL going below 70 Dollars.
About:
NSE:CHENNPETRO is in the business of refining crude oil to produce & supply various petroleum products and manufacture and sale of lubricating oil additives.
Trade Setup:
Could be a good 1:2.7 Risk Reward Trade Can give pullback up to 200 DSMA
Target(Take Profit):
Around 781 Levels or Falling 200 DSMA for Positional Trader.
Stop Loss:
Entry Candle Low for Swing Trader and Marked Levels for Positional Trader.
📌Thank you for exploring my idea! I hope you found it valuable.
🙏FLLOW for more
👍BOOST if useful
✍️COMMENT Below your views.
Meanwhile, check out my other stock ideas on the right side until this trade is activated. I would love your feedback.
Disclaimer: "I am not SEBI REGISTERED RESEARCH ANALYST AND INVESTMENT ADVISER."
This analysis is intended solely for informational and educational purposes only and should not be interpreted as financial advice. It is advisable to consult a qualified financial advisor or conduct thorough research before making investment decisions.

Chennai Petroleum for 85%+ gainsDate: 23 Oct’24
Symbol: CHENNPETRO
Timeframe: Daily
The 14th Oct post is not visible somehow so posting the same chart.
Chennai Petroleum Corp Ltd currently seems to be in Wave 4 which may end around 780-820, marked as demand zone in the chart. September quarter results are not good so consolidation in Wave 4 can be longer. Wave 5 could then head to around 1500+ levels (85%+ from end of Wave 4). We can review this for more clarity on the target when it moves past 1000.
This is not a trade recommendation. Please do your own analysis.
Chennai Petroleum Corp Ltd vartamaan mein Wave 4 mein dikh raha hai jo 780-820 ke aaspaas samaapt ho sakta hai, jise chart mein Demand zone ke roop mein dikhaya gaya hai. September quarter ke result acche nahi aaye hain to Wave 4 thoda lamba chal sakta hai. Wave 5 tab lagbhag 1500+ star (Wave 4 ke ant se 85%+) tak pahunch sakta hai. Target par adhik spashtata ke lie ham iski sameeksha tab kar sakate hain jab yah 1000 ke paar chala jae.
Yah koi trade lene ki salah nahi hai. Kripya apna vishleshan khud karein.

MRPL for 100% gainsDate: 17 Oct’24
Symbol: MRPL
Timeframe: Daily
Mangalore Refineries & Petrochemicals seems to be in final stages of Wave 4. If it goes down further from present level, 160 should hold well. Both rising volumes and divergence in RSI suggest accumulation in progress in the stock. Wave 5 can mount to around 330-340 (2X from current price of 169). I can review the target once it heads above 230 levels.
This is not a trade recommendation. Please do your own analysis.
HINGLISH VERSION
Aisa lagta hai ki Mangalore Refinery and Petrochemicals Wave 4 ke antim charan mein hain. Yadi yah vartamaan star se aur neeche jaata hai, to 160 level ko hold karna chahiye. Badhti volume aur RSI mein vichalan donon hi stock mein accumulation ka sanket dete hain. Wave 5 lagabhag 330-340 (vartamaan keemat 169 se 2 guna) tak badh sakta hai. Ek baar 230 ke star se oopar pahunch jae to main iske target ki dubara sameeksha kar sakta hoon.
Yah koi trade lene ki salah nahin hai. Kripya apna vishleshan svayan karen.

CHENNAI PETROLEUM If next weekly closing sustains above 1050 then it could move upwards to 📈 1350 within ( 9th Sep 2024 )
If closes below 1050 in next weekly 🕯then it could 📉 move Downside to the red dotted line
Imp support is on blue trend line
Disclaimer:
It's a personal view not a financial advice and I assume no responsibility and liability whatever outcome arises.

Chennai Petro Big Move AheadHey Family, there is a one more stock Which is showing a great opportunity.
Key Points:-
* Forming Ascending Triangle Pattern in daily TF.
* From Feb 2024 to July 2024 its in range.
* From Feb 2024 to July 2024 Tested & Moving Resistance Many times.
* It's break resistance Zone and trying to Sustain above Resistance Zone with good volume.
* Volume Accumulation (Volume is Rising).
What is your view please comment it down and also boost the idea this help to motivate us. We are Certified. All views shared on this channel are my personal opinion and is shared for educational purpose and should not be considered advise of any nature.
Fundamental Analysis
Industry - Refineries
Variance Full Year Net Profit Variance - 22
Equity Latest Equity - 148.91
Face Value Latest Face Value - 10
Reserves Total Reserve - 8672.01
Dividend Full Year Dividend % - 550
Sales Turnover Full Year Net Sales - 66385.73
Net Profit Full Year Net Profit - 2745.07
Full Year CPS Full Year Cash Per Share - 225
Earning Per Share Full Year Earning Per Share - 184.3
Mar 1, 2024
Latest Quarter Sales - 17720.18
Book value - 592.4
Networth Full Year Return on Networth - 63.45
Price to Book value - 1.834909
Yearly PE ratio Full Year Price to Earning per share - 5.9
Full Year Price to Cash Per Share - 4.8
BSE Value in lakhs - 2737.22
NSE Value in lakhs - 27755.57

CHENNAI PETRO - Swing Trade Analysis - 11th July #stocksCHENNAI PETRO (1D TF) - Swing Trade Analysis given on 11th July, 2024
Pattern: ASCENDING TRIANGLE BREAKOUT
- Weekly Resistance Breakout - Done ✓
- Volume Buildup at Resistance - Done ✓
- Demand Zone Retest & Consolidation (for a Small SL and a better RR) - In Progress
Please Note:
- Since the market is at a precarious spot at its levels, we need to be careful & mindful with our entries and position sizing
- Always work in probabilities and always keep your SL in play constantly
* Disclaimer

MACD Crossover Swing Trade📊 Script: HINDUNILVR
📊 Sector: FMCG
📊 Industry: Personal Care - Multinational
⏱️ C.M.P 📑💰- 2231
🟢 Target 🎯🏆 - 2362
⚠️ Stoploss ☠️🚫 - 2172
📊 Script: KPIL
📊 Sector: Capital Goods - Electrical Equipment
📊 Industry: Transmission Line Towers / Equipment
⏱️ C.M.P 📑💰- 1206
🟢 Target 🎯🏆 - 1272
⚠️ Stoploss ☠️🚫 - 1176
📊 Script: CHENNPETRO
📊 Sector: Refineries
📊 Industry: Refineries
⏱️ C.M.P 📑💰- 942
🟢 Target 🎯🏆 - 999
⚠️ Stoploss ☠️🚫 - 912
📊 Script: POWERGRID
📊 Sector: Power Generation & Distribution
📊 Industry: Power Generation And Supply
⏱️ C.M.P 📑💰- 281
🟢 Target 🎯🏆 - 298
⚠️ Stoploss ☠️🚫 - 272
📊 Script: NATCOPHARM
📊 Sector: Pharmaceuticals
📊 Industry: Pharmaceuticals - Indian - Bulk Drugs
⏱️ C.M.P 📑💰- 999
🟢 Target 🎯🏆 - 1069
⚠️ Stoploss ☠️🚫 - 965
⚠️ Important: Always maintain your Risk & Reward Ratio.
✅Like and follow to never miss a new idea!✅
Disclaimer: I am not SEBI Registered Advisor. My posts are purely for training and educational purposes.
Eat🍜 Sleep😴 TradingView📈 Repeat 🔁
Happy learning with trading. Cheers!🥂

CHENNPETRO - Long Setup, Move is ON..NSE:CHENNPETRO
✅ #CHENNPETRO trading above Resistance of 866
✅ Next Resistance is at 1090
Related charts:
Charts are self-explanatory. Levels of breakout, possible up-moves (where stock may find resistances) and support (close below which, setup will be invalidated) are clearly defined.
Disclaimer: This is for demonstration and educational purpose only. This is not buying or selling recommendations. I am not SEBI registered. Please consult your financial advisor before taking any trade.

Chennai Petroleum Corporation Limited - Multiyear Breakout #CHENNPETRO
CMP ₹: 720.8
Date : 07-01-2024
Chennai Petroleum Corporation Limited is an India based petroleum refining company. It's an undervalued and cheap stock . Now trading in its 52 week high level with improving fundamentals. A zero promoter pledge company with reducing debt.ROA , ROE & RoCE improving for the last 2 years.Profit margin also improving YoY. Already given a breakout of its 16 years resistance trend line. Now moving through an upward parallel channel for last 3 months. FIIs are increasing stake in this undervalued hidden gem. 1000 to 2000 levels are not so stoploss below @ ₹. 675 levels.
Disclaimer : Post only for educational purpose. Not a buying / selling recommendation. This is only my personal view. I am not a SEBI registered analyst . Do your own analysis and act accordingly .

CHENNPETRO - Multi-year BreakoutChennai Petroleum Corporation Limited (CPCL) is a company, which offers high speed diesel (HSD) and motor spirit (MS). The Company operates in the downstream petroleum sector.
TTM EPS: 116.21
TTM PE: 4.12
P/B: 2.39
Mkt Cap (Rs. Cr.): 7,126
Dividend Yield: 5.64
Sector PE: 30.01
Book Value Per Share: 200.57
Some Positives:
Strong Momentum: Price above short, medium and long term moving averages
Strong Annual EPS Growth
New 52 week high today
Effectively using its capital to generate profit - RoCE improving in last 2 years
Effectively using Shareholders fund - Return on equity (ROE) improving since last 2 year
Efficient in managing Assets to generate Profits - ROA improving since last 2 year
Company reducing Debt
Strong cash generating ability from core business - Improving Cash Flow from operation for last 2 years
Annual Net Profits improving for last 2 years
Book Value per share Improving for last 2 years
Company with Zero Promoter Pledge
FII / FPI or Institutions increasing their shareholding
Stock gained more than 20% in one month
Some Negatives:
MFs decreased their shareholding last quarter
Decline in Net Profit with falling Profit Margin (QoQ)
Decline in Quarterly Net Profit with falling Profit Margin (YoY)
Declining Net Cash Flow : Companies not able to generate net cash
Major fall in TTM Net Profit
Fall in Quarterly Revenue and Net Profit (YoY)
Recent Results: Declining Operating Profit Margin and Net Profits (YoY)
NOT A RECOMMENDATION. JUST FOR EDUCATION PURPOSE. Thanks

CHENNPETRO - Long Setup, Move is ON..NSE:CHENNPETRO
✅ #CHENNPETRO trading above Resistance of 680
✅ Next Resistance is at 866
Related charts:
Charts are self-explanatory. Levels of breakout, possible up-moves (where stock may find resistances) and support (close below which, setup will be invalidated) are clearly defined.
Disclaimer: This is for demonstration and educational purpose only. This is not buying or selling recommendations. I am not SEBI registered. Please consult your financial advisor before taking any trade.

Doable 📈 There's a strong possibility Chennai petroleum could hit ( 515 within 19th - 26th June 2023 )
Disclaimer:
It's a personal view not a financial advise and I assume no responsibility and liability whatever outcome arises.

CHENNPETRO - Long Setup, Move is ON..NSE:CHENNPETRO
✅ #CHENNPETRO trading above Resistance of 502
✅ Next Resistance is at 680
Related charts:
Charts are self-explanatory. Levels of breakout, possible up-moves (where stock may find resistances) and support (close below which, setup will be invalidated) are clearly defined.
Disclaimer: This is for demonstration and educational purpose only. This is not buying or selling recommendations. I am not SEBI registered. Please consult your financial advisor before taking any trade.


CHENNAI PETRO _ Swing TradeEntry: 411
Target: 485
SL: 386
Pattern: VCP BO
EMA's : EMA21 > EMA30 > EMA40 > EMA50 > EMA150 > EMA200.

CHENNPETRO - Long Setup, Move is ON..NSE:CHENNPETRO
✅ #CHENNPETRO trading above Resistance of 434
✅ Next Resistance is at 502
Related charts:
Charts are self-explanatory. Levels of breakout, possible up-moves (where stock may find resistances) and support (close below which, setup will be invalidated) are clearly defined.
Disclaimer: This is for demonstration and educational purpose only. This is not buying or selling recommendations. I am not SEBI registered. Please consult your financial advisor before taking any trade.

Chennai Petroleum Corporation LimitedTechnical-
Double Bottom Base Structure
stock given breakout with volume pop up
Buy at pullback near 10 WMA
trading above 10 WMA looking good for mrntined target in chart buy near pullback
Industry Sector looking Strong
Concern-
Nifty is weak

Chennai Petro - Near Trendline SupportChennai Petroleum has taken trendline support . Can be bought around 200-207 levels. Looking good for 230-240 levels in short term

chennai petro bullish flag patternchennai petro bullish flag pattern
can look for tp of 194-198 with sl of 89 on monthly cb
Disclaimer: only for educational purpose kindly consult your financial advisor before any investment
