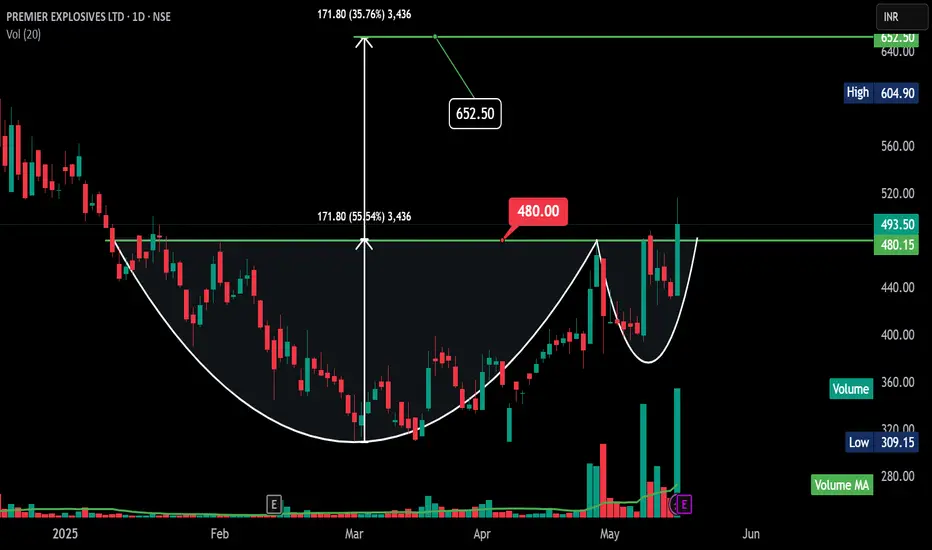
PREMEXPLN - Daily Chart - Cup and Handle PREMIER EXPLOSIVES LTD (PREMEXPLN) daily chart.
**cup and handle** pattern, suggesting potential bullish continuation.
Here's a simple breakdown:
* **Cup:** The rounded bottom formation appears to have taken place between roughly early January and late April 2025. This indicates a period of consolidation after a decline.
* **Handle (Potential):** After reaching a high around ₹480, the price has pulled back and is now showing signs of consolidating again in a smaller range (the potential handle) in early May 2025.
* **Breakout Level:** The horizontal line you've drawn around ₹480 acts as the potential neckline or resistance. A decisive break above this level would provide further confirmation of the pattern.
* **Target:** You've marked a potential target around ₹652.50. This target is typically estimated by measuring the depth of the cup and adding it to the breakout level.
**Things to watch out for:**
* **Handle Formation:** Observe if the current consolidation indeed forms a handle—a smaller, ideally slightly downward-sloping or sideways movement.
* **Breakout :** We need to see if it retests 480 and bounce it is a strong buy.
* **Volume on Breakout:** Increased volume on the breakout it is strength to the bullish signal.
CNH
Vintage Coffee and Beverages Ltd (VINCOFE) - Daily ChartVintage Coffee and Beverages Ltd (VINCOFE) - Daily Chart
Pattern: A clear "Cup and Handle" pattern is identified.
Cup: Formed roughly between late February 2025 and late April 2025, with the low around 75.00.
Handle: A small consolidation (handle) formed in early May 2025.
Breakout: The price appears to be breaking out or has just broken out above the neckline of the cup and handle pattern, which is around the 103.00 - 103.25 level.
Volume: There's a noticeable increase in volume on the breakout day, which is a positive sign, adding strength to the breakout.
Target: The depth of the cup (approximately 29.70 points) is projected upwards from the breakout point. This gives a potential target of around 134.68.
Support: The breakout level around 103.00 - 103.25 should now act as support. The low of the cup (75.00) is a more significant support.
Resistance: The immediate resistance would be the recent swing highs during the handle formation, and then the projected target of 134.68.
Interpretation: The chart suggests a bullish outlook following the Cup and Handle breakout, supported by good volume. The stock has the potential to move towards the 134.68 target as long as the breakout level holds.

Vishal Mega Mart Ltd (VMM) Cup and Handle BO with good volumeThe chart you've provided is a **cup and handle breakout pattern** for *Vishal Mega Mart Ltd (VMM)*, which is a classic bullish continuation pattern in technical analysis.
### Key Observations:
1. **Cup and Handle Formation**:
- The "cup" part of the pattern formed over February to mid-April.
- The "handle" formed shortly after and broke out with a strong bullish candle on April 30.
2. **Breakout Details**:
- Breakout above the resistance zone of **₹113.50–₹117.41**.
- The stock closed at **₹118.48**, up **10%** on high volume—indicating strong buying interest.
3. **Price Target Projection**:
- Depth of the cup is approximately **₹17.56**.
- Projected target from breakout point (₹117.41) is around **₹127.50**, which is also marked on the chart.
4. **Volume Confirmation**:
- Significant volume spike on the breakout day supports the validity of the breakout.
### Summary:
This breakout is a bullish signal, and the target is around **₹127.50**, as long as the price sustains above the **₹113.50** support zone. A retracement to retest this breakout zone is possible, but the pattern remains valid unless it breaks below this support.

BSE - Cup and Handle - BO - DailyHere’s the **technical analysis** for **BSE Ltd. (Bombay Stock Exchange)** based on the chart you shared:
---
### 📊 **BSE Ltd. (NSE) Technical Analysis**
1. **Pattern Observed:**
- Beautiful **Cup and Handle** pattern formed and broken out.
- Previous consolidation (marked rectangle) now successfully cleared.
2. **Key Levels:**
- **Breakout Zone:** ₹5780.
- **Current Price:** ₹6564.
- **Immediate Resistance:** ₹6597 (today's high).
- **Major Target (as per pattern):** **₹7822**.
3. **Volume Confirmation:**
- Strong volume spikes during breakout — **very positive**.
4. **Target Projection:**
- Cup Depth ≈ ₹2057 points.
- Projected Target = Breakout level (₹5780) + Depth (₹2057) = **₹7822**.
5. **Support Levels:**
- ₹5780 (important support now).
- ₹5000 zone (in case of major correction).
---
### 📈 **Summary Table**
| Aspect | Detail |
|:------|:-------|
| Pattern | Cup and Handle |
| Breakout Level | ₹5780 |
| Current Price | ₹6564 |
| Immediate Resistance | ₹6597 |
| Major Target | ₹7822 |
| Support | ₹5780 |
| Bias | **Very Strong Bullish** |
---
### 📋 **Example Trade Setup**
- **Entry:** Hold/Buy on dips near ₹6300–6400 (if retracement happens).
- **Stop Loss:** ₹5700 (safe, below breakout point).
- **Target 1:** ₹6597.
- **Target 2:** ₹7822.
---
### 🧠 Observations:
- BSE Ltd has **already given a sharp move** post-breakout, so a minor retracement or consolidation can happen before the next leg higher.
- RSI and momentum indicators would likely show strong overbought readings — **normal in strong trends**.
---
**Summary:**
✅ **BSE Ltd.** has already **triggered a breakout** and looks extremely **strong towards ₹7822** in the coming weeks. 🚀
✅ Only condition: Ideally, fresh entries should be cautious near highs — **buy on minor dips** or wait for a little consolidation.
---

Mazagon Dock Shipbuilders Ltd - MAZDOCK - CnH Daily BOHere’s the **technical analysis** for **Mazagon Dock Shipbuilders Ltd. (MAZDOCK)** based on your shared chart:
---
### 🚢 **Mazagon Dock (NSE) Technical Analysis**
1. **Pattern Observed:**
- **Cup and Handle** pattern nicely formed.
- **Breakout Level** being tested around ₹2750–2785.
2. **Key Levels:**
- **Breakout Level:** ~₹2750.
- **Current Price:** ~₹2786.
- **Resistance Levels:**
- Immediate: ₹2930 (recent high).
- Major Target: **₹3566** (as per measured move projection).
- **Support Levels:**
- ₹2750 (recent breakout area).
- ₹2500 (strong base in case of pullback).
3. **Volume Confirmation:**
- Good rise in volume during breakout attempt — a very strong bullish indicator.
4. **Target Projection:**
- Cup Depth ≈ ₹825.
- Target = Breakout Zone + Cup Depth
- ₹2750 + ₹825 ≈ **₹3566** (exactly matching your chart projection).
5. **Trend Strength:**
- Long-term higher high and higher low structure visible.
- Bullish bias very strong above ₹2750.
---
### 📈 **Summary**
| Aspect | Detail |
|:------|:-------|
| Pattern | Cup and Handle |
| Breakout Level | ₹2750 |
| Immediate Target | ₹2930 |
| Major Target | ₹3566 |
| Support | ₹2750, ₹2500 |
| Bias | **Strong Bullish** |
---
### 📋 **Trading Idea (Example Setup)**
- **Entry:** ₹2785–2800 after confirmation and stability.
- **Stop Loss:** ₹2600 (safer below previous structure).
- **Target 1:** ₹2930.
- **Target 2:** ₹3566.
---
### 🧠 Important Observations:
- If price struggles around ₹2930 and rejects, it could retest ₹2750 before moving higher — so don't panic if a small pullback happens.
- RSI, MACD momentum check would be ideal to ensure strength (optional).
---
**Summary:**
✅ **Mazagon Dock** is looking **extremely strong** technically, with **good breakout** happening.
✅ Above ₹2750–2785, it could quickly move toward ₹2930 and later ₹3566 with strength! 🚀
---
Would you like me to also **rank all 4 stocks (ICICI Bank, BEL, HAL, Mazagon Dock)** based on their **chart strength, pattern quality, and risk/reward** so you can clearly decide the best opportunities? 📊
(Will prepare a simple and clear table if you want!) ✅

HAL (Hindustan Aeronautics Ltd.) CnH Daily Here's the **technical analysis** for **HAL (Hindustan Aeronautics Ltd.)** based on your chart:
---
### 🛩 **HAL (NSE) Technical Analysis**
1. **Pattern Observed:**
- **Cup and Handle** pattern formed very clearly.
- **Falling channel breakout** already done (yellow downward sloping parallel lines).
- Currently testing **breakout around ₹4400-4425**.
2. **Key Levels:**
- **Breakout Level:** ~₹4400.
- **Current Price:** Around ₹4426.
- **Resistance Levels:**
- **Immediate:** ₹4407–4450 (needs a clean breakout).
- **Major Target:** **₹5725** (based on the cup height projection).
- **Support Levels:**
- ₹4075 (previous minor resistance now support).
- ₹3775 (stronger support).
3. **Volume Confirmation:**
- Decent volume spike seen during breakout attempts — a positive sign.
4. **Target Projection:**
- Cup Height ≈ ₹1325.
- Target = Breakout Zone + Height
- ₹4400 + ₹1325 ≈ **₹5725** (matches your chart projection too).
5. **Trend Strength:**
- Long-term falling channel broken on the upside.
- Strong bullish bias if ₹4400 zone sustains.
---
### 📈 **Summary**
| Aspect | Detail |
|:------|:-------|
| Pattern | Cup and Handle + Falling Channel Breakout |
| Breakout Level | ₹4200 |
| Immediate Target | ₹5000 |
| Major Target | ₹5725 |
| Support | ₹4075, ₹3775 |
| Bias | **Strong Bullish** |
---
### 📋 **Trading Idea (Example Setup)**
- **Entry:** ₹4425–4450 after confirmation.
- **Stop Loss:** ₹4075 (safe below support).
- **Target 1:** ₹5000 (partial profit booking).
- **Target 2:** ₹5725 (full target).
---
### 🧠 Important Observations:
- If it fails to sustain above ₹4425, there might be a minor retest towards ₹4200-4100 before resuming upward.
- RSI/Momentum indicators should ideally confirm the move (optional extra check).
---
**In short:** HAL looks **very strong** if ₹4407 breakout sustains! 🚀
---
Would you also like me to prepare a **combined comparative swing plan** for **ICICI Bank, BEL, and HAL** together — showing which is strongest and best suited based on risk/reward? 📊✨
(Will help you prioritize if you are selecting between them.)

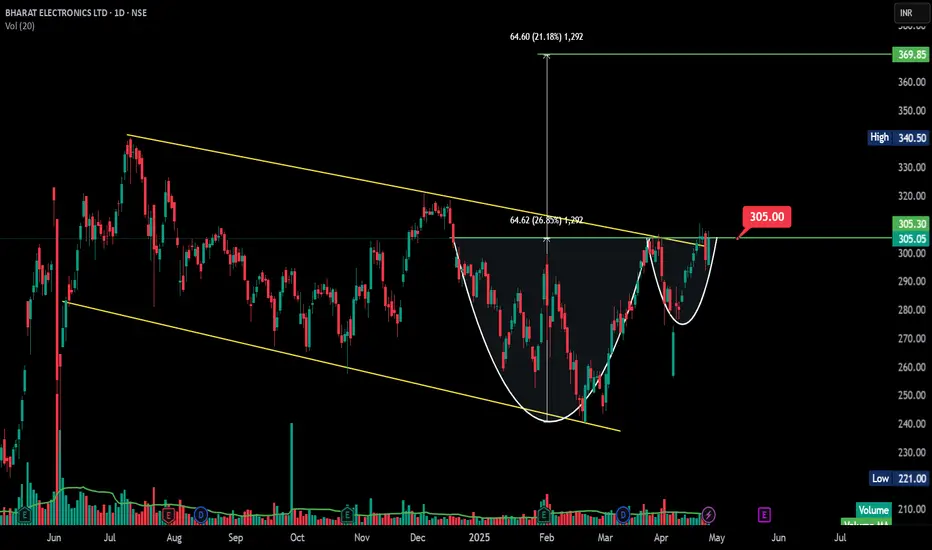
BEL (Bharat Electronics Ltd.) Cup and Handle pattern DailyHere's the **analysis** for **BEL (Bharat Electronics Ltd.)**
Need to close above 306 for confirmation
---
### 🏭 **BEL (NSE) Technical Analysis**
1. **Pattern Observed:**
- Clear **Cup and Handle** pattern.
- Breakout happening **around ₹305**.
- Also, a **falling channel breakout** is observed (yellow parallel lines).
2. **Key Levels:**
- **Breakout Zone:** ₹305.
- **Current Price:** Around ₹305.
- **Resistance Levels:**
- ₹340 (intermediate resistance — recent swing high).
- **Major Target:** ₹369-370 zone (based on the cup height projection).
- **Support Levels:**
- ₹290 (handle low).
- ₹265-270 (channel mid-support).
3. **Volume Confirmation:**
- Good volume surge during the breakout, confirming buyer strength.
4. **Target Projection:**
- Height of Cup = ~₹64.
- Projected Target = Breakout Price + Height
- ₹305 + ₹64 ≈ **₹369** (aligned with your target).
5. **Trend Strength:**
- Breakout from a **long consolidation range** (almost a year).
- Momentum could stay strong if ₹305 holds.
---
### 📈 **Summary**
| Aspect | Detail |
|:------|:-------|
| Pattern | Cup and Handle + Falling Channel Breakout |
| Breakout Level | ₹305 |
| Immediate Target | ₹340 |
| Major Target | ₹369-370 |
| Support | ₹290, ₹270 |
| Bias | **Strong Bullish** |
---
### 📋 **Trading Idea (Example Setup)**
- **Entry:** ₹305-310
- **Stop Loss:** ₹288 (below handle low)
- **Target 1:** ₹340
- **Target 2:** ₹369
Risk-Reward is favorable (approx 1:3).
---
ICICI Bank Cup and Handle breakout DailyICICI Bank (NSE) Technical Analysis
Pattern Observed:
A Cup and Handle breakout pattern is visible.
The cup formation is well-rounded, and the handle was a shallow correction before the breakout.
Key Levels:
Breakout Zone: ₹1,364 (handle resistance breakout).
Current Price: Around ₹1,428.
Resistance Levels:
₹1,436 (recent high, minor resistance).
Major Target: ₹1,538 based on the measured move of the cup depth.
Support Levels:
₹1,364 (previous breakout zone — now support).
₹1,190 (major historical support).
Volume Confirmation:
Breakout above the handle accompanied by a good surge in volume, confirming the strength of the breakout.
Target Projection:
Height of Cup = ~173 points.
Projected Target = Breakout Point + Height
₹1,364 + 173 ≈ ₹1,538 (matches with your chart).
Strength Indicator:
Strong bullish momentum post-breakout.
Volume increasing on up-days — a healthy sign for continuation.

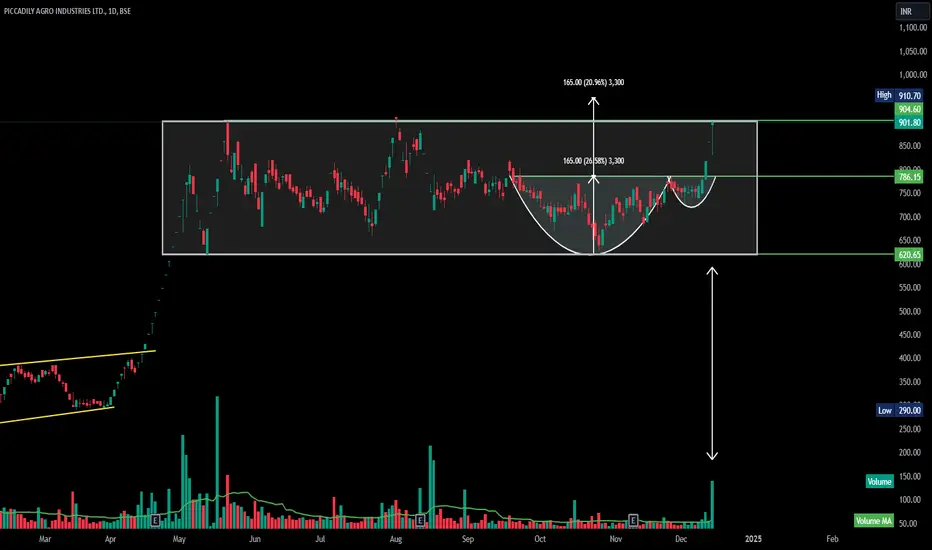
PICCADIL - CnH -Consolidation BreakOut-DailyThis chart **Piccadily Agro Industries Ltd.** (PICCADIL) on the **BSE**.
Here are the key technical observations:
1. **Pattern:**
- An **cup-and-handle pattern** is identified, which is typically a bullish continuation setup.
- The price has confirmed a breakout above the handle's resistance.
2. Consolidation Breakout:
-The price has successfully broken out of the 900 resistance with strong bullish momentum.
-The breakout represents the end of the multi-month consolidation phase since April 2024,
confirming a significant bullish bias.
- The breakout has occurred on high volume, confirming buying interest and enhancing the
reliability of the pattern.
3. Measured Target:
The expected upward move is calculated based on the depth of the cup:
Height of the cup ≈ 165 points.
Target post-breakout = Breakout level (786.15) + Depth of the cup (165) = ~951.15.
This aligns with the chart showing a potential 20.96% upside.
4. **Key Levels:**
Support Levels:
786.15: Now a key support after the breakout.
620.65: Strong base support for the pattern.
Resistance Levels:
904.60: Immediate resistance, just below the target zone.
951.15–960.00: Projected target based on the measured move.
5. **Volume Analysis:**
- Sustained increases in volume around the breakout region suggest institutional buying.
BHARTIHEXA - Cup and Handle -Breakout - DailyName - BHARTIHEXA
Pattern - Cup and Handle breakout
Timeframe - Daily
Volume - Average
Cmp - 1291
Target - 1509
SL - 1238
Always welcome for any comments with your feedback or give it a like if you find it useful.

CYIENT - Cup and Handle - Breakout -DailyName - CYIENT
Pattern - Cup and Handle breakout
Timeframe - Daily
Volume - Good
Cmp - 2118
Target - 2471
SL - 2057 and 1939
Always welcome for any comments with your feedback or give it a like if you find it useful.

TATACOMM - Cup and Handle - Breakout - DailyName - TATACOMM
Pattern - Cup and Handle breakout
Timeframe - Daily
Volume - Good
Cmp - 2021
Target - 2419
SL - 2006
Always welcome for any comments with your feedback or give it a like if you find it useful.

AUDCNH Watch update - do not rush trades here
- It's XMAS time due to less volume wait for A+ setups and do not do anything forcefully
- Be cautious so that you don't get stopped out

#Gravita CnH formed and now upside#Gravita has formed Cup and Handle and also retested the earlier breakout level.
Current Market Price is 461 and abv 470 the price may test 500/540/590 in coming weeks. Stoploss can be taken as 395 on closing basis.
Gravita has posted very good result and the stock is continuously strong with good volume.

LTFood#LTFood CMP 100.1 may close abv earlier BO level.
Forming a CnH
can be bought for 20-30% upside.

cup and handle 5 yrsweekly -5yrs of accumlation in forming cup and emergance of high vol in rh side sign of accumlation , increase in demand .
in weak market holding up sign of strength.Retest in handle good sign.

cup and handleone year CNH completion and emegaence of high volume in rh side of handle positive sign.
current correction outperforming index sign of future leadeship

CNHcup completed and vol emergence in RH side.
shakeout done twice and at ATAH...
out performing index also recipe for good rewards

Excel Ind poised for great returnIt has created a CNH pattern. The CMP is very near to ATH and monthly RSI has a lot to fire. It would be an excellent long time pick.


1.5 yrs TR brakeoutwith multiple rejection the resistance getting weaker and emergence of volume and CUP about to complete.
ready for explosion


CNH and IPO base boIPO base and cup completion and pull back with low vol recipe for strong breakout watchout
