Colgate cmp 2166.30 by Weekly Chart viewColgate cmp 2166.30 by Weekly Chart view
- Support Zone 1910 to 2050 Price Band
- Resistance Zone 2200 to 2350 Price Band
- Stock was making Lower High Lower Lows since last week of Sept 25
- Stock seems attempting uptrend from Support Zone over the last 2 weeks
- Volumes seemingly seen increasing over past few weeks by demand base buying
- Stock Price seems coming out of Bearish Falling Price Channel taking a Bullish momentum
Colgate

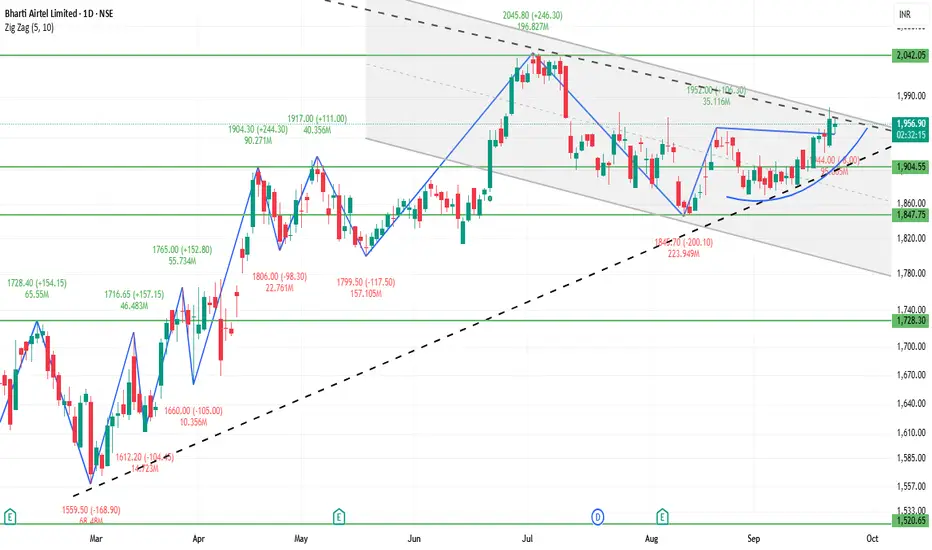
BHARTIARTL 1D Time frame🔍 Current Price & Context
Trading around ₹1,950 – ₹1,960 (approx).
Day’s range recently: low ~ ₹1,944 – ₹1,946, high ~ ₹1,920 – ₹1,925 — showing testing of resistance.
52-week range: low ~ ₹1,510, high ~ ₹2,045.
🧮 Strategy / Trade Ideas
Long Setup:
Entry could be around / just above support zone (₹1,900 – ₹1,895) if there are reversal signals (bullish candles, volume).
Stop loss: slightly below deeper support (~₹1,870 – ₹1,880) to protect against breakdown.
Initial target: resistance around ₹1,920 – ₹1,930. If crossed, then next target near ₹1,950 – ₹1,960.
Short / Pullback Setup:
If price fails to break above resistance (~₹1,920 – ₹1,930) and shows signs of reversal (bearish candle, volume drop).
Target downward to support ~₹1,900, then further to ~₹1,880 – ₹1,870.
Breakout Setup:
If it breaks above ~₹1,950 – ₹1,960 with good volume, then move toward psychological level ~₹2,000 and possibly toward 52-week high (~₹2,045).
✅ Summary
Bharti Airtel in daily chart is showing a mild bullish bias, but the resistance zones (~₹1,920-₹1,930, ₹1,950-₹1,960) are critical. Holding above support around ₹1,900 is important. A clear breakout above resistance could open room for upside; failure to do so may lead to sideways movement or slight downside.
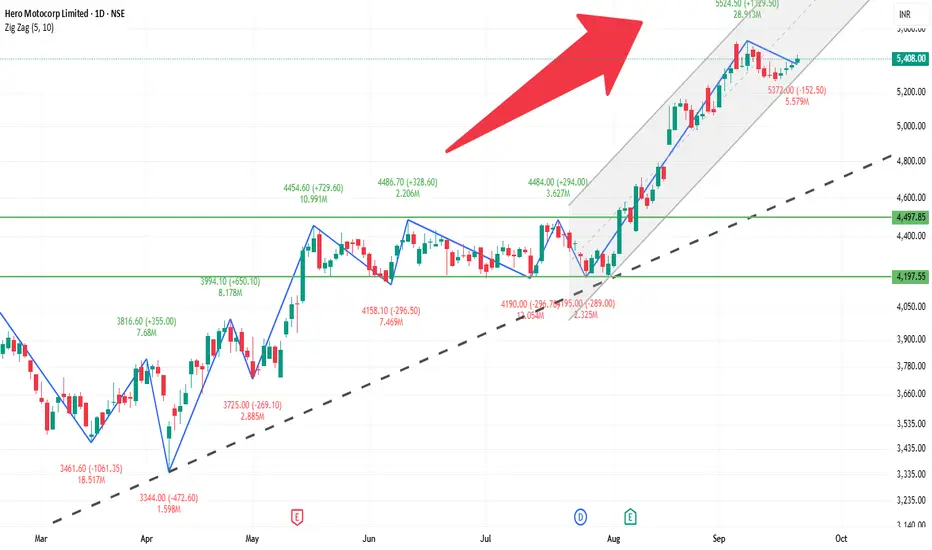
HEROMOTOCO 1D Time frameCurrent Price: 5,408 (near recent highs).
Current Trend: Strong bullish momentum; stock is trading above key resistances.
Support Zone: Immediate support at 5,300 – 5,350. If this holds, uptrend remains intact.
Resistance Zone: Next resistance is around 5,500 – 5,550. A breakout above this can push toward 5,650+.
Indicators: Daily candle structure is bullish, showing higher highs and strong buying interest.
Outlook:
Above 5,500 → continuation of bullish rally.
Below 5,300 → minor weakness; may slip toward 5,200.
👉 In short (with 5,408 price):
Bullish tone.
Range to watch: 5,300 – 5,550.
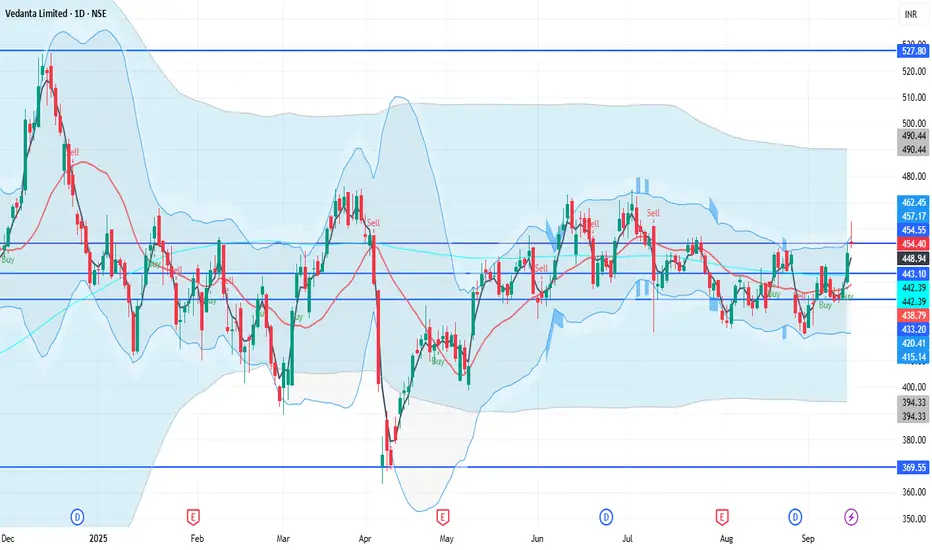
VEDL 1D Time frameCurrent Price
₹454.20
🔹 Market Snapshot
Day’s Range: ₹454.15 – ₹462.80
Previous Close: ₹450.90
52-Week Range: ₹363.00 – ₹526.95
Market Cap: ₹1.80 lakh crore
P/E Ratio (TTM): 12.37
P/B Ratio: 4.81
Dividend Yield: 9.44%
Book Value per Share: ₹95.87
EPS (TTM): ₹37.25
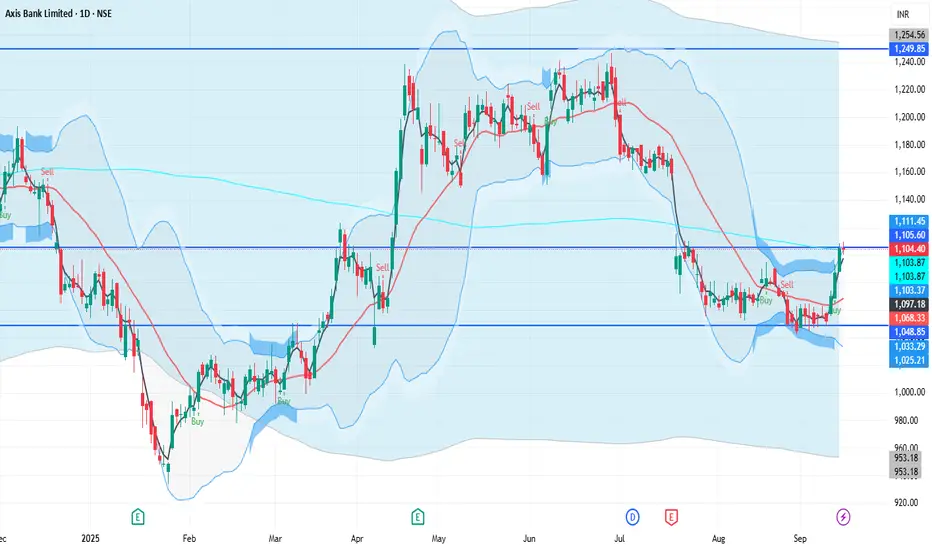
AXISBANK 1D Time frameUpdated Snapshot
Current Price: ₹1,105 – ₹1,107
Day’s Range: ₹1,101 – ₹1,110
Previous Close: ₹1,105.30
🔹 Support & Resistance
Support 1: ₹1,100 – ₹1,095
Support 2: ₹1,085 – ₹1,080
Resistance 1: ₹1,110 – ₹1,115
Resistance 2: ₹1,125 – ₹1,130
NIFTY 1D Time frameCurrent Price & Trend
Level: ~25,114
Day’s Range: 25,038 – 25,139
52-Week Range: 21,743 – 26,277
Trend: Neutral to bullish; trading near the higher end of the yearly range.
Bullish Scenario
If NIFTY sustains above 25,000, upside targets are 25,250 – 25,500 in the short term.
Strong buying volumes could lead to new highs beyond 26,000.

HDFCBANK 1D Time frame📉 Current Market Snapshot
Closing Price: ₹967.80
Day's Range: ₹962.25 – ₹970.75
52-Week High: ₹1,018.85
52-Week Low: ₹806.50
Market Cap: ₹14,85,200 crore
P/E Ratio (TTM): 21.44
P/B Ratio: 3.38
Dividend Yield: 1.13%
EPS (TTM): ₹45.97
Book Value: ₹339.84
Face Value: ₹1.00
Volume: 14,363,519 shares
VWAP: ₹966.64

Colgate Palmolive Colpal On Weekly Demand Zone New Study For Paper Colgate Palmolive Ltd
Buying Zone
2700 50% Qty
2650 Add More 25% qty
2625 Add More 25% qty
StopLoss : 2600
Target : 2960-70, 3200-3400,3800 (Long)
Study Logic
👉 Weekly Demand Zone
#Marker Sentiment Is Weak So Risky Study
Only For Paper Trade And Education Purpose Don't Real Trade
I am not sebi Registered Person Post is only for Paper Trade, Practice And Education purpose i am not responsible for any profit and loss.

COLPAL nearing short support levelsCOLPAL has been continuously falling from quite some time.
It is close to the support levels of 50 percent Fibonacci levels from where the run up started. The 50% levels comes around 2665 which would be a support in this fall.
Currently it is placed at a position where it may bounce from those levels for short term with atleast 9-10 pct move. Levels of resistance from those levels are at 2789-2962
If doesn't sustain, the next level to watch would be the 38% levels.
No recommendations, just my view based on chart pattern.

Intraday 26 April_ Colgate Palmolive_ LONGIntraday Trade setup for 26 April
I have selected 4 stocks for intraday, not all the trades will get executed.
I always place Stop Loss Market Buy/Sell order above or below (for LONG and SHORT) the high/low of the reference candle to make an entry.
Trade should be cancelled if not executed between 9:15 AM till 10 AM. It won't be re-entered.
Entry: 1515.45
SL: 1510
Target: 1526/27
Disclaimer: The analysis or trade setup is of my own. Please do your own analysis before jumping into the trade. I shall not be responsible for the profit/loss in either way.

Round Bottom / Cup & Handle Pattern Great Up Move is ComingHii All,
Colgate has given a good breakout.
Next Easy targets could be
1. 1654
2. 1680
Important Things
1. This is only for educational purposes only.
2. Never over trade.
3. Always keep Stop Loss.
4. Trade in limited quantity.
5. Taking a small loss is better than wiping up your whole capital.
I hope you found this idea helpful.
Please like and comment.
Share with Your Friends.
Keep Learning,
Happy & Safe Trading

Trendline and Range StockThis is simple Monthly Chart of COLGATE PALMOLIVE (COLPAL) and it is respecting the trendline and the resistance line, thus in a UPTREND CHANNEL since 2009.
Long term trend always prevails in the market, Even if someone is stuck in a stock at wrong time but if its longer trend is in uptrend there are high chances that it will recover some day.
High time frame analysis has its own benefits such as higher returns, less follow up , dividends and other benefits. It could be seen as an investment perspective as well.
This time there is a BULLISH HAMMER candle made in february 2023 at the support of the trendline. This is the one of the simple analysis which shows that investment and trading in the market is easy and doesn't require rocket science. This is a favorable RISK-REWARD opportunity with a very small Stop loss at the low of the last hammer Candle.
ENTRY can be made at the current market price of 1488
STOPLOSS can be on the closing basis on the last candle i.e. at 1430 (Logic behind closing basis is that it is currently in an Uptrend so if it wants to go in a downtrend it will require a strong downside closing confirmation for the same otherwise if the price goes below the low of the last candle, Buyers may come and can take the price up again)
REWARD - the first target would be the last swing/Resistance that is 1674 and then at its last high of 1800 and then next target would be the resistance which is likely to be 2000.
*this is a Monthly Analysis, so requires longer patience.
*keep position Sizing according to your Risk Appetite.
*Market is simple, don't make it complicated, Simple things works, It is just a probability Game.
One can take ReEntry if it gives another opportunity but be ready to give SL.

COLPAL NEAR SUPPORT ZONE | BOUNCE EXPECTEDColpal near it's support zone and expecting a bounce towards white marked targets on the chart.
To motivate us, Please like the idea If you agree with the analysis.
Happy Trading!
InvestPro India Team

colgate analysisCOLGATE-PALM ANALYSIS
Time Frame Analysis:
--------------------
Monthly: If the Previous low (1547.05) is taken out then we can yes Downtrend begins.
Weekly: Downtrend
Daily: Downtrend
Pattern:
--------
Monthly: Symmeterric Pattern.
Daily: Ascending Pattern.
Price & Volume relation:
------------------------
Volume is supporting on Daily, Weekly & but on Monthly not.
Conclusion: Once Ascending triangle breakout (Daily) then we can enter with a small qty & once the monthly symmetric triangle pattern is taken out then we add more.

Colgate - Next MoveColgate is trading at a crucial level. Levels are mentioned on the charts. Sustaining below 1685 may take the stock to the levels of 1625-1600. Or sustaining above 1685 levels, will give a breakout for the target of 1740.
Only for learning and sharing purposes, not a piece of trading advice.
Always calculate your risk before entering a trade, rather than calculating profits.
All the best.

KEEP SMILING WITH COLGATEColpal is looking very bullish and strong weekly chart it is looking a strong up move reversals in it giving a breakout on falling resistance trendline and gives a strong breakout on Bollinger bands too so we can see a good upward rally in this strong fundamental giant.
Cause of long-:
1- Falling resistance trendline breakout.
2- Bollinger bands breakout.

Target 1 and 2 achieved in Colagte | 5.5% MoverThis idea is a follow-up to Colgate.
You can check the Link to Related Ideas ( Detailed analysis done in 22nd Aug Video )
Disclaimer: The information provided is for educational purposes only. Our intention is not to give any financial advice, don't take any decision without consulting your financial advisor.

Symmetrical triangle breakout in ColgateChart -> Colgate Daily
Colgate has given a symmetrical triangle breakout with a good volume pop-up.
CMP: 1630
Targets: 1700, 1780
SL: Daily closing below 1550
Disclaimer: This is for educational purposes only, not any recommendations to buy or sell. As I am not SEBI registered, please consult your financial advisor before taking any action.

SWING SETUP IN COLGATE ANALYSIS SHARED IN ATTACHED SCREENSHOT
points :
double bottom
accumulation
golden ratio retracement
good volme

Simple Trade Setup |COLPAL | 02-05-2022 [INTRADAY]NSE:COLPAL
Trade Setup for 02-05-2022
1) Don't Jump in to trade at the beginning of the market. Let it get settle for 15-20min first and judge the price action.
2) Everything is mentioned on the chart. I hope it is easy to understand.
3) All the levels will work as support, resistance, entry and exit w.r.t price action near that level.
4) Avoid gap up or gap down chase. Wait and trade between levels.
Please refer below chart for levels.
Hope I made it easy to understand it.
Do comment your doubt or suggestion.
Note: Trade with Strict SL. It may or may not hit all the levels. So one can book profit / loss at respective level considering how price action works near that level.

Colpal Long (14 Mar)Colpal Long (14 Mar)
RSI- 50
we can see support at 200 week EMA
Strong buying with good volumes seen last week
Buy at CMP- 1498
SL- 1390
Target- 1630, 1728 and more
Join us, Learn more, Earn more
Disclaimer- We are not SEBI registered advisor.
Charts and views are only for educational purpose.

Simple Trade Setup | COLPAL | 11-04-2022 [INTRADAY]NSE:COLPAL
Observations:
1) On 15min time frame, we can see it in support channel as well as near the 1550-1560 support zone. If it sustain above it and takes support from it then we can see a pull back on up side but breakdown of both can lead more selling in it.
Please refer below chart : 15min time frame.
-------------------------------------
Trade Setup for 11-04-2022
1) Don't Jump in to trade at the beginning of the market. Let it get settle for 15-20min first and judge the price action.
2) Everything is mentioned on the chart. I hope it is easy to understand.
3) All the levels will work as support, resistance, entry and exit w.r.t price action near that level.
4) Avoid gap up or gap down chase. Wait and trade between levels.
Please refer below chart for levels.
Hope I made it easy to understand it.
Do comment your doubt or suggestion.
Note: Trade with Strict SL. It may or may not hit all the levels. So one can book profit / loss at respective level considering how price action works near that level.

Simple Trade Setup | COLPAL | 04-04-2022 [INTRADAY]NSE:COLPAL
Observations:
1) On 1 day time frame it has formed rounding bottom pattern.
Please refer below chart : 1day time frame.
Sustainable breakout of 1560 will be buy entry.
-------------------------------------
Trade Setup for 04-04-2022
1) Don't Jump in to trade at the beginning of the market. Let it get settle for 15-20min first and judge the price action.
2) Everything is mentioned on the chart. I hope it is easy to understand.
3) All the levels will work as support, resistance, entry and exit w.r.t price action near that level.
4) Avoid gap up or gap down chase. Wait and trade between levels.
Please refer below chart for levels.
Hope I made it easy to understand it.
Do comment your doubt or suggestion.
Note: Trade with Strict SL. It may or may not hit all the levels. So one can book profit / loss at respective level considering how price action works near that level.
