Colgate cmp 2166.30 by Weekly Chart viewColgate cmp 2166.30 by Weekly Chart view
- Support Zone 1910 to 2050 Price Band
- Resistance Zone 2200 to 2350 Price Band
- Stock was making Lower High Lower Lows since last week of Sept 25
- Stock seems attempting uptrend from Support Zone over the last 2 weeks
- Volumes seemingly seen increasing over past few weeks by demand base buying
- Stock Price seems coming out of Bearish Falling Price Channel taking a Bullish momentum
COLPAL

COLPAL - STWP Equity Snapshot📊 STWP Equity Snapshot – Colgate-Palmolive (India) Ltd (COLPAL)
(Educational | Chart-Based Interpretation)
COLPAL has transitioned from a corrective phase into a demand-led recovery, with price reacting decisively from the 2097–2074 demand zone. This zone has historically attracted buyers, and the recent rebound reflects active absorption of selling pressure rather than a passive bounce. Price is now stabilising around the 2184 balance area, which acts as an important near-term reference. Sustained holding above this zone keeps the short-term structure stable and allows price to test higher reaction zones between 2288 and 2358, where acceptance will determine continuation quality. On the downside, any weakness below 2184 increases risk toward 2138 initially, followed by a deeper retest of the 2097–2074 primary demand zone, where the broader structure would be reassessed. As long as price remains above this demand band, the larger trend framework stays constructive.
Indicator readings from the dashboard support this developing structure. The presence of a strong bullish candle emerging after a period of consolidation indicates renewed buyer initiative. Bollinger Band behaviour shows prior volatility compression, with early signs of expansion now appearing, suggesting a shift from balance toward directional intent rather than a late-stage move. The BB squeeze context increases the relevance of the current expansion attempt, while RSI near the bullish mid-zone (~60) reflects improving internal strength without signs of exhaustion. Price holding above short-term trend measures reinforces near-term stability. At the same time, interaction with a wide CPR structure suggests that the market remains in a balanced environment, where consolidation, pauses, or controlled pullbacks toward value zones are more likely than immediate acceleration. Acceptance and follow-through remain more important than candle size alone.
Volume behaviour adds important confirmation to the price structure. Participation has expanded during bullish candles, indicating genuine buyer involvement rather than a low-liquidity reaction. Volume intensity remains within a healthy range, with no signs of climax or exhaustion typically associated with late-stage moves. Pullbacks have occurred on relatively lighter volume, suggesting that selling pressure is being absorbed rather than aggressively expanding. Overall, volume dynamics align with a controlled recovery and support the view that the move is being built through participation rather than emotion.
From a short swing perspective, COLPAL maintains a positive structural bias as long as price holds above the 2097–2074 demand zone. If acceptance improves and momentum sustains, higher range-expansion reference zones between 2388 and 2541 come into focus over the coming sessions. Conversely, sustained acceptance below 2074 would elevate downside risk and indicate a transition from recovery into a deeper corrective phase. Until such failure occurs, consolidation above demand should be viewed as healthy digestion of gains rather than structural weakness.
Final Outlook (Condition-Based):
Momentum is moderate and improving, the broader trend remains upward, risk stays elevated due to the recovery nature of the move and nearby supply, and volume remains supportive but requires continued follow-through.
💡 STWP Learning Note
Strong recovery candles show intent — confirmation comes only with acceptance above supply.
⚠️ Disclaimer
This post is shared strictly for educational and informational purposes. It is not investment advice or a recommendation. Please consult a SEBI-registered financial advisor before making any financial decision.
🚀 Stay Calm. Stay Clean. Trade With Patience.

Options OI Trade Outlook — Bullish Setups Only________________________________________
📊 Options OI Trade Outlook — Bullish Setups Only
“This analysis is shared purely for educational purposes and market awareness — not a trading recommendation.”
(Educational Purpose | Not Financial Advice | SEBI Compliant)
Hello Traders 👋,
Here are today’s 7 Bullish Option Setups based on OI + Price Action + IV + Greeks study.
This is strictly for learning and educational purposes only.
________________________________________
🟢 1. ITC 410 CALL
LTP: 7.25
Sentiment: Bullish | Trend: Up | Strength: 5/5 (Strong)
IV: 13.3 | Delta: 0.55 | Theta: -0.20 | Vega: 0.46
Buildup: Long Build-up
Why?
410 CE shows a strong Long Build-up with price ↑ 70.6% and OI ↑ 31.2%.
Volume jumped +305.9%, confirming active participation.
Low IV makes premiums attractive. Delta 0.55 indicates higher ITM probability.
________________________________________
🟢 2. CGPOWER 700 CALL
LTP: 23.5
Sentiment: Bullish | Trend: Up | Strength: 5/5 (Strong)
IV: 30.9 | Delta: 0.52 | Theta: -0.65 | Vega: 0.79
Buildup: Long Build-up
Why?
700 CE surged +127% in price with OI ↑ 216.5% — strong long confirmation.
Volume spiked +2962%, showing aggressive buying.
IV rising (+10.3%) supports premium expansion.
________________________________________
🟢 3. COLPAL 2340 CALL
LTP: 61.7
Sentiment: Bullish | Trend: Up | Strength: 5/5 (Strong)
IV: 22.4 | Delta: 0.53 | Theta: -1.52 | Vega: 2.64
Buildup: Long Build-up
Why?
2340 CE gained +89.8% in price with OI ↑ 146.9%.
Volume surged +2357%, indicating strong trader interest.
Moderate IV gives a balanced risk-reward setup.
________________________________________
🟢 4. LT 3600 CALL
LTP: 76.25
Sentiment: Bullish | Trend: Up | Strength: 5/5 (Strong)
IV: 15.9 | Delta: 0.55 | Theta: -2.34 | Vega: 4.06
Buildup: Long Build-up
Why?
3600 CE rose +29.2% with OI ↑ 3.6%.
Volume ↑ 71%, confirming active participation.
Delta 0.55 signals higher ITM chances with bullish momentum.
________________________________________
🟢 5. BRITANNIA 5800 CALL
LTP: 172
Sentiment: Bullish | Trend: Up | Strength: 5/5 (Strong)
IV: 21.6 | Delta: 0.57 | Theta: -3.46 | Vega: 6.52
Buildup: Long Build-up
Why?
5800 CE rallied +49.6% with OI ↑ 16.5%.
Volume jumped +566%, confirming buying momentum.
IV rising (+9.4%) shows strong premium expansion potential.
________________________________________
🟢 6. ASIANPAINT 2500 CALL
LTP: 77
Sentiment: Bullish | Trend: Up | Strength: 3.9/5 (Strong)
IV: 20.8 | Delta: 0.59 | Theta: -1.40 | Vega: 2.79
Buildup: Short Covering
Why?
2500 CE benefited from short covering — price ↑ 21% while OI ↓ 21.6%.
This indicates shorts exiting, fueling bullish momentum.
Volume dipped (-15.9%), so position sizing should be careful.
________________________________________
🟢 7. DMART 4800 CALL
LTP: 101
Sentiment: Bullish | Trend: Up | Strength: 5/5 (Strong)
IV: 20.2 | Delta: 0.50 | Theta: -3.53 | Vega: 5.40
Buildup: Long Build-up
Why?
4800 CE rose +12.1% with OI ↑ 17.5% — strong long confirmation.
Volume ↑ 159.9% adds conviction.
IV easing (-6.1%) ensures better fills with controlled risk.
________________________________________
⚠️ Disclaimer – Please Read Carefully
The information shared here is meant purely for learning and awareness.
It is not a buy or sell recommendation and should not be taken as investment advice.
📌 I am not a SEBI-registered investment advisor.
📌 All views expressed are based on personal study, chart patterns, and publicly available data.
📌 Trading in stocks or options carries risk. Markets can move unexpectedly. Losses can exceed capital.
📌 Past setups do not guarantee future outcomes.
👉 Beginners: Use this for study & paper trading only.
👉 Experienced traders: Apply your own risk management & strategy filters.
👉 Always consult a SEBI-registered financial advisor before real trades.
________________________________________
💬 Found this useful?
🔼 Boost this post to help more traders learn.
✍️ Share your thoughts/setups in comments — let’s grow together.
🔁 Share with fellow traders & learners.
👉 Follow for more clean, structured breakdowns with discipline at the core.
🚀 Stay Calm. Stay Clean. Trade With Patience.
Trade Smart | Learn Zones | Be Self-Reliant 📊
________________________________________

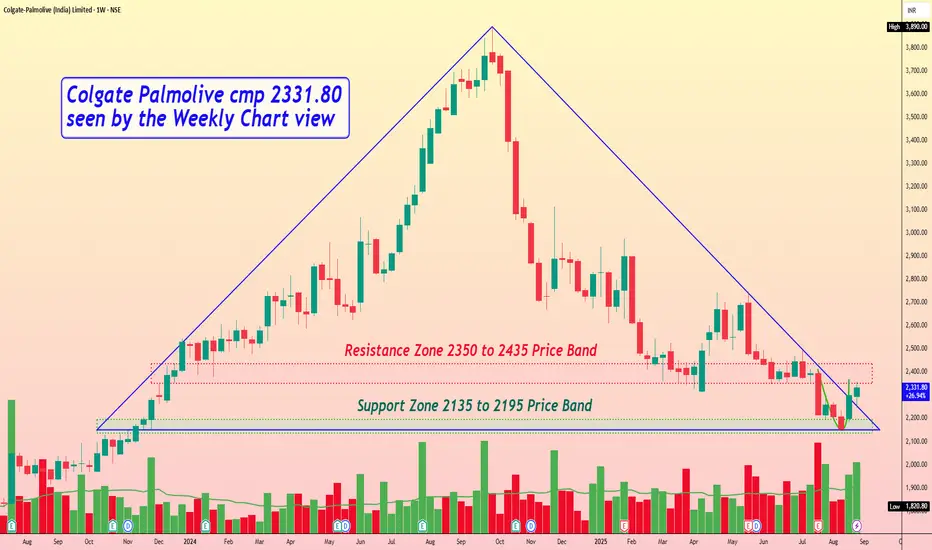
Colgate Palmolive cmp 2331.80 by Weekly Chart viewColgate Palmolive cmp 2331.80 by Weekly Chart view
- Support Zone 2135 to 2195 Price Band
- Resistance Zone 2350 to 2435 Price Band
- Triangle Breakout attempted by current stock chart technical setup
- Support Zone has been under testing retesting phase for the Support Zone
- Bullish Rounding Bottom on Weekly Chart and close Cup & Handle on Daily Chart
- Volumes are seen well in sync with the average quantity traded over the past few weeks
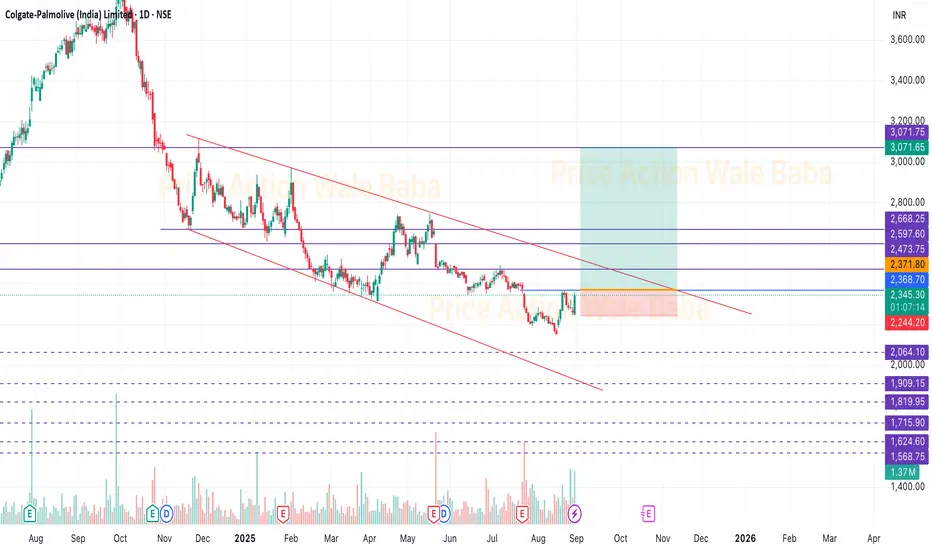
Colpal - Near BreakoutColpal is performing very long consolidation where we can see the breakout on the chart soon.
Above 2370, We can see small upmove till 2420.
Above 2460 we can see targets of 2680-2820-3020 Soon...
Keey buying on every dip and hold for the next 6 months.
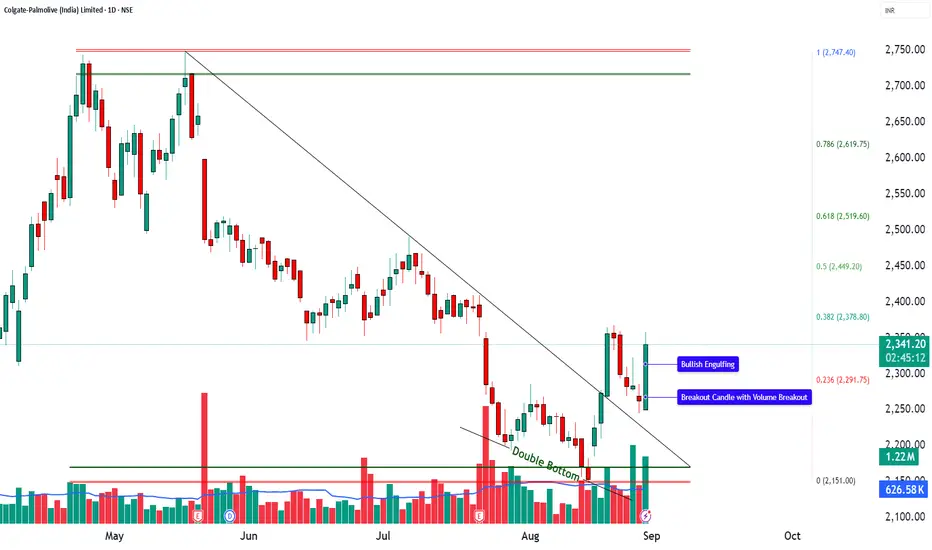
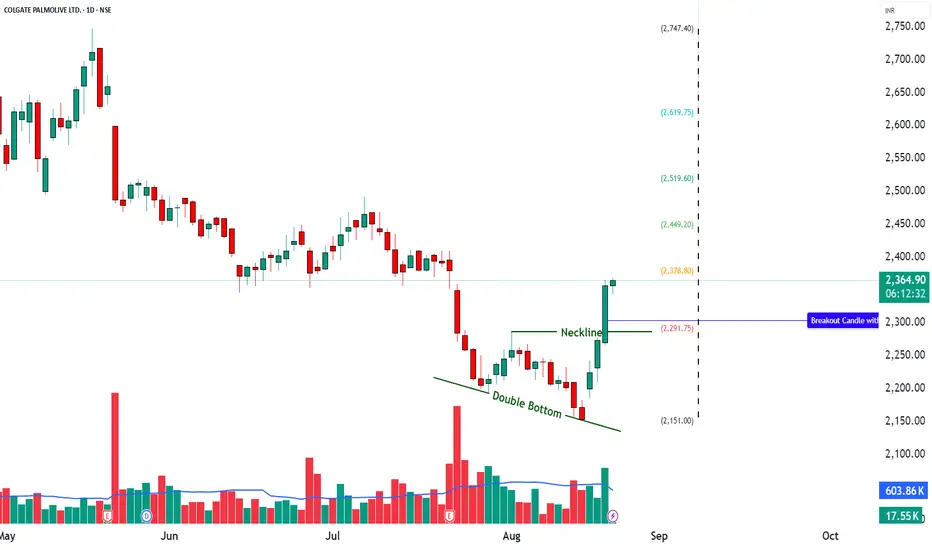
COLPAL | Double Bottom Retest + Volume Breakout🚀 COLPAL | Double Bottom Retest + Volume Breakout
📌 Pattern Setup:
🔹 Double Bottom retest spotted
🔹 Bullish Engulfing candle at support
🔹 Breakout candle with strong volume surge
📊 Technical Snapshot:
RSI: 58 → Healthy momentum
MACD: Bullish crossover
CCI: 107 → Strong positive bias
Stochastic: 89 → Overbought but strong
Volume: 1.22M vs 626k avg → ⚡ Breakout confirmed
🛠 Levels to Watch:
🔼 Long Entry: Above 2357.9
🔽 Stoploss: Below 2243
🎯 Targets: 2472 | 2587
📉 Pullback Buy Zone: 2291–2273
❌ Invalidation: Below 2207
⚡ Resistance Levels: 2382 | 2424 | 2490
⚡ Support Levels: 2274 | 2208 | 2167
🎯 Fibonacci Zones: 2378 → 2449 → 2519 → 2619 → 2747
💡 View:
COLPAL is breaking out from a Double Bottom Retest with strong volume & bullish signals. Sustaining above 2358 could open the gates towards 2472 – 2587 in the short term.
👉 Bias: Bullish till 2207 holds.
⚠️ Disclaimer – Please Read Carefully
The information shared here is meant purely for learning and awareness. It is not a buy or sell recommendation and should not be taken as investment advice. I am not a SEBI-registered investment advisor, and all views expressed are based on personal study, chart patterns, and publicly available market data.
Trading — whether in stocks or options — carries risk. Markets can move unexpectedly, and losses can sometimes exceed the money you have invested. Past performance or past setups do not guarantee future results.
If you are a beginner, treat this as a guide to understand how the market works — practice on paper trades before risking real money. If you are experienced, always assess your own risk, position sizing, and strategy suitability before entering trades.
Consult a SEBI-registered financial advisor before making any real trading decision. By engaging with this content, you acknowledge full responsibility for your trades and investments.
💬 Found this useful?
🔼 Give this post a Boost to help more traders discover clean, structured learning.
✍️ Drop your thoughts, questions, or setups in the comments — let’s grow together!
🔁 Share with fellow traders and beginners to spread awareness.
👉 “If you liked this breakdown, follow for more clean, structured setups with discipline at the core.”
🚀 Stay Calm. Stay Clean. Trade With Patience.
Trade Smart | Learn Zones | Be Self-Reliant 📊
COLPAL - RSI Breakout + Bollinger Band Breakout📊 COLPAL – Technical & Educational Snapshot
Ticker: NSE: COLPAL | Sector: 🪥 FMCG
CMP: ₹ ▲ (as of 20 Aug 2025)
Rating (for learning purpose): ⭐⭐⭐⭐
Pattern Observed: 📈 RSI Breakout + Bollinger Band Breakout
COLPAL is showing strong bullish momentum supported by multiple technical indicators. The presence of a strong bullish candle, along with an RSI breakout at 61, highlights healthy buying pressure. A Bollinger Band breakout and BB Squeeze-Off indicate rising volatility and the possibility of a continuation move. The Bullish SuperTrend adds further confirmation, while momentum indicators (MACD bullish, CCI at 223, Stochastic at 96) signal strong near-term strength.
📊 Momentum Snapshot: Momentum indicators are aligned on the bullish side. While Stochastic shows overbought conditions, strong volume-backed momentum often sustains until key resistance levels are tested.
📊 Volume Check:
🔹 Current Volume: 1.01M
🔹 20SMA Volume: 710.56k ✅
💥 Significantly above average – confirms strong institutional / broad-based buying interest!
💡 Interpretation:
When volume is well above the 20-period average, it strengthens the reliability of a breakout.
It shows that the move is not just retail-driven but likely supported by larger participants.
Breakouts with high volume tend to sustain better compared to low-volume moves.
💡 Learnings:
Breakouts with Bollinger Band expansion often lead to strong follow-through moves.
RSI + MACD confirmation together strengthen trend reliability.
High CCI & Stochastic values show strong momentum but also highlight the importance of monitoring for pullbacks.
Defining pullback and invalidation levels helps in disciplined trade management.
Key Levels:
Resistance: 2393 | 2429 | 2492
Support: 2293 | 2229 | 2193
Pullback Area: 2294
Invalidation Level: Close below 2193
STWP Trade Setup:
Entry (Long): Above 2365
Stop Loss: 2262 or below
Reference Levels: 2467 | 2569
⚠️ Disclaimer – Please Read Carefully
The information shared here is meant purely for learning and awareness. It is not a buy or sell recommendation and should not be taken as investment advice. I am not a SEBI-registered investment advisor, and all views expressed are based on personal study, chart patterns, and publicly available market data.
Trading — whether in stocks or options — carries risk. Markets can move unexpectedly, and losses can sometimes be larger than the money you have invested. Past performance or past setups do not guarantee future results.
If you are a beginner, treat this as a guide to understand how the market works — practice on paper trades before risking real money. If you are an experienced trader, remember to assess your own risk, position sizing, and strategy suitability before entering any trade.
Consult a SEBI-registered financial advisor before making any real trading decision.
By reading, watching, or engaging with this content, you acknowledge that you take full responsibility for your own trades and investments.
💬 Found this useful?
🔼 Give this post a Boost to help more traders discover clean, structured learning.
✍️ Drop your thoughts, questions, or setups in the comments — let’s grow together!
🔁 Share with fellow traders and beginners to spread awareness.
✅ Follow simpletradewithpatience for beginner-friendly setups, price action insights & disciplined trading content.
🚀 Stay Calm. Stay Clean. Trade With Patience.
Trade Smart | Learn Zones | Be Self-Reliant 📊
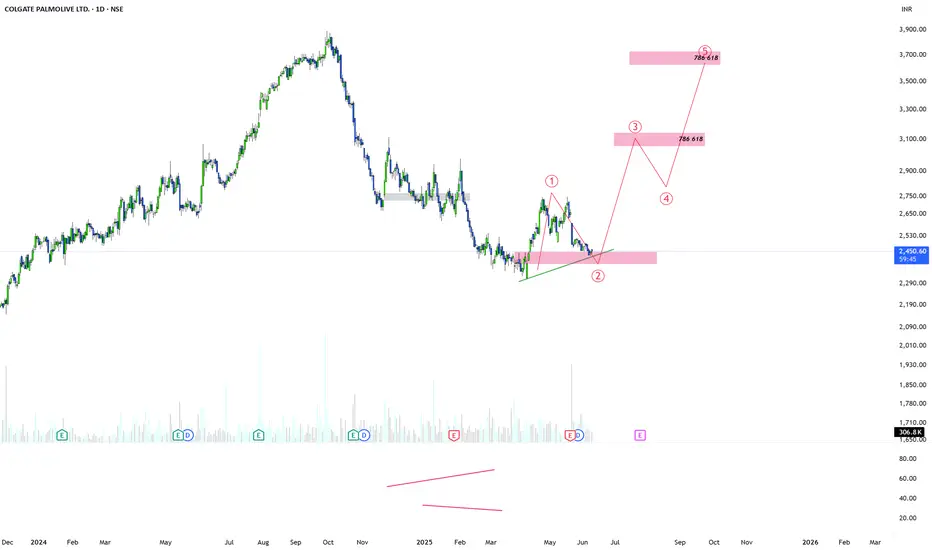
COLPAL: Bringing some PALCOLPAL is in base formation after correcting nearly 40% from the top. Currently it is in wave 2 of 2 and expected to reverse with a big move. RED BOX are the targets and reversal zones.
follow up as per your risk apatite.
NOTE: I'm not a SEBI REG. Study charts before investing.
Bullish Divergence: COLPALThe price is making lower lows, and the RSI is making higher highs, which is a clear bullish divergence. The RSI divergence hints that the sellers are running out of strength. The price action suggests a potential breakout to the upside, but only if the price breaks the resistance trendline with volume and confirmation on a lower time frame by testing this descending trendline as support.
In contrast, the price fails to break the trendline and rolls over again.
In that case, RSI might also get rejected around the midline, and we go back to retest the lows or make new ones.

FMCG Sector in Bearish Grip: Short Sellers Eyes on Colpal◉ FMCG Sector Overview NSE:CNXFMCG
● The Nifty FMCG index appears to be in a bearish phase, having formed a bearish engulfing pattern near a key support level.
● This suggests a potential breach of the support level in the near term.
Given this scenario, there may be an opportunity to consider short positions in select stocks within the sector.
◉ Colgate Palmolive Technical Analysis NSE:COLPAL
● On the weekly chart, Colgate Palmolive has developed a Head and Shoulders pattern, a classic bearish reversal formation.
● The stock is currently hovering near the neckline, and a breach of this level appears imminent, which could signal further downside.
◉ OI Data Analysis
● Open interest analysis reveals, significant long unwinding during the recent trading session, reflecting a shift in investor sentiment toward the negative side. This further supports the bearish outlook for the stock.
● The option chain data indicates that the 2,600 level could act as an immediate support, as it has the highest concentration of put writers. However, if this level is breached, the stock could see additional downward momentum.

Colpal - Weekly EW Analysis - Long Set-upWe are completing some form of correction in a triangle - assuming it to be an ED.
Play for 10% and then trail - could give big returns.

COLPALCOLPAL:
Colgate-Palmolive India Ltd is engaged in manufacturing/ trading of toothpaste, tooth powder, toothbrush, mouthwash and personal care products.
Weekly:
-At major support levels
-Signs of Reversal from major support
-Formation of Double Bottom
Daily:
- Formation of Double Bottom Pattern
-Trendline BO with Breakaway gap
Stock Accumulation levels: 2755-2780
Stop loss: Candle closing below 2680
Note: The above analysis is just for Educational Purpose!

Three White Soldiers | Educational | Colpal The Three White Soldiers candlestick pattern is commonly used in technical analysis.
The pattern identifies potential bullish reversals in a downtrend or a period of consolidation. Traders often use the pattern and other technical analysis tools, such as support and resistance levels, trend lines, and volume indicators, to confirm the trend’s strength and potential entry and exit points.
The Three White Soldiers pattern can be used on various time frames, from short-term intraday charts to longer-term weekly or monthly charts, depending on the trading strategy and goals.
Disclaimer: This is for educational purpose. Definition and details can be found on any other search engine / books/ articles etc.

Colgate Palmolive Colpal On Weekly Demand Zone New Study For Paper Colgate Palmolive Ltd
Buying Zone
2700 50% Qty
2650 Add More 25% qty
2625 Add More 25% qty
StopLoss : 2600
Target : 2960-70, 3200-3400,3800 (Long)
Study Logic
👉 Weekly Demand Zone
#Marker Sentiment Is Weak So Risky Study
Only For Paper Trade And Education Purpose Don't Real Trade
I am not sebi Registered Person Post is only for Paper Trade, Practice And Education purpose i am not responsible for any profit and loss.

COLPAL nearing short support levelsCOLPAL has been continuously falling from quite some time.
It is close to the support levels of 50 percent Fibonacci levels from where the run up started. The 50% levels comes around 2665 which would be a support in this fall.
Currently it is placed at a position where it may bounce from those levels for short term with atleast 9-10 pct move. Levels of resistance from those levels are at 2789-2962
If doesn't sustain, the next level to watch would be the 38% levels.
No recommendations, just my view based on chart pattern.

Colpal -At strong support3600-20 will act as strong support
Possiblity of new ATH in coming weeks
View negated below 3590(Buffer Zone)
R:R favorable near 3610-15

KISS - More than 120% return!! COLPALKISS - Keep It Simple Stupid
COLPAL buy shared on march 4 2022, price was around 1500, since then price has given
MORE THAN 120% RETURN.
Check the investment idea shared earlier -
Below are steps of a simple Trendline strategy-
1. Filter -
a. Stock price less than 5000.
b. Should be liquid(good volume).
2. Time frame - Weekly
3. Find trend of the stock - should be in Up Trend.
4. Check if its following a trendline. Should be at least an year long, longer the better.
5. Check market sentiment - Check trend of Nifty.
Buy if Nifty is in UP or sideways trend. Do not buy if Nifty is in downtrend.
6. BUY - on test of trendline.
Follow strategies that make money even if they seem to be very simple. We are here to make money not to do phd in complex strategies.

Buy Colpage Palmolive Short Term Trading Advice by Goodluck Capital
Buy Colpage Palmolive
Buy Range- 3040 - 3070
Target- 3200 - 3250
StopLoss- below 2950
Potential Return- 5-6%
Approx trade duration 14 - 15 days

COLPAL CUP N HANDLEColgate-Palmolive Company is an American multinational consumer products company headquartered on Park Avenue in Midtown Manhattan, New York City. The company specializes in the production, distribution, and provision of household, health care, personal care, and veterinary products We do see a good breakout as cup n handle pattern.
CMP : 2870 on closes basis
SL 2760
TARGET: 2940 / 3050
Note : This is only for educational purpose

COLPAL - Ichimoku Breakout📈 Stock Name - Colgate Palmolive (india) Limited
🌐 Ichimoku Cloud Setup:
1️⃣ Today's close is above the Conversion Line.
2️⃣ Future Kumo is Turning Bullish.
3️⃣ Chikou span is slanting upwards.
All these parameters are shouting BULLISH at the Current Market Price and even more bullishness anticipated AFTER crossing 2690.
🚨Disclaimer: This is not a Buy or Sell recommendation. It's for educational purposes and a guiding light to learn trading in the market.
#CloudTrading
#IchimokuCloud
#IchimokuFollowers
#Ichimokuexpert
Excited about this analysis? Share your thoughts in the comments below!
👍 Like, Share, and Subscribe for daily market insights! 🚀
#StockAnalysis #MarketWatch #TradingEducation #ichimoku

COLPAL F&P BREAKOUTCOLPAL breaking flag pattern
with good volume
#target 2850
#sl 2500 or follow ur risk appetite
EDUCATIONAL IDEA

Keep An Eye - COLPAL📊 Script: COLPAL
📊 Sector: FMCG
📊 Industry: Personal Care - Multinational
Key highlights: 💡⚡
📈 Script is trading at upper band of BB.
📈 MACD is giving crossover .
📈 Double Moving Averages is giving crossover.
📈 Stock is under Consolidation Zone highlighted into chart breakout is above 2624 level.
📈 Right now RSI is around 60.
📈 One can go for Swing Trade only above 2624.
BUY ONLY ABOVE 2624
⏱️ C.M.P 📑💰- 2606
⚠️ Important: Always maintain your Risk & Reward Ratio.
✅Like and follow to never miss a new idea!✅
Disclaimer: I am not SEBI Registered Advisor. My posts are purely for training and educational purposes.
Eat🍜 Sleep😴 TradingView📈 Repeat 🔁
Happy learning with trading. Cheers!🥂

Colpal Double Top Breakdown: Navigating Short PositionsColpal broke the neckline following the formation of a double top , signaling a potential bearish trend. We've initiated short positions based on this pattern.
Please note, that the provided chart includes details such as entry points, stop-loss levels, re-test zone, and target levels.
However, trading involves risks, and these are speculative predictions. It's crucial to conduct thorough research, consider your risk tolerance, and, if necessary, consult with a financial advisor before making any trading decisions. The market is dynamic, and outcomes may vary. Trade responsibly.
