Commodity Trading: Energy, Metals & Agricultural MarketsCommodity trading involves buying and selling physical goods or their derivative contracts with the objective of profit, hedging risk, or portfolio diversification. Unlike equities (which represent ownership in companies), commodities are tangible assets such as crude oil, gold, wheat, or natural gas. These markets play a critical role in the global economy because commodities are essential inputs for energy production, manufacturing, construction, and food security.
Commodity trading is broadly divided into three major categories:
Energy Commodities
Metal Commodities
Agricultural (Agri) Commodities
Each category has unique drivers, risks, and trading characteristics.
1. Energy Commodity Trading
Energy commodities are among the most actively traded commodities globally. They are highly sensitive to geopolitical events, economic growth, and supply disruptions.
Major Energy Commodities
Crude Oil (WTI & Brent)
Natural Gas
Heating Oil
Gasoline
Coal (limited exchange trading)
Key Market Drivers
Supply & Demand Balance
OPEC+ production decisions
US shale oil output
Refinery capacity
Geopolitical Factors
Middle East tensions
Russia–Ukraine conflict
Sanctions and trade restrictions
Economic Growth
Strong economies increase fuel demand
Recessions reduce consumption
Seasonality
Natural gas demand rises in winter
Gasoline demand peaks during summer travel
Inventory Data
Weekly reports like EIA crude oil inventories
Trading Characteristics
High volatility
Strong trend-following behavior
Heavy participation by institutions, hedge funds, and governments
Prices often react sharply to news and data releases
Trading Instruments
Futures contracts (most common)
Options on futures
Commodity ETFs
CFDs (in some markets)
Energy trading is popular among short-term traders due to sharp intraday movements, but it also attracts hedgers like airlines and oil producers.
2. Metal Commodity Trading
Metals are divided into Precious Metals and Base (Industrial) Metals, each serving different economic purposes.
A. Precious Metals Trading
Major Precious Metals
Gold
Silver
Platinum
Palladium
Key Drivers
Inflation & Interest Rates
Gold performs well during high inflation
Rising interest rates often pressure prices
Currency Movements
Strong US Dollar usually weakens precious metals
Safe-Haven Demand
Economic crises, wars, or market crashes boost demand
Central Bank Buying
Especially important for gold
Trading Characteristics
Gold is relatively less volatile than energy
Silver is more volatile due to industrial usage
Strong correlation with macroeconomic indicators
Gold is often used as a hedge against inflation and currency risk, making it popular with long-term investors as well as traders.
B. Base (Industrial) Metals Trading
Major Base Metals
Copper
Aluminium
Zinc
Nickel
Lead
Key Drivers
Industrial & Infrastructure Demand
Construction
Manufacturing
Electric vehicles and renewable energy
Economic Growth Indicators
GDP growth
PMI data
Supply Constraints
Mining disruptions
Environmental regulations
China’s Demand
China is the largest consumer of base metals
Trading Characteristics
Strongly cyclical
Move with global economic cycles
Copper is often called “Dr. Copper” because it signals economic health
Base metals are ideal for traders who closely follow macro and industrial trends.
3. Agricultural (Agri) Commodity Trading
Agricultural commodities represent soft commodities derived from farming and livestock. These markets are deeply influenced by natural and seasonal factors.
Major Agricultural Commodities
Grains: Wheat, Corn, Rice
Oilseeds: Soybean, Mustard
Softs: Sugar, Coffee, Cotton
Livestock: Live Cattle, Lean Hogs
Key Market Drivers
Weather Conditions
Rainfall, droughts, floods
El Niño and La Niña effects
Crop Reports
USDA acreage and yield reports
Sowing and harvesting data
Seasonality
Planting and harvest cycles
Government Policies
Minimum Support Prices (MSP)
Export/import restrictions
Global Demand
Population growth
Biofuel usage (corn → ethanol)
Trading Characteristics
Often range-bound, except during supply shocks
Highly seasonal
Can experience sudden spikes due to weather news
Agri trading is popular among farmers and food companies for hedging, as well as speculators who understand seasonal cycles.
Commodity Trading Instruments & Markets
Common Trading Instruments
Futures Contracts (primary instrument)
Options on Futures
Spot Markets
ETFs / ETNs
Commodity Mutual Funds
Indian Commodity Exchanges
MCX (Multi Commodity Exchange) – Energy & Metals
NCDEX – Agricultural commodities
Global Commodity Exchanges
CME Group (USA)
LME (London Metal Exchange)
ICE Exchange
Risk Management in Commodity Trading
Commodity markets are volatile, so risk management is critical:
Use stop-loss orders
Proper position sizing
Avoid over-leveraging
Understand contract specifications (lot size, expiry)
Be aware of rollover risks
Professional traders focus more on capital protection than profit chasing.
Advantages of Commodity Trading
Portfolio diversification
Inflation hedge
High liquidity (especially energy & metals)
Opportunities in both rising and falling markets
Risks Involved
High volatility
Leverage risk
Sudden policy or weather-driven shocks
Global geopolitical uncertainty
Conclusion
Commodity trading in Energy, Metals, and Agricultural markets offers diverse opportunities for traders, investors, and hedgers. Energy commodities provide high volatility and strong trends, metals reflect macroeconomic and industrial health, while agricultural commodities are driven by seasonality and weather. Successful commodity trading requires a solid understanding of fundamental drivers, technical analysis, and strict risk management.
When approached with discipline and knowledge, commodities can be a powerful addition to any trading or investment strategy.
Commodities

When Gold ETFs Crash, Psychology Crashes Faster Than Price!Hello Traders!
When Gold ETFs start falling sharply, the damage doesn’t begin on the chart. It begins in the mind. Prices may drop in percentages, but psychology collapses much faster. Confidence disappears, patience breaks, and long-term thinking gets replaced by fear-driven decisions.
Right now, we are in one of those phases. Headlines are loud. Charts look heavy. And emotions are running far ahead of logic. This is where most investors don’t lose money because Gold failed, they lose because their mindset did.
Why Gold ETF Falls Feel More Painful Than Spot Moves
ETF investors experience drawdowns differently. Unlike intraday traders, they are mentally invested for the long term. When price drops suddenly, it shakes belief, not just positions.
Long-term conviction starts feeling shaky
Every red candle feels like a warning sign
Investors start questioning decisions made months or years ago
The fall itself may be normal.
The emotional reaction is usually not.
What Panic Really Looks Like in Gold ETFs
Panic rarely shows up as one big decision. It shows up in small mental cracks.
Checking prices more frequently than usual
Reading every negative headline as confirmation
Comparing current drawdowns with worst-case scenarios
This is how psychology collapses quietly, long before price finds stability.
Why Markets Create This Psychological Pressure
Sharp corrections are not just price adjustments. They are tests of belief. Markets use volatility to separate conviction from convenience.
Weak conviction exits during uncertainty
Strong conviction pauses and reassesses
Impatient money provides liquidity for stability
Gold doesn’t need everyone to believe at the same time.
It needs disagreement to function.
What Smart Investors Focus On During This Phase
Experienced investors don’t react immediately. They zoom out and slow down decision-making.
They separate short-term noise from long-term intent
They revisit why Gold was added to the portfolio
They avoid making decisions during emotional peaks
This phase is not about predicting the bottom.
It’s about protecting mindset.
How I Personally Handle These Phases
When Gold ETFs correct sharply, I don’t rush to act. I observe behaviour, both market behaviour and my own.
I reduce information intake instead of increasing it
I avoid reacting to one-day or one-week moves
I remind myself that volatility is part of long-term assets
Markets recover before confidence does.
And that gap is where mistakes usually happen.
Rahul’s Tip
If a Gold ETF fall is disturbing your peace more than your portfolio balance, step back. Good investments don’t require constant emotional attention. If fear is forcing urgency, the decision is probably premature.
Final Thought
When Gold ETFs crash, price moves fast.
Psychology moves faster.
Those who survive this phase are not the ones who predict perfectly, but the ones who stay emotionally stable while others panic.
If this post reflects what you’re feeling right now, drop a like or share your thoughts in the comments.
More real, market-relevant lessons coming.

Introduction to Agricultural Commodities and SoftsAgricultural commodities are raw materials derived from farming and livestock, forming a critical part of global trade and the commodities market. These commodities are primarily categorized into two groups: hard commodities and soft commodities. While hard commodities include natural resources like metals and energy products, soft commodities refer to agricultural products that are grown rather than mined. These include crops like wheat, corn, soybeans, coffee, sugar, cotton, cocoa, and livestock products such as cattle and hogs.
Soft commodities are essential to the global economy because they are fundamental to human consumption, industrial production, and trade. They are also highly sensitive to factors like weather patterns, seasonal changes, geopolitical events, and technological advancements in agriculture. The trading of these commodities forms a critical part of global commodity markets, with futures contracts, options, and spot trading helping farmers, traders, and investors hedge risks or speculate on price movements.
Classification of Agricultural Commodities
Agricultural commodities can be broadly classified into the following categories:
Grains and Cereals:
These are staple foods consumed globally and include wheat, rice, corn, barley, and oats. Grains are essential for food security and are also used in the production of animal feed, biofuels, and processed food products.
Oilseeds and Legumes:
Soybeans, canola, sunflower seeds, and peanuts are major oilseed crops. They are primarily used for producing vegetable oils and animal feed, as well as for industrial purposes. Legumes like lentils and chickpeas are also traded commodities due to their high nutritional value.
Softs:
Soft commodities refer to crops that are typically grown in tropical or subtropical regions and are not staple grains. These include coffee, cocoa, sugar, cotton, tea, and orange juice. Soft commodities are highly influenced by climatic conditions and are often grown in regions susceptible to political and economic volatility, which can lead to price fluctuations in international markets.
Livestock:
While not “soft” in the classical sense, livestock commodities such as live cattle, feeder cattle, and lean hogs are integral parts of agricultural commodity trading. Prices in livestock markets are influenced by feed costs, disease outbreaks, weather conditions, and consumer demand for meat products.
Key Soft Commodities
Coffee:
Coffee is one of the most widely traded soft commodities globally. Major producers include Brazil, Vietnam, Colombia, and Ethiopia. Coffee prices are influenced by weather patterns, crop diseases (such as coffee leaf rust), labor availability, and global demand. Coffee futures are primarily traded on the Intercontinental Exchange (ICE).
Sugar:
Sugar is produced from sugarcane and sugar beets. Leading producers include Brazil, India, Thailand, and the European Union. Sugar prices fluctuate due to weather conditions, production levels, government policies, and ethanol demand (as sugarcane is also used in ethanol production).
Cocoa:
Cocoa beans are the primary ingredient in chocolate production. West African countries, particularly Ivory Coast and Ghana, dominate cocoa production. Political stability, climate changes, and disease outbreaks in these regions can have a significant impact on global cocoa prices.
Cotton:
Cotton is a key raw material for the textile industry. Major cotton-producing countries include the United States, India, China, and Brazil. Cotton prices are affected by weather conditions, global demand for textiles, and changes in synthetic fiber usage.
Orange Juice:
Primarily produced in Brazil and the United States (Florida), orange juice is traded in futures markets. Weather events such as frost or hurricanes significantly impact the production and price of orange juice.
Tea:
Tea is grown mainly in India, China, Kenya, and Sri Lanka. Prices are influenced by seasonal harvests, global consumption trends, and labor availability in plantations.
Factors Affecting Agricultural Commodities and Softs
Weather and Climate:
Agricultural commodities are extremely sensitive to weather conditions. Droughts, floods, unseasonal rains, and hurricanes can drastically reduce crop yields, leading to price volatility. For example, a drought in Brazil can sharply increase coffee and sugar prices globally.
Supply and Demand:
Basic economics drives commodity prices. An oversupply of crops reduces prices, while a shortage increases them. Factors such as population growth, dietary changes, and biofuel demand can shift demand patterns significantly.
Geopolitical and Economic Events:
Trade policies, tariffs, and sanctions affect commodity prices. For instance, export restrictions by a major producing country can create supply shortages and increase global prices.
Currency Fluctuations:
Since most agricultural commodities are traded internationally in U.S. dollars, changes in currency exchange rates can influence prices. A weaker dollar generally makes commodities cheaper for foreign buyers, potentially boosting demand.
Technological Advancements:
Improvements in farming techniques, irrigation, seed quality, and pest control can increase yields and stabilize prices. Conversely, delays in adopting new technologies may reduce productivity and raise prices.
Speculation and Market Sentiment:
Traders and investors in futures markets play a role in price determination. Speculative buying or selling can amplify price movements, sometimes disconnected from physical supply-demand fundamentals.
Trading and Investment in Agricultural Commodities
Agricultural commodities are actively traded in both physical and financial markets. The physical market involves actual buying and selling of the raw product, while the financial market deals with derivatives like futures and options. Futures contracts are standardized agreements to buy or sell a commodity at a predetermined price on a future date.
Soft commodities are widely traded on global exchanges such as:
ICE (Intercontinental Exchange) – Coffee, cocoa, sugar, and cotton futures.
CME Group – Soybeans, corn, wheat, and livestock futures.
Investors use agricultural commodities for hedging (protecting against price risk) and speculation (profit from price movements). For example, a sugar producer may sell futures contracts to lock in prices, while a trader may buy them anticipating a price rise due to supply concerns.
Economic and Social Importance
Agricultural commodities, especially softs, have immense economic and social significance:
Global Trade:
Soft commodities like coffee, cocoa, and sugar are major export products for developing countries. Their trade generates foreign exchange earnings and supports rural employment.
Food Security:
Cereals and oilseeds are critical for feeding the global population. Price stability in these commodities ensures access to affordable food.
Industrial Use:
Cotton feeds the textile industry, sugar is used in food processing and ethanol production, and soybeans contribute to oils and animal feed.
Inflation Indicator:
Agricultural commodity prices often influence food inflation. Sharp increases in soft commodities can directly impact consumer prices, particularly in developing nations.
Challenges in the Agricultural Commodity Market
Volatility:
Agricultural commodities are inherently volatile due to their sensitivity to unpredictable factors like weather, disease, and geopolitical tensions.
Storage and Transportation:
Unlike metals or oil, agricultural products can be perishable, requiring proper storage and logistics. Inefficiencies can lead to spoilage and losses.
Environmental Concerns:
Intensive farming practices may lead to soil degradation, water scarcity, and deforestation, affecting long-term sustainability.
Policy Dependence:
Government subsidies, import/export restrictions, and trade agreements heavily influence market dynamics, often creating artificial price distortions.
Conclusion
Agricultural commodities and softs form a cornerstone of global trade and economic activity. They are critical for food security, industrial production, and rural livelihoods. Soft commodities like coffee, cocoa, sugar, and cotton, while highly lucrative, are highly sensitive to environmental, economic, and political factors, making them volatile but attractive for traders and investors. Understanding the complex interplay of supply, demand, climate, and market dynamics is essential for anyone participating in these markets.
The ongoing globalization of trade, coupled with advances in agricultural technology and increased investment in commodity markets, continues to shape the future of agricultural commodities. As population growth and changing consumption patterns drive demand, soft commodities will remain a pivotal element of the global economy and financial markets.

Energy Sector Breakouts: A Comprehensive Analysis1. Definition of Breakouts
Breakout Explained:
A breakout occurs when the price of an energy sector stock or index moves above a defined resistance level or below a defined support level with increased volume.
Types of Breakouts:
Bullish Breakout: Price moves above resistance, signaling potential upward momentum.
Bearish Breakout: Price falls below support, signaling potential downward momentum.
Key Elements:
Resistance and support levels
Trading volume confirmation
Price consolidation preceding the breakout
2. Importance of Energy Sector Breakouts
Market Indicator:
Breakouts indicate a shift in supply-demand dynamics, reflecting investor sentiment in the energy markets.
Profit Potential:
Traders can capitalize on strong momentum after breakouts, particularly in volatile energy stocks.
Risk Management:
Identifying breakouts early allows for setting stop-loss levels and avoiding false moves.
Sector Leadership:
Certain energy stocks often lead sector breakouts, influencing indices like the Nifty Energy Index or S&P Energy Sector ETF (XLE).
3. Technical Analysis of Energy Sector Breakouts
Chart Patterns:
Triangles: Ascending triangles often precede bullish breakouts; descending triangles signal bearish potential.
Head and Shoulders: Breakout below the neckline signals a potential decline.
Flags and Pennants: Continuation patterns often indicate that the breakout will follow the existing trend.
Support and Resistance Levels:
Resistance: Previous highs where selling pressure is strong.
Support: Previous lows where buying pressure appears.
Breakout occurs when price decisively crosses these levels.
Volume Analysis:
High trading volume during a breakout confirms legitimacy.
Low volume breakouts often result in false signals, leading to reversals.
Indicators:
Moving Averages: Crossovers (e.g., 50-day MA crossing above 200-day MA) can reinforce breakout signals.
Relative Strength Index (RSI): Values above 70 can indicate overbought conditions; below 30 indicates oversold, helpful to gauge breakout sustainability.
MACD (Moving Average Convergence Divergence): Bullish or bearish crossovers can complement breakout analysis.
4. Fundamental Drivers of Energy Sector Breakouts
Oil and Gas Prices:
Fluctuations in crude oil and natural gas prices heavily influence energy stocks. Rising prices often trigger bullish breakouts.
Energy Demand and Supply:
Seasonal demand changes (e.g., winter heating, summer cooling) can affect utilities and energy producers.
Geopolitical tensions or supply disruptions (OPEC decisions, sanctions) can spark breakouts.
Policy and Regulation:
Renewable energy incentives, carbon pricing, and subsidies can drive sector valuations and breakout trends.
Deregulation or privatization in power and utilities can lead to bullish momentum.
Corporate Earnings:
Strong quarterly results, production reports, or new project announcements often catalyze breakouts.
5. Market Sentiment and Energy Sector Breakouts
Investor Confidence:
Optimism about economic growth, industrial activity, and energy demand can lead to bullish breakouts.
Fear and Panic Selling:
Bearish breakouts are often driven by negative news, profit warnings, or declining energy prices.
Global Events:
Wars, conflicts, or global policy decisions (like climate agreements) can influence breakout trends.
6. Breakout Strategies for Traders
Entry Points:
Enter near the breakout above resistance or below support after volume confirmation.
Avoid premature entries during consolidation phases.
Stop-Loss Placement:
Place stop-loss just below the breakout point for bullish trades or above for bearish trades.
Helps minimize losses in case of false breakouts.
Target Setting:
Measure the height of the prior consolidation range and project it from the breakout point to estimate potential targets.
Risk Management:
Trade smaller positions in volatile energy stocks.
Combine technical breakout signals with macro and fundamental analysis.
7. Examples of Energy Sector Breakouts
Oil & Gas Companies:
Bullish breakout after crude oil prices surge due to geopolitical tensions.
Bearish breakout during oversupply or production increases.
Renewable Energy:
Stocks break out on government subsidy announcements or major solar/wind project approvals.
Utilities:
Breakouts often occur around regulatory changes, tariff revisions, or quarterly performance updates.
8. Common Challenges in Energy Sector Breakouts
False Breakouts:
Price briefly moves past resistance/support but returns, trapping traders.
Avoid by confirming with volume and technical indicators.
Volatility:
Energy markets are prone to high volatility due to global oil prices, weather events, and geopolitical risks.
News Sensitivity:
Sudden policy changes, sanctions, or natural disasters can invalidate technical setups.
9. Sector-Specific Considerations
Oil & Gas:
Highly correlated with crude oil futures.
Watch OPEC meetings, inventory reports, and geopolitical news.
Renewable Energy:
Sensitive to government policies, subsidies, and technological advancements.
Breakouts often occur with announcements of new projects or partnerships.
Power & Utilities:
Influenced by regulatory frameworks, tariffs, and infrastructure investments.
Breakouts may be slower but more sustainable due to stable demand.
10. Tools and Resources for Identifying Breakouts
Technical Platforms:
TradingView, MetaTrader, and NSE/BSE charting platforms.
Market News Feeds:
Bloomberg, Reuters, and industry-specific news portals.
Government & Policy Reports:
Energy Ministry releases, OPEC reports, renewable energy agencies.
Algorithmic Alerts:
Use automated tools to get breakout alerts based on predefined technical conditions.
11. Conclusion
Energy sector breakouts offer significant trading and investment opportunities, but they require careful analysis.
A successful approach combines technical patterns, volume confirmation, fundamental drivers, and market sentiment.
Traders must be vigilant about false breakouts, high volatility, and sector-specific nuances.
Long-term investors can benefit by linking breakouts with macroeconomic trends and structural shifts in energy demand.
The energy sector remains dynamic, and breakouts often precede strong trends, making them an essential tool for market participants.
✅ Key Takeaways:
Breakouts signal shifts in momentum; confirmation by volume is critical.
Technical patterns, support/resistance, and indicators provide actionable insights.
Fundamental factors (oil prices, demand, policy) often drive sector breakouts.
False breakouts are common; risk management and stop-losses are essential.
Energy sector breakouts are highly sensitive to global events and sentiment.

Why breakout entries fail (and how I wait for confirmation)Most breakout losses happen because entries are too early.
Instead of chasing the breakout, I wait for:
1) A clearly defined range
2) A clean breakout
3) Pullback / acceptance into the range
4) Continuation confirmation
This simple framework helps avoid fake moves and improves risk–reward.
I later automated this process into a private tool to remove subjectivity,
but the logic itself is what matters most.
This chart shows one example on XAUUSD using a higher timeframe.

GOLD/SILVER RatioChart is self explanatory. The price of the TVC:GOLD/TVC:SILVER ratio (XAU/XAG) as of January 1, 2026, is approximately 60.71. This indicates that one ounce of gold is worth roughly 60.71 ounces of silver. Over the past year, the ratio has seen a significant change, trading within a 52-week range of 54.19 to 107.27.
Recent trends
* Market Sentiment and Economic Conditions: When economic uncertainty is high, investors typically flock to gold as a safe-haven asset, which widens the ratio (increases the number).
* Industrial Demand for Silver: Silver has significant industrial applications (electronics, solar panels), so its price often correlates with economic growth and industrial demand, which can narrow the ratio.
* Relative Volatility: Silver is generally more volatile than gold ("high-beta" version of gold); in a bull market for precious metals, silver prices tend to rise faster, lowering the ratio, while in a bear market, gold prices tend to hold up better, increasing the ratio.
Key Insights
* Ratio Fluctuation: The gold-silver ratio is highly volatile. Historically, the all-time high was 125:1 in April 2020.
* Recent Volatility: Both gold and silver have experienced significant price movements in 2025, driven by factors such as interest rate expectations, geopolitical tensions, and industrial demand for silver.
* Price Influences: Domestic gold and silver prices in India are influenced by international market trends, currency exchange rates, local demand, taxes, and import duties.
Gold-Silver Ratio and Future Price Predictions
The gold-silver ratio (calculated by dividing the gold price by the silver price) indicates which metal may be undervalued or overvalued compared to the other and helps anticipate potential out performance.
* High Ratio (e.g., above 80:1 or 90:1): Historically suggests that silver is undervalued relative to gold. This often signals a potential buying opportunity for silver, with expectations that silver's price may rise faster than gold's, causing the ratio to decrease (revert to its mean). A high ratio can also indicate economic uncertainty or a flight to gold's safe-haven appeal.
* Low Ratio (e.g., below 50:1 or 60:1): Historically suggests that silver is overvalued relative to gold. This may signal a potential buying opportunity for gold, with expectations that gold may outperform silver, causing the ratio to increase. A low ratio often coincides with periods of economic optimism and stronger industrial demand for silver.
Current Market Insights
As of late December 2025/early January 2026, the gold-silver ratio has recently fluctuated, with reports placing it around 60.53 to 64:1, down from highs earlier in 2025 that exceeded 100:1. The sharp drop in the ratio during 2025 signaled a strong out performance by silver.
* Silver Out performance Expected: Many analysts believe silver is still cheap relative to its long-term historical average ratio (around 40-60:1 or 60-80:1) and could continue to outperform gold.
* Key Drivers: Silver's strong industrial demand (especially in solar panels and electronics), coupled with persistent supply deficits, provides fundamental support for its price to potentially reach higher levels like $85-$100 per ounce in the medium to long term.
* Volatility and Risk: Silver is generally more volatile than gold, which means it has the potential for higher percentage gains but also larger pullbacks. Investors use the ratio as one of several tools to balance their portfolios, rather than relying on it as a sole predictor.
Disclaimer: This is for demonstration and educational purpose only. This is not buying or selling recommendations. I am not SEBI registered. Please consult your financial advisor before taking any trade.

Why Gold Behaves Differently During Christmas Week – A Lesson!Hello Traders!
If you have traded gold for a few years, you might have noticed something strange around Christmas week.
Your usual setups feel different. Levels don’t react the same way. Moves look random, slow, or suddenly sharp without logic. This is not because your analysis stopped working.
Gold behaves differently during Christmas week because liquidity behaves differently.
Understanding this one concept can save you from unnecessary losses.
What Changes in the Market During Christmas Week
During Christmas week, a large part of institutional traders, banks, and big market participants are either inactive or trading with very light exposure. Volumes drop significantly, and participation becomes uneven.
When fewer large players are active, the market structure changes. Gold still moves, but the quality of moves changes.
I’ve learned to treat this week very differently from normal trading weeks.
Why Low Liquidity Changes Gold’s Behavior
Gold is a highly liquid instrument most of the year, but during holiday weeks, especially Christmas, liquidity becomes thin.
With thin liquidity:
Small orders can move price more than usual
False breakouts become more frequent
Clean follow-through after breakouts reduces
Price starts reacting more to random flows than to strong conviction.
The Common Trap Retail Traders Fall Into
Most retail traders trade Christmas week exactly like any other week. They expect normal volatility, normal reactions, and normal continuation.
What actually happens is different.
Price spikes suddenly, hits stops easily, and then goes quiet again. This creates frustration and confusion, especially for intraday and scalping traders.
I’ve personally learned this the hard way earlier in my trading journey.
Why Gold Can Look “Manipulated” During Holidays
When liquidity is low, price movements feel exaggerated. Stops get hit easily, wicks become longer, and reversals appear sudden.
This makes traders feel like gold is being manipulated.
In reality, it is not manipulation, it is absence of depth. When the market lacks depth, price becomes sensitive.
How I Personally Trade Gold During Christmas Week
Over time, I changed my approach completely for holiday periods.
I reduce position size significantly, even if my analysis is strong.
I avoid aggressive intraday trades and prefer higher timeframe context.
I accept that missing trades is better than forcing trades during low liquidity.
Sometimes, the best trade during Christmas week is no trade.
Why Patience Matters More Than Prediction Here
During Christmas week, prediction matters less than protection. Even correct analysis can fail due to lack of participation.
Gold may move, but moves are often unreliable and short lived. This is where discipline protects capital.
I remind myself every year, markets will still be there next week.
Rahul’s Tip
If gold starts behaving strangely during Christmas week, don’t doubt yourself immediately.
Check liquidity first. Reduce size, reduce expectations, or step aside completely.
Preserving capital during low-quality conditions is also a skill.
Conclusion
Gold does not change its nature during Christmas week. Liquidity changes, and gold simply reacts to that.
When you understand how liquidity affects behavior, you stop forcing trades and start respecting the environment.
If this post helped you understand holiday trading better, like it, share your experience in the comments, and follow for more practical gold trading insights. Happy Merry Christmas to all from @TraderRahulPal :))

Gold Trading Psychology: Right Analysis, Wrong Position SizeHello Traders!
Over the years, I’ve noticed something very common in gold trading.
Most traders are not wrong in their analysis. In fact, many of them read gold levels, structure, and direction almost perfectly. The problem usually starts after the entry, not before it.
The trade fails not because the idea was wrong, but because the position size was too big to handle emotionally.
This is one of the most silent killers in gold trading.
Why Gold Punishes Position Size Mistakes
Gold is not a slow-moving instrument. Even during normal market conditions, it can move sharply within minutes. When your position size is larger than what your mind can comfortably handle, every small pullback starts feeling like a threat.
Instead of calmly following your plan, your focus shifts from structure to P&L.
At that moment, psychology takes over logic, and the trade usually ends badly, even if price later moves exactly as you expected.
What Actually Happens Inside the Trader’s Mind
This is something I’ve personally experienced earlier in my journey.
You enter a gold trade with confidence because your analysis is clear.
Price moves slightly against you, which is completely normal.
But because the position size is heavy, your heartbeat increases, your screen gets more attention than it deserves, and suddenly you are no longer reading price, you are reading fear.
Stops get adjusted, exits get rushed, and discipline quietly disappears.
Why Traders Oversize Gold Positions
Many traders oversize gold because it feels familiar and liquid. Some do it because gold has given quick profits in the past, creating overconfidence. Others do it subconsciously to recover previous losses faster.
But gold does not reward emotional urgency.
It only rewards patience, structure, and controlled risk.
How I Corrected This Mistake in My Own Trading
The biggest improvement in my gold trading came when I stopped thinking in terms of lots and started thinking in terms of mental comfort.
I began sizing my trades in a way where even if the stop loss was hit, it would not disturb my mindset or decision-making. Once I did that, something interesting happened, my execution improved automatically.
Same charts.
Same analysis.
Very different results.
The Real Secret Behind Consistency in Gold
Consistency in gold does not come from predicting every move correctly.
It comes from staying calm while the move is developing.
And calmness is impossible if your position size is forcing you to watch every tick.
If you cannot hold the trade without stress, the size is wrong, no matter how good the setup looks.
Rahul’s Tip
Before placing any gold trade, ask yourself honestly:
“Can I hold this position calmly if gold moves against me first?”
If the answer is no, reduce the size. Protecting your mindset is more important than chasing profits.
Conclusion
Many traders lose money in gold despite having good analysis.
The real issue is not strategy, indicator, or entry timing.
Right analysis with wrong position size will still lead to losses.
But average analysis with correct sizing can build long-term consistency.
If this post felt relatable, like it, share your experience in the comments, and follow for more real gold trading psychology.

Why Gold Spikes Right When Everyone Gives Up!Hello Traders!
Over the years, one thing I’ve noticed again and again is this, gold rarely moves when everyone is confident about it.
In fact, the strongest gold spikes I’ve seen came at moments when traders were tired, bored, and emotionally done with gold.
No excitement, no news, no hype. just silence and frustration. That is usually when gold decides to move. This post is about that exact moment most people miss.
1. The Phase Where Traders Emotionally Disconnect
After a long consolidation or slow decline, gold starts testing patience more than levels.
Daily candles become small, nothing seems to work, and traders slowly stop caring.
People say things like “gold is not moving” or “nothing is happening here” and shift their attention elsewhere.
I’ve personally learned to be very alert during this phase.
When traders disconnect emotionally, the market often prepares its next move.
2. Giving Up Is Not Random, It Is a Signal
When traders finally give up, they close positions without a plan, just to feel relief.
This creates a wave of selling from weak hands.
That selling provides clean liquidity for stronger participants to step in quietly.
Gold does not spike because something suddenly improves.
It spikes because selling pressure gets exhausted.
3. Why Gold Loves Emotional Extremes
Gold is not driven only by fundamentals, it is heavily driven by emotion and sentiment.
Fear pushes people into gold, boredom pushes them out.
When boredom and frustration peak, price often stops falling even though sentiment stays negative.
Whenever I see gold refusing to go lower despite bad sentiment,
I know the story is changing under the surface.
4. What Retail Traders Usually Do at This Point
Most retail traders stop watching gold charts completely.
They move to faster markets or trending assets.
They tell themselves they will come back “once gold starts moving again”.
Ironically, by the time gold starts moving, it is already far from the level where patience was required.
5. How I Personally Read These Gold Spikes
I focus more on behavior than prediction.
I look for long periods where price goes nowhere but also refuses to break down.
I pay close attention when volatility compresses and volume dries up.
When price holds steady while emotions collapse,
I don’t rush, I observe.
That calm observation has helped me catch moves that looked sudden to everyone else.
6. The Spike Feels Sudden Only If You Were Not Prepared
By the time gold spikes, accumulation is usually already complete.
To emotional traders, the move feels random and unfair.
To prepared traders, it feels logical and almost expected.
Big moves never announce themselves loudly.
They quietly prepare while most people lose interest.
Rahul’s Tip
Whenever I feel bored or frustrated watching gold, I pause instead of walking away.
That emotional discomfort is often a signal, not a problem.
If you can stay present when others disconnect, you automatically gain an edge.
Conclusion
Gold rarely spikes when belief is strong. It spikes when patience is gone and hope feels weak.
If you understand this emotional timing, you stop chasing gold and start positioning before it moves.
If this post felt relatable, like it, share your experience in the comments, and follow for more market psychology insights.

How Emotions Destroy Profitable TradersHow Emotions Destroy Profitable Traders
🧠 How Emotions Destroy Profitable Traders | Trading Psychology Explained
Most traders don’t fail because of strategy.
They fail because they can’t control emotions.
Even a profitable system becomes useless when emotions take control of decision-making. Let’s break it down 👇
😨 Fear: The Profit Killer
Fear appears after losses or during volatility.
What fear causes:
Closing trades too early
Missing high-probability setups
Moving stop losses emotionally
📉 Result: Small wins, big regrets.
Fear stops traders from letting probabilities play out.
😤 Greed: The Account Destroyer
Greed appears after wins.
What greed causes:
Overleveraging
Ignoring risk management
Holding trades too long
📈 Traders want “more” and end up losing everything.
Greed turns discipline into gambling.
😡 Revenge Trading: The Fastest Way to Blow an Account
After a loss, many traders try to win it back quickly.
Revenge trading leads to:
Random entries
No confirmations
Breaking trading rules
🔥 One emotional trade often leads to many bad trades.
🤯 Overconfidence After Wins
Winning streaks create false confidence.
Overconfidence causes:
Larger position sizes
Ignoring market context
Believing losses “won’t happen”
Markets punish ego — always.
😴 Impatience: Silent Consistency Killer
Good trades require waiting.
Impatience leads to:
Forcing setups
Trading low-quality zones
Entering without confirmation
⏳ The market rewards patience, not speed.
🧘♂️ How Profitable Traders Control Emotions
Professional traders don’t eliminate emotions — they manage them.
Key habits:
Fixed risk per trade
Pre-planned entries & exits
Accepting losses as part of business
Waiting for confirmation
Trading less, not more
🧠 Discipline > Emotion
📊 Process > Outcome
📌 Final Thought
If emotions control your trades, the market will control your money.
Master your psychology, and your strategy will finally work.
Trade the plan.
Respect risk.
Stay patient.

Why Gold Hits Your SL🌟 Why Gold Hits Your SL 😭💛📈
Gold is one of the most aggressive and volatile assets in the market — and if you’ve ever wondered “Why does gold ALWAYS hit my stop-loss before moving in my direction?”, this post explains the real reason.
Let’s break it down clearly 👇
🔶 1. Gold Loves Liquidity — Not Levels 💦💰
Gold doesn’t move based on your support/resistance lines.
It moves based on liquidity, meaning:
Where traders place stop-losses ❌
Where pending orders sit 🎯
Where large institutions want to fill positions 🏦
Your SL is simply sitting where everyone else puts theirs, which makes it prime liquidity.
🔶 2. XAUUSD Spikes Are Designed to Collect Orders ⚡💥
Gold often creates sudden:
Wicks
Fake breakouts
Quick pumps or dumps
Sharp candle spikes
These moves are NOT random — they’re engineered to:
🔸 Trigger stop-losses
🔸 Activate pending buy/sell orders
🔸 Grab liquidity before the real move
This is why your SL gets hit by $1–$3 before price completely reverses.
🔶 3. Gold Moves Session-by-Session 🕒🌍
Gold behaves differently depending on the time of day:
Asia session → Slow, tight range
London session → First big manipulation
New York session → Volatility explosion + real direction
Most SL hunts take place when London opens or when NY session begins ⚠️🔥
🔶 4. Clean Highs & Lows = SL Magnets 🧲📌
Gold LOVES attacking:
Previous day’s high/low
Asian range high/low
London session extremes
Double tops & bottoms
Round numbers (like 4000 / 4050 / 4100)
These areas hold thousands of stop-losses.
So before gold takes a real direction — it sweeps them first. 🏹😈
🔶 5. The Classic Gold Pattern: Trap → Reversal → Expansion 🔁🚀
Most XAUUSD moves follow this sequence:
1️⃣ Sweep liquidity 😭
2️⃣ Fake breakout 😈
3️⃣ Sharp rejection 👋
4️⃣ Real trend begins 🚀
If you’ve ever seen price:
Break a level
Wick hard
Then reverse the entire move
That’s gold performing a liquidity grab.
🔶 6. How To Avoid Getting Stopped Out ✔️
Here’s what actually helps:
🌟 A. Don’t put SL exactly at obvious levels
Move it beyond common liquidity zones.
🌟 B. Wait for the sweep before entering
Let gold perform the trap first.
🌟 C. Trade reaction — not prediction
Look for re-entry after the wick forms.
🌟 D. Use sessions to your advantage
Avoid placing SL right before London/NY opens.
🌟 Final Words
Gold isn’t hunting you —
it’s hunting liquidity.
Your job is simple:
👉 Stop placing stops where everyone else does
👉 Let gold sweep liquidity first
👉 Then catch the real move
Trade smarter, not tighter. 💛⚡

Introduction to MCX Commodity Trading1. What is Commodity Trading?
Commodity trading refers to the buying and selling of raw materials or primary products, typically classified into two broad categories:
Hard Commodities: Natural resources that are mined or extracted, such as gold, silver, crude oil, and copper.
Soft Commodities: Agricultural products or livestock, including sugar, cotton, wheat, and coffee.
Unlike equities, commodities are traded for their intrinsic value and are influenced by supply-demand dynamics, geopolitical factors, and global economic trends. Trading commodities allows investors not only to profit from price movements but also to hedge against inflation and currency fluctuations.
2. Overview of MCX (Multi Commodity Exchange)
The Multi Commodity Exchange of India Limited (MCX) is the largest commodity derivatives exchange in India. Established in 2003, MCX provides a platform for trading commodity futures, ensuring transparency, liquidity, and regulatory oversight. Key features of MCX include:
Diverse Commodity Offerings: MCX trades in bullion, metals, energy, and agricultural commodities.
Futures Contracts: Investors primarily trade in futures contracts, which are standardized agreements to buy or sell a specific quantity of a commodity at a predetermined price on a future date.
Regulated Environment: MCX is regulated by the Securities and Exchange Board of India (SEBI), ensuring market integrity and investor protection.
Efficient Settlement System: MCX employs secure clearing and settlement mechanisms, reducing counterparty risk.
By providing a robust marketplace, MCX has played a critical role in bringing Indian commodity trading in line with global standards.
3. Understanding Commodity Futures
Unlike spot trading, where commodities are bought or sold for immediate delivery, futures contracts allow traders to speculate on price movements without necessarily owning the physical commodity. Key components of a futures contract include:
Contract Size: Defines the quantity of the commodity covered.
Expiry Date: The date on which the contract is settled.
Lot Size: Standardized unit of trading to maintain market uniformity.
Margin Requirement: Traders must deposit a percentage of the contract value as margin, which ensures commitment and reduces default risk.
Example:
If a trader buys a gold futures contract at ₹50,000 per 10 grams for delivery in June, the trader is obligated to purchase 10 grams of gold at that price in June. However, most traders close their positions before expiry to avoid physical delivery.
4. Categories of Commodities on MCX
MCX offers trading in several categories:
4.1 Bullion
Gold and Silver are the most traded commodities.
Prices are influenced by global demand, currency fluctuations, inflation, and geopolitical tensions.
4.2 Base Metals
Commodities such as copper, aluminum, zinc, and nickel.
Prices are affected by industrial demand, mining output, and global economic conditions.
4.3 Energy
Includes crude oil, natural gas, and other petroleum products.
Heavily influenced by global supply-demand, OPEC policies, and geopolitical factors.
4.4 Agricultural Commodities
Examples: Cotton, cardamom, chana, and sugar.
Influenced by monsoon patterns, crop yields, government policies, and international trade.
5. Participants in MCX Commodity Trading
Understanding the key players helps in interpreting market movements:
Hedgers: Typically producers or consumers of commodities who aim to reduce the risk of price fluctuations.
Example: A gold jeweler hedging against rising gold prices.
Speculators: Traders who seek to profit from price changes without intending to take physical delivery.
Arbitrageurs: Exploit price differences between commodities on different exchanges or in spot versus futures markets.
Institutional Investors: Banks, mutual funds, and hedge funds often participate to diversify portfolios.
6. Advantages of Trading on MCX
Trading on MCX provides multiple benefits:
Transparency: Prices and volumes are publicly available, reducing market manipulation.
Liquidity: High trading volumes make entering and exiting positions easier.
Hedging Opportunities: Producers and consumers can lock in prices, mitigating risk.
Leverage: Traders can control large contract values with relatively small margin deposits.
Diversification: Exposure to commodities reduces portfolio dependency on equities and bonds.
Price Discovery: MCX plays a key role in determining fair market prices through supply-demand mechanisms.
7. Risks in Commodity Trading
Despite its opportunities, commodity trading involves significant risks:
Market Risk: Prices can fluctuate sharply due to global events, weather, or policy changes.
Leverage Risk: While margin trading amplifies profits, it also magnifies losses.
Liquidity Risk: Some commodities may have lower trading volumes, making it difficult to exit positions.
Regulatory Risk: Changes in government policies, taxes, or import/export duties can impact prices.
Operational Risk: Technical glitches, delays, or errors in trading platforms may affect execution.
A prudent trader combines technical, fundamental, and geopolitical analysis to navigate these risks.
8. How to Start Trading on MCX
Step 1: Open a Trading Account
Investors need to open a commodity trading account with a registered broker. Required documents include PAN card, Aadhaar, bank proof, and KYC verification.
Step 2: Choose Commodities
Select commodities based on market research, risk appetite, and trading strategies.
Step 3: Deposit Margin
A minimum margin, defined as a percentage of the contract value, must be deposited to initiate trades.
Step 4: Place Orders
Orders can be placed using online trading platforms, specifying the quantity, contract month, and price.
Step 5: Monitor Positions
Regularly track market movements, news, and global events that influence commodity prices.
Step 6: Close Positions
Traders can either settle at contract expiry or close positions early to book profits or limit losses.
9. Trading Strategies for MCX Commodities
Successful trading involves strategy and discipline. Common approaches include:
9.1 Technical Analysis
Uses historical price patterns, charts, and indicators like moving averages, RSI, and MACD.
Helps identify entry and exit points.
9.2 Fundamental Analysis
Examines supply-demand factors, geopolitical events, government policies, and global trends.
Particularly important for agricultural commodities and energy markets.
9.3 Hedging
Aims to minimize potential losses for businesses exposed to commodity price fluctuations.
Example: A farmer selling wheat futures to secure prices before harvest.
9.4 Arbitrage
Exploits price differences between spot and futures markets or across exchanges.
Requires quick execution and access to multiple trading venues.
10. Factors Influencing Commodity Prices
Commodity prices are driven by multiple interrelated factors:
Global Economic Conditions: Growth or slowdown impacts industrial metals, energy, and demand for commodities.
Currency Movements: Commodities priced in USD are sensitive to exchange rate fluctuations.
Geopolitical Events: Wars, sanctions, and political instability can create volatility.
Weather and Climate: Agricultural commodities are heavily dependent on rainfall, monsoons, and climate change.
Government Policies: Subsidies, import/export restrictions, and price controls affect domestic prices.
Market Speculation: Traders’ sentiment and speculative positions can influence short-term price movements.
11. Regulatory Framework
MCX operates under SEBI regulations and follows strict compliance norms:
Position Limits: Prevent market manipulation by limiting maximum allowable contracts.
Margin Requirements: Ensure traders have sufficient funds to cover potential losses.
Contract Specifications: Standardize trading to maintain uniformity.
Dispute Resolution: Provides mechanisms for grievances and market disputes.
This robust framework enhances investor confidence and promotes fair trading.
12. Technology in MCX Trading
Modern commodity trading relies heavily on technology:
Online Trading Platforms: Allow seamless access to live market data and order execution.
Algorithmic Trading: High-frequency and automated trading based on pre-set rules.
Risk Management Systems: Track margin requirements, position limits, and real-time exposure.
Mobile Applications: Provide flexibility to trade and monitor positions on the go.
Technology has made MCX accessible to both retail and institutional traders.
13. Conclusion
MCX commodity trading offers an exciting avenue for diversification, profit-making, and hedging against market uncertainties. By understanding the nuances of futures contracts, market dynamics, and trading strategies, investors can navigate the complex world of commodities effectively. While risks exist, informed decision-making, disciplined strategies, and continuous learning can make commodity trading a rewarding endeavor.
For beginners, it is recommended to start with smaller positions, focus on learning market patterns, and gradually expand exposure. For professionals, leveraging advanced analytical tools and global insights can enhance profitability. Ultimately, MCX trading embodies a blend of knowledge, strategy, and market acumen, opening doors to opportunities that extend beyond traditional investment avenues.
Policy Developments in Derivatives and Commodities MarketsIntroduction
The derivatives and commodities markets are critical components of the global financial system. They provide essential tools for risk management, price discovery, and investment diversification. Derivatives—contracts whose value derives from underlying assets like commodities, equities, or currencies—enable participants to hedge against price volatility. Commodities markets, on the other hand, facilitate trading in raw materials such as oil, metals, and agricultural products.
Over the past few decades, these markets have witnessed significant evolution in both their structure and regulatory frameworks. Policymakers and regulatory authorities across the globe have introduced reforms to enhance transparency, reduce systemic risk, and promote market efficiency. These policy developments have become increasingly important in light of financial crises, technological advancements, globalization of markets, and growing participation from retail investors.
1. Historical Context of Derivatives and Commodities Regulation
The regulation of derivatives and commodities markets has evolved in response to market crises and structural changes. Historically, commodities trading, especially in agricultural products, was lightly regulated, primarily aimed at preventing fraud and market manipulation. In contrast, modern derivative markets grew exponentially in the 1980s and 1990s with the rise of financial engineering and complex instruments like options, swaps, and futures.
Major events that shaped policy include:
The 1987 Stock Market Crash: Highlighted the need for robust oversight of derivative instruments and their impact on financial markets.
The 2008 Global Financial Crisis: Exposed systemic risks inherent in over-the-counter (OTC) derivatives markets, prompting regulators to focus on transparency, collateralization, and centralized clearing mechanisms.
Commodity Price Volatility: Sharp swings in oil, metals, and agricultural products prices led to government interventions to stabilize markets, protect consumers, and ensure fair trading practices.
These events underscored the importance of developing robust regulatory frameworks to safeguard market integrity while fostering innovation.
2. Objectives of Policy Developments
Regulatory policies in derivatives and commodities markets aim to achieve several key objectives:
Market Integrity: Preventing manipulation, insider trading, and fraudulent practices.
Transparency: Ensuring that market participants have access to accurate and timely information about prices, trading volumes, and open positions.
Financial Stability: Reducing systemic risk that arises from excessive leverage, interconnected financial institutions, and OTC derivatives exposures.
Consumer Protection: Safeguarding investors, particularly retail participants, from misleading practices or excessive risk exposure.
Promotion of Market Efficiency: Ensuring smooth price discovery and liquidity in the markets.
Alignment with International Standards: Harmonizing domestic regulations with global best practices set by organizations such as the International Organization of Securities Commissions (IOSCO) and the Financial Stability Board (FSB).
3. Key Policy Developments in Derivatives Markets
3.1 Introduction of Central Clearing
One of the most significant reforms after the 2008 financial crisis was the push for central clearing of standardized OTC derivatives. Central counterparties (CCPs) act as intermediaries between buyers and sellers, reducing counterparty risk. Regulatory frameworks such as Dodd-Frank Act (USA, 2010) and the European Market Infrastructure Regulation (EMIR, EU, 2012) mandated clearing of certain interest rate and credit derivatives through CCPs.
Impact:
Reduced systemic risk from bilateral exposures.
Standardized collateral requirements.
Improved market transparency.
3.2 Trade Reporting and Transparency
Regulators worldwide have introduced mandatory trade reporting requirements to enhance transparency in derivatives markets. Trade repositories collect and publish data on derivative transactions, including notional amounts, counterparties, and trade dates.
Examples of regulatory measures:
Dodd-Frank Act: Requires real-time reporting of swaps transactions to swap data repositories.
EMIR: Obligates EU market participants to report derivative trades to trade repositories.
Impact:
Increased market visibility.
Facilitated monitoring of systemic risk and market abuse.
3.3 Margin and Collateral Requirements
To mitigate counterparty risk, regulators have introduced margin requirements for both cleared and non-cleared derivatives. Initial margin protects against potential default losses, while variation margin ensures that daily gains and losses are settled.
Impact:
Reduced excessive leverage in derivatives trading.
Promoted financial stability and investor confidence.
3.4 Standardization of Contracts
Policy frameworks encourage the standardization of derivative contracts to facilitate central clearing and improve liquidity. Standardization covers contract size, settlement dates, underlying asset definitions, and documentation standards.
Impact:
Easier to trade on exchanges or through CCPs.
Lower operational and legal risks for participants.
3.5 Risk-Based Supervision
Regulators are increasingly adopting risk-based approaches to monitor derivative markets. This involves focusing on systemically important institutions, products, and trading strategies that could pose the greatest risk to financial stability.
Impact:
Efficient use of regulatory resources.
Early identification and mitigation of systemic threats.
4. Key Policy Developments in Commodities Markets
4.1 Position Limits and Speculation Controls
Excessive speculative trading can destabilize commodity prices. Regulators have introduced position limits to restrict the number of contracts a participant can hold in futures markets. These limits aim to prevent market manipulation and excessive concentration of risk.
Examples:
Commodity Futures Trading Commission (CFTC) in the US sets speculative position limits for energy, metals, and agricultural contracts.
Securities and Exchange Board of India (SEBI) imposes position limits in commodity futures markets to curb volatility.
4.2 Market Surveillance and Anti-Manipulation Measures
Commodity exchanges and regulators have strengthened market surveillance to detect and prevent price manipulation, spoofing, and front-running. Sophisticated monitoring systems track trading patterns in real-time to identify anomalies.
Impact:
Enhanced investor confidence.
Reduced market distortions caused by artificial price movements.
4.3 Integration with Global Markets
Globalization of commodities trading has prompted harmonization of regulations across borders. Policymakers focus on aligning rules regarding contract specifications, reporting, and settlement to facilitate international participation.
Examples:
Cross-border recognition of clearinghouses.
Adoption of international standards on warehouse receipts and quality certification for agricultural commodities.
4.4 Commodity Derivatives for Hedging and Risk Management
Governments encourage the use of commodity derivatives for legitimate hedging purposes by producers, consumers, and traders. Policy initiatives include reducing regulatory burdens for hedgers while monitoring speculative activities.
Impact:
Enhanced price discovery and risk management.
Support for farmers, manufacturers, and energy companies in managing input costs.
4.5 Technological Innovations and Policy Adaptation
Digital trading platforms, algorithmic trading, and blockchain-based commodity exchanges have transformed the market landscape. Regulators are adapting policies to address new risks, including cyber threats, algorithmic market manipulation, and transparency challenges in decentralized trading.
Impact:
Improved market efficiency and accessibility.
Necessitated development of technology-driven monitoring tools.
5. Emerging Trends in Policy Development
Sustainability and ESG Integration: Policies increasingly emphasize environmental, social, and governance (ESG) compliance. Commodity trading in carbon credits, renewable energy certificates, and ESG-linked derivatives is growing.
Retail Participation Regulation: With growing retail interest in commodities and derivatives, regulators are introducing education initiatives, leverage limits, and product suitability requirements.
Cross-Market Risk Management: Integrated policies are addressing interconnected risks between derivatives, commodities, and other financial markets.
Global Coordination: Bodies like the IOSCO and FSB coordinate policy frameworks to prevent regulatory arbitrage and systemic instability.
6. Challenges in Policy Implementation
Despite significant reforms, regulators face several challenges:
Complexity of Derivative Products: Highly customized contracts are difficult to monitor and standardize.
Global Market Fragmentation: Different jurisdictions have varied regulatory standards, creating arbitrage opportunities.
Technological Disruptions: High-frequency trading, AI-based strategies, and decentralized exchanges introduce new risks.
Balancing Innovation and Risk: Policymakers must ensure that innovation is not stifled while protecting market participants.
7. Conclusion
Policy developments in derivatives and commodities markets have transformed these markets into safer, more transparent, and efficient mechanisms for risk management and investment. Central clearing, trade reporting, margin requirements, and position limits have enhanced market integrity and financial stability. Regulatory emphasis on transparency, standardization, and risk-based supervision has reduced systemic threats while fostering investor confidence.
As these markets continue to evolve with globalization, technological innovation, and ESG integration, policymakers must remain agile. Future regulatory frameworks are likely to focus on harmonizing global standards, enhancing surveillance capabilities, promoting sustainability, and safeguarding retail participants. Effective policy development in derivatives and commodities markets not only mitigates risks but also ensures that these markets continue to serve as vital tools for price discovery, hedging, and economic growth.
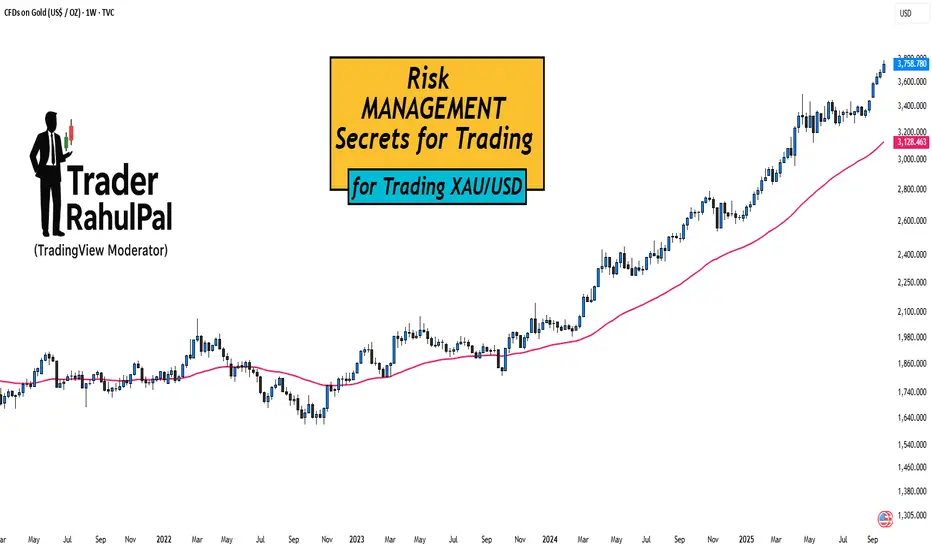
Risk Management Secrets for Trading XAU/USD!Hello Traders!
Gold (XAU/USD) is one of the most rewarding instruments, but also one of the most dangerous if you don’t manage risk properly.
Many traders lose not because their strategy is bad, but because they fail to protect their capital.
Here are some key risk management secrets every gold trader must know.
1. Position Sizing is Everything
Gold moves fast, a $5 move can wipe out accounts if the lot size is too big.
Always calculate position size based on risk per trade (ideally 1–2% of your account).
This way, even if you hit multiple stop losses, your account survives.
2. Wider Stops, Smaller Lots
Gold often spikes and hunts tight stop losses.
Use slightly wider stops, but reduce lot size to balance the risk.
This gives your trade room to breathe without increasing overall risk.
3. Never Trade News Without a Plan
During events like NFP, CPI, or Fed speeches, XAU/USD becomes extremely volatile.
If you’re not experienced, it’s better to stay out.
If you do trade, cut position size and expect slippage.
4. Daily Loss Limit
Decide in advance how much you can lose in one day (for example, 3% of account).
If that limit is hit, stop trading for the day.
This prevents emotional revenge trading, which is the biggest killer in gold trading.
5. Use Partial Profits
Gold reverses quickly, so book partial profits when the trade moves in your favor.
This locks in gains and reduces pressure.
Move stop loss to break-even once part profits are secured.
Rahul’s Tip:
Your job as a trader is not to catch every move, but to stay in the game .
Risk management may feel boring, but it’s the only reason why professional traders survive while retail traders blow up.
Conclusion:
In XAU/USD trading, strategy decides entries, but risk management decides survival.
By controlling lot size, stops, and emotions, you can make gold work for you instead of against you.
If this post helped you see risk management in a new light, like it, drop your thoughts in comments, and follow for more trading wisdom!
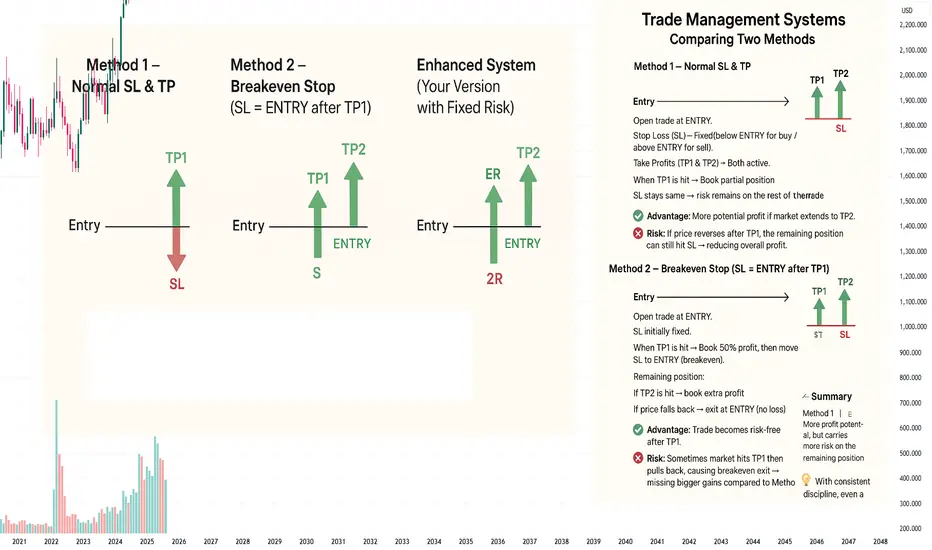
Trade Management Systems: Comparing Two Methods
📌 Method 1 – Normal SL & TP
Entry → Open trade at ENTRY.
Stop Loss (SL) → Fixed (below ENTRY for buy / above ENTRY for sell).
Take Profits (TP1 & TP2) → Both active.
When TP1 is hit → Book partial position.
SL stays the same → risk remains on the rest of the trade.
✅ Advantage:
More potential profit if market extends to TP2.
❌ Risk:
If price reverses after TP1, the remaining position can still hit SL → reducing overall profit.
📌 Method 2 – Breakeven Stop (SL = ENTRY after TP1)
Entry → Open trade at ENTRY.
SL initially fixed.
When TP1 is hit → Book 50% profit, then move SL to ENTRY (breakeven).
Remaining position:
If TP2 is hit → book extra profit.
If price falls back → exit at ENTRY (no loss).
✅ Advantage:
Trade becomes risk-free after TP1.
❌ Risk:
Sometimes market hits TP1 then pulls back, causing breakeven exit → missing bigger gains compared to Method 1.
📌 Enhanced System (Your Version with Fixed Risk)
Initial SL → Always set at 2R.
TP1 → When reached, book 50% profit (+1R on half).
Then move SL to ENTRY (breakeven) for the remaining 50%.
📊 Possible Outcomes:
Scenario Result
Price hits SL (before TP1) –2R loss
Price hits TP1, then reverses to ENTRY +0.5R profit
Price hits TP1, then TP2 +2R total profit
⚖️ Summary
Method 1 (Normal SL & TP) → More profit potential, but carries more risk on the remaining position.
Method 2 (SL = ENTRY after TP1) → Safer, risk-free after TP1, but sometimes cuts off bigger gains.
Your Enhanced Version → A defensive system:
Losers are limited (–2R).
Small winners (+0.5R) happen often.
Big winners (+2R) balance out losses.
💡 With consistent discipline, even a 40–45% win rate can make this system profitable.
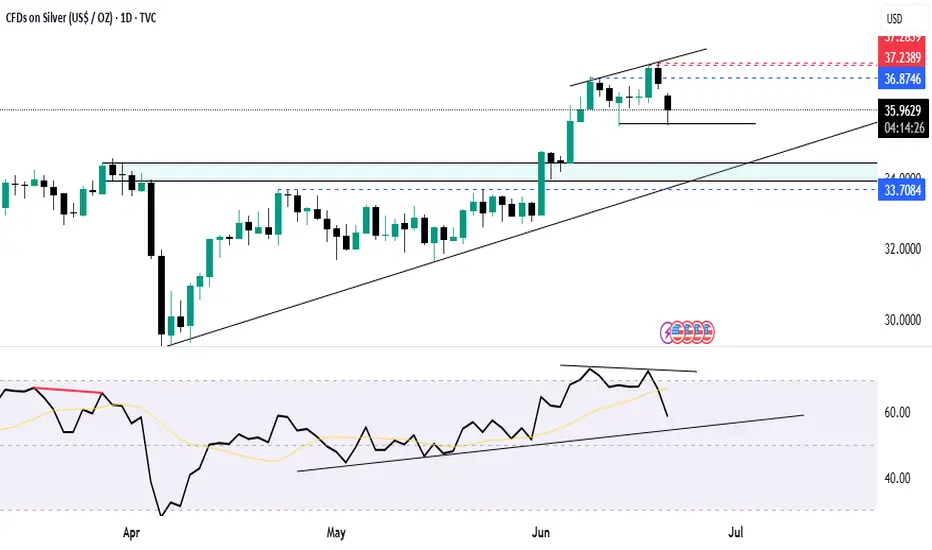
SILVER 1D🔹 Silver Technical View
🔸 Timeframe:
🔸 Bias:
🔸 Strategy:
🧠 Key Levels Marked on Chart
Below 35.56 can see 34.40/34.00
Above 36.50 can see 37.90+
Union Budget 2025: Key Highlights & Market ImpactUnion Budget 2025: Key Highlights and Market Implications
Hello everyone, I hope you're all doing well in your personal and trading endeavors. Today, I bring you a concise summary of the Union Budget 2025, presented by Finance Minister Nirmala Sitharaman on February 1, 2025. This budget focuses on boosting economic growth, providing tax relief, and strengthening various sectors of the economy.
Key Highlights of Union Budget 2025
Income Tax Relief: The government has increased the income tax exemption limit to ₹12 lakh under the new tax regime, providing significant relief to salaried individuals. This is expected to boost savings and consumption.
Infrastructure Development: Increased capital expenditure has been allocated to roadways, railways, and smart cities, aiming to accelerate economic growth and employment.
Agriculture and Rural Economy: Enhanced financial support and subsidies for farmers, along with new schemes to promote high-yield crops and modern agricultural techniques.
Stock Market and Investment: The budget introduces measures to encourage long-term investments, with tax benefits for equity investors and policies to strengthen capital markets.
Energy Sector and Sustainability: A Nuclear Energy Mission has been launched, along with incentives for renewable energy projects, focusing on sustainable development.
Support for Startups and MSMEs: Tax benefits and funding support have been extended for startups and small businesses to drive innovation and entrepreneurship.
AI and Digital India Initiative: Increased investments in artificial intelligence, digital infrastructure, and cybersecurity to strengthen India's tech ecosystem.
Healthcare and Education: Enhanced budget allocation for the healthcare sector, medical research, and AI-driven education initiatives.
Impact on Traders and Investors
✔ Positive Sentiment for Equity Markets: Increased disposable income and tax relief could lead to higher consumer spending, benefiting FMCG, auto, and retail sectors.
✔ Growth in Infrastructure and Energy Sectors: Higher government spending on infrastructure and renewable energy will likely boost related stocks.
✔ Technology and Startups to Benefit: Increased government support for startups and AI-based industries could lead to significant growth in these sectors.
This budget provides multiple opportunities for traders and investors to align their strategies with emerging trends. Stay updated, analyze the market, and make informed decisions.

Silver DivergenceDivergence and Gold/Silver Ratio
Gold and silver are thought to move together, and often they do. There are periods where the Gold Trust (GLD) and Silver Trust (SLV) move in opposite directions and periods where one metal outperforms the other.
Gold is currently outperforming silver. Such discrepancies occur and are monitored by the gold/silver ratio. The gold/silver ratio shows how many ounces of silver it takes to buy an ounce of gold. Since 1975, the average is near 60; right now it stands near 80 ($1,187 divided by $14.99).
While gold outperformance, or silver's underperformance relative to gold, was very noticeable in early 2016, this has actually been going on for a long time. The outperformance has become even more pronounced since 2016. To start 2016, gold traded at $1,069 and silver at $13.80 -- the gold/silver ratio of 77.5. As of Oct. 2018, it's at 80. Gold prices have risen relative to silver prices quite steadily for years. This is mainly due to silver price weakness since peaking near $50 in 2011 (when silver outperformed gold).

Banknifty , Crude oil and Copper Divergence Divergence is a technical analysis concept that occurs when the price of an asset and a technical indicator move in opposite directions. It's a sign that the price of an asset may be reversing, and it can help traders recognize and react to price changes.
Here are some things to know about divergence:
#Types of divergence
There are two types of divergence: negative and positive. Negative divergence happens when the price of a security is rising, but an indicator is falling. Positive divergence happens when the price of a security is falling, but an indicator is rising.
#When to use divergence
Divergence can help traders make decisions like tightening stop-loss or taking a profit.
#How to confirm reversals
Divergence can occur over a long period of time, so traders can use other tools like trendlines and support and resistance levels to confirm reversals.
#When to use convergence
Convergence is when the price of an asset, indicator, or index moves in the same direction as a related asset, indicator, or index

Advanced Divergence Trading"Welcome to SkyTradingZone "
Hello Everyone 👋
Video Information -
Hello , Everyone lets start the Journey of Advanced Divergence Trading
In this video, we are going to look at divergence.
What is divergence?
Divergence is basically
when the market is creating
higher highs and higher lows, and
the RSI is creating the opposite.
(Divergence can happen in
both downtrends and uptrends.)
----------------------------------------------------------------
Q What divergence does, it's basically
telling you that the trend is weakening.
This is in a downtrend, and the RSI,
the divergence, is basically telling you
that this downtrend is weakening and
there could be a possible reversal soon.
So normally when divergence
is happening, you normally see
The market creates basically a curve.
----------------------------------------------------------------
Structure is always key
It doesn't matter the strategy
you use, structure is always key.
So what you want to see is that
breaker structure to say that the trend
is changing because structure changed.
Note- Normal Tip From our side try to learn Liquidity and order block

Stay Ahead: Essential Tips to Avoid Trading PitfallsHello TradingView Community!
I'm excited to share some valuable insights on trading pitfalls and how to navigate them effectively. Trading in financial markets can be a challenging journey, but understanding common pitfalls and methods to avoid them can significantly enhance your success. Here are 10 pitfalls traders often encounter and actionable strategies to help you steer clear of them:
Having No Trading Plan:
Entering trades without a plan can lead to impulsive decisions. Develop a clear trading plan outlining your goals, strategies, entry and exit points, and risk management.
Using Strategies That Don't Match Your Personality:
Align your trading strategies with your personality, risk tolerance, and lifestyle. A good match helps you stay consistent and focused.
Having Unrealistic Expectations:
Set realistic goals based on your initial capital and risk tolerance. Trading is not a quick path to wealth, so be patient and persistent.
Taking Too Much Risk:
Avoid over-leveraging and using excessive position sizes. Implement risk management techniques like stop-loss orders and diversification.
Not Having Rules to Follow:
Create a set of trading rules to guide your decisions. These rules provide structure and help you stay disciplined.
Not Being Flexible to Market Conditions:
Adaptability is key in trading. Monitor the markets and adjust your strategies as conditions change.
Failing to Take Responsibility for Your Results:
Own your successes and mistakes. This mindset empowers you to learn, grow, and improve your trading.
Being Addicted to Volatility:
While volatility can be exciting, avoid chasing it for thrills. Focus on making well-reasoned decisions based on your plan.
Not Having a Process to Keep Track of Your Performance:
Maintain detailed records of your trades and their outcomes. Analyze this data to identify patterns and refine your strategies.
Not Dealing with Your Emotional Risk:
Emotions can cloud your judgment in trading. Practice emotional intelligence and techniques like meditation or journaling to stay composed.
Neglecting Proper Research and Due Diligence:
Relying solely on tips or rumors can lead to poor decisions. Conduct thorough research and due diligence on potential trades and investments.
Overcomplicating Your Trading Strategy:
Complex strategies may not always lead to better results. Simplify your approach to focus on proven methods and avoid overanalyzing the market.
Ignoring the Importance of Continuous Learning:
The markets evolve, and so should your knowledge and strategies. Stay updated on market trends and continuously educate yourself to stay ahead.
There is no trade without a stop-loss:
This point emphasizes the importance of having a stop-loss in place before entering any trade. It highlights risk management as a fundamental part of trading, ensuring that you have a clear exit strategy to limit potential losses.
If you have to re-analyze charts after being in a trade, you might be going in the wrong direction:
This point underscores the importance of trusting your initial analysis and trading plan. It warns against second-guessing or changing your plan mid-trade, which could indicate you may be heading in the wrong direction.
By implementing these strategies, you can enhance your trading experience and improve your performance over time. Remember, successful trading is a journey that requires discipline, patience, and continuous learning.
I hope you find these insights helpful. Feel free to share your thoughts and experiences in the comments. Let's continue to support each other and grow as a community!
Happy trading!
RK💕
I am not Sebi registered analyst.
My studies are for educational purpose only.
Please Consult your financial advisor before trading or investing.
I am not responsible for any kinds of your profits and your losses.
Most investors treat trading as a hobby because they have a full-time job doing something else.
However, If you treat trading like a business, it will pay you like a business.
If you treat like a hobby, hobbies don't pay, they cost you...!
Disclaimer and Risk Warning.
The analysis and discussion provided on in.tradingview.com/u/RK_Charts/ is intended for educational purposes only and should not be relied upon for trading decisions. RK_Charts is not an investment adviser and the information provided here should not be taken as professional investment advice. Before buying or selling any investments, securities, or precious metals, it is recommended that you conduct your own due diligence. RK_Charts does not share in your profits and will not take responsibility for any losses you may incur. So Please Consult your financial advisor before trading or investing.

MCX Mrtal and Energy Analysis Crudeoil , Natural Gas and Silver, Its a general analysis on the basis of simple price action

Option's By Professionals Player's 🤑👑👑Royal Trend👑
Topic Trading Things
#If u Buy stock without stop loss that mean U are weak in Physiology
#Train Your self To take small trade with Stop-loss
How to make Big Profit💸 With Small Account
In this video we try to Identify Trend and Entry By Big Bull👑🤑🤑💸💸
How market really work with number's
How important is option chain analysis?
The option chain analysis data provides a very comprehensive view for all the available options for any particular underlying asset. This helps in understanding and selecting the correct option for trading or investment purpose.
Difference between technical analysis and option trading
Technical analysis and options trading can go hand in hand. Many of the best practices for options trading come directly from technical analysis concepts. Technical analysis focuses on price. Fundamental analysis does not solely focus on price.
why we learn option chain?
Option chain is a chart that will give in-depth information related to all stock contracts available for Nifty stocks. The best thing about the option chain is that it provides valuable information about the current security value and how it will affect it in the long term.
What is the purpose of option chain?
It can be used in creating an option strategy at several strike prices. It can be used to analyse and draw noteworthy insights about the stock and its probable movements. It helps the traders in evaluating the liquidity and the depth of the option contract.
Technical trader
Technical trading is a broader style that is not necessarily limited to trading. Generally, a technician uses historical patterns of trading data to predict what might happen to stocks in the future. This is the same method practiced by economists and meteorologists: looking to the past for insight into the future.
NOTE
#We Are Not Promote Anything
#This channel Purpose to share market ideas.
Thanks for Watching🙏
