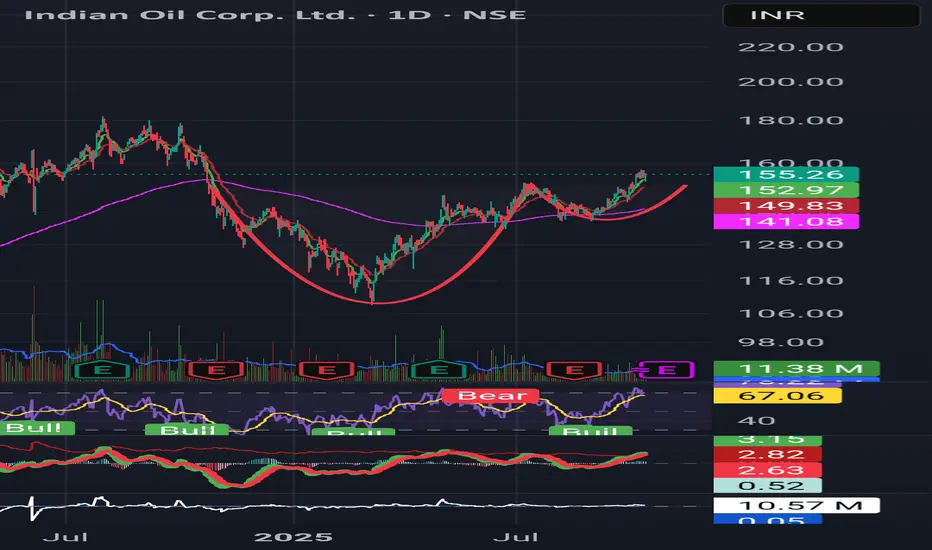
IOC forming a strong cup-and-handle breakout. IOC looks strong technically — cup-and-handle breakout on daily chart, trend intact across timeframes.
CMP 155-156;
stop 148.8;
target 180.
Trend supported by momentum & EMAs.
📈 RSI > 65
✅ MACD bullish
📊 Holding above ₹148.8 keeps the trend
Commodities
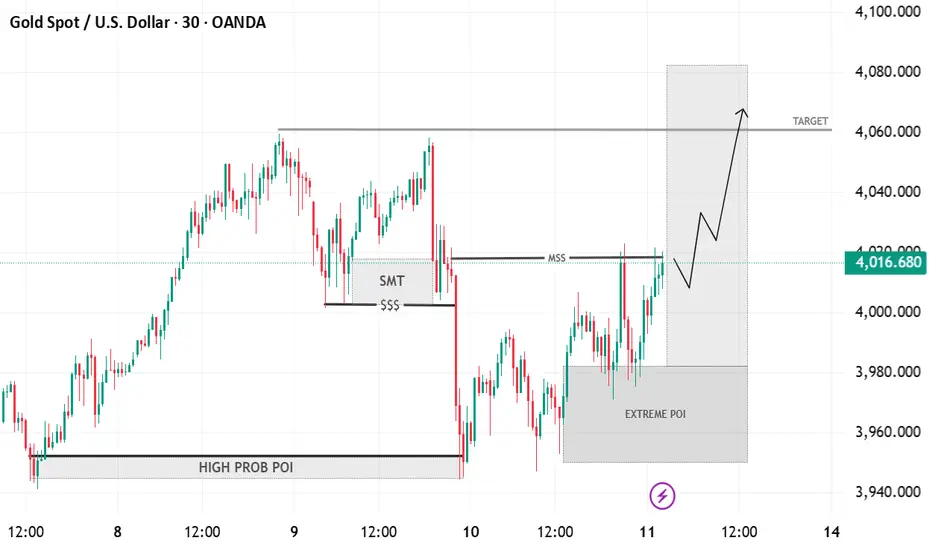
Gold–Bullish Reversal Setup from Extreme POI Toward 4060 TargetTimeframe: 30-minute chart (XAU/USD – Gold Spot vs U.S. Dollar)
Market Structure:
Price made a structural low (SMT) around the $$$ liquidity zone.
A Market Structure Shift (MSS) occurred as price broke above short-term highs.
POI (Point of Interest) Zones:
High Probability POI: Previous accumulation zone that caused a bullish impulse.
Extreme POI: Current demand zone (around 3960–3980), where price is rebounding.
Current Price Action:
Price has reacted bullishly from the Extreme POI.
The breakout above MSS signals possible continuation to the upside.
Target Zone:
The shaded grey target area (~4060–4080) aligns with previous liquidity highs.
Bias:
Bullish short-term bias toward 4060–4080 zone, assuming the demand zone holds.
Break below Extreme POI would invalidate the setup and suggest deeper retracement.
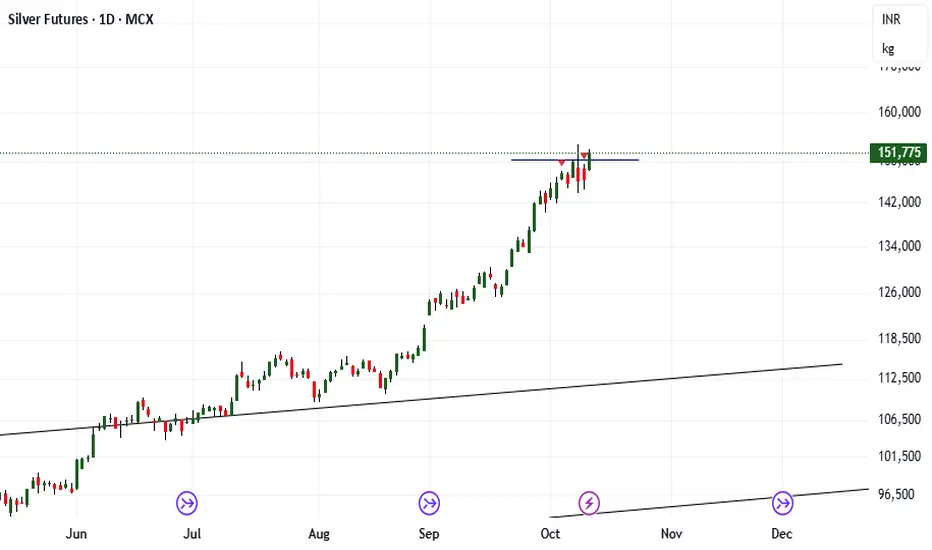
Silver Up 4% | Less Volume Silver rose by 4% today but the volume didn't seem to participate. Till 3:30 PM, silver future volume quoted below it's average volume. If it doesn't open in gap-up tomorrow with volume support, then a reversal won't be that surprising.
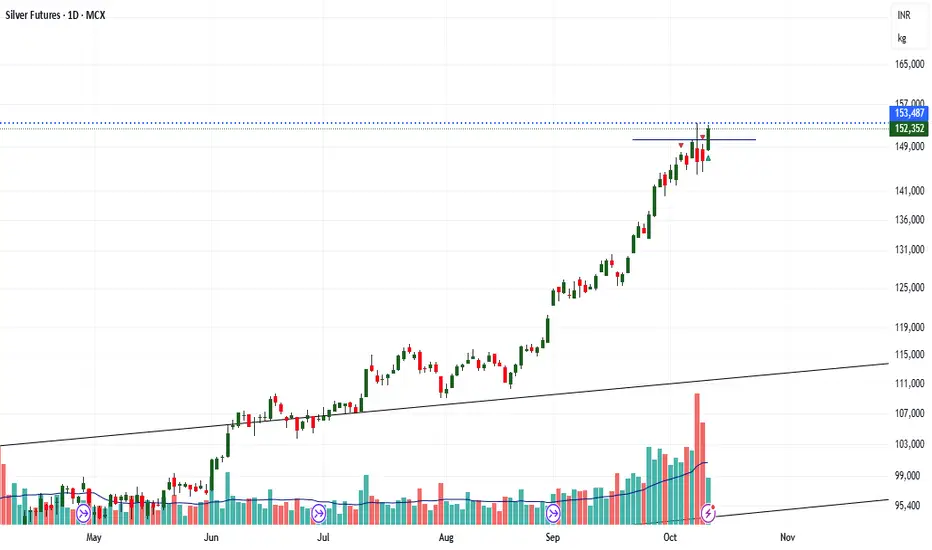
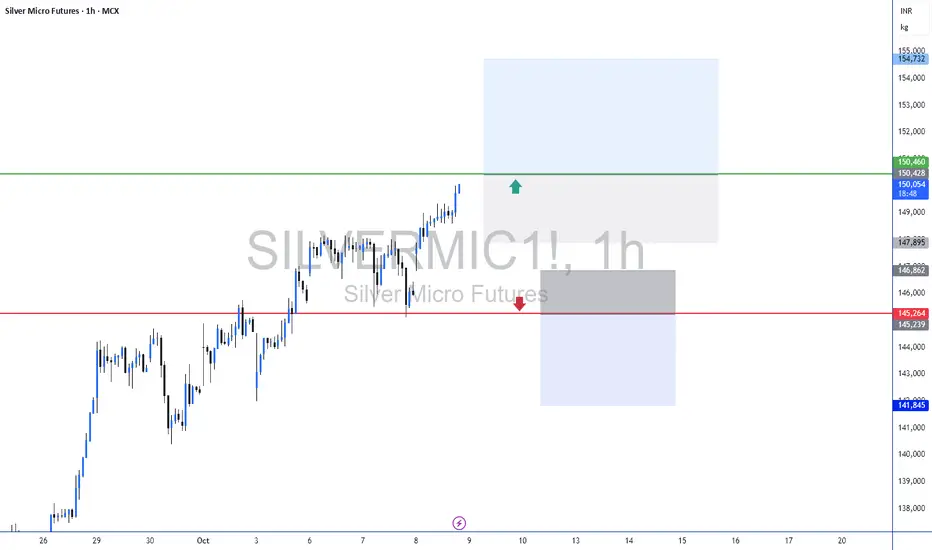
Silver swing breakoutSilver has broken out of the 1,50,000 hurdle and might head towards 1.5850 - 1.5950 in this week.
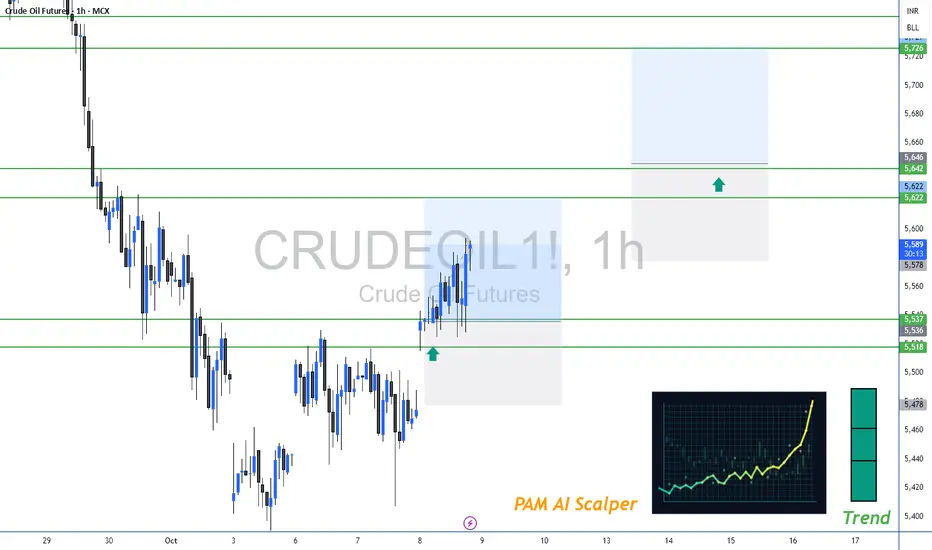
CRUDE OIL By KRS ChartsDate: 2nd July 2025 / 19:35
Why Crude Oil ?
1. Starting with 1H Tf. Accumulation is visible with LLs to Sideways and now HHs & HLs
2. Crude oil Price is currently in Buy Zone with strong support.
3. Recent Gap Dow is likely to be Shakeout for Buyers.
4. In Bigger Timeframe price has made Low in March is likely to be the bottom as per Wave thoery.
5. After that bottom price on Higher low side price accumulating.
6. From Here it seems like bullish side trades will be better option for Crude Oil for Targets which are mentioned in Chart. (Medium Term View).

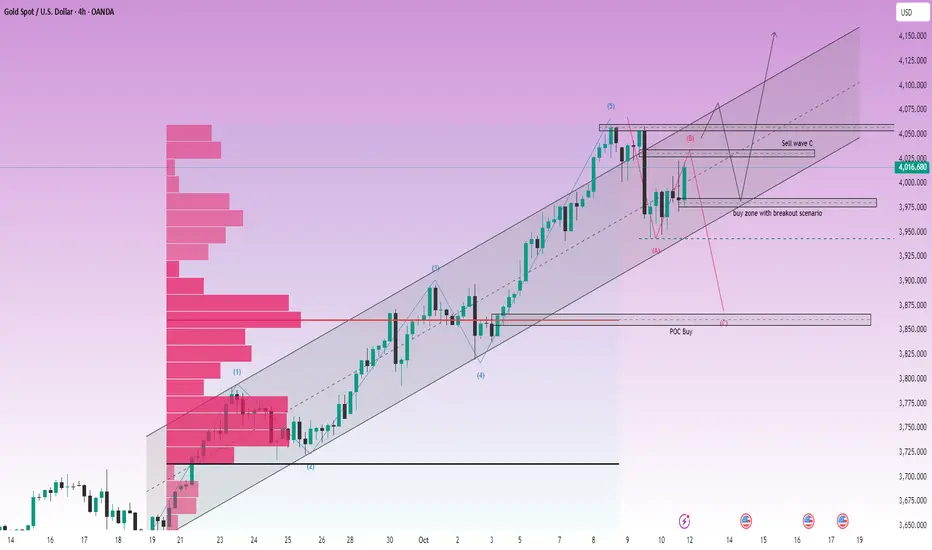
LiamTrading – GOLD: Risk of ABC Correction Wave..LiamTrading – GOLD: Risk of ABC Correction Wave, Short-term Sell at 4028
Hello traders,
Gold has had an impressive growth week, but as prices hit new highs, the risk of correction always increases. Let's examine this week's Gold scenario based on wave analysis and market liquidity.
📊 Technical Analysis (Chart H4 – XAUUSD)
Based on the H4 chart, Gold (GOLD) seems to have completed the Push Wave 5 (Elliott Wave 5) in the current uptrend cycle, reaching strong resistance around 4050–4060.
Current Structure:
The price is within a sustainable Uptrend Channel.
The 4050–4060 range is a significant resistance where selling pressure may emerge.
An ABC correction wave scenario appears after completing Wave 5.
Key Liquidity Zones:
Potential Resistance Zone (Sell Wave C): Around 4028–4033 (Price area to watch for the reaction of the final Wave C).
Confirmed Drop Support Zone: 3972 (Critical price area confirming if selling pressure is strong enough).
Attractive Buy Zone: 3976 (Temporary liquidity if price corrects, waiting for Breakout confirmation).
Long-term Buy Zone (POC Buy): ~3850 (Price area with a huge Volume Profile, ideal for long-term buy orders).
🎯 New Week Trading Scenario
📉 Short-term Sell
This scenario is based on the expectation of an ABC correction wave starting from the resistance zone.
📍 Entry: 4033
🛑 SL: 4040 (Very tight SL, suitable for short-term Sell strategy at the wave peak)
🎯 TP: 3976 → 3943 → POC (~3850)
📈 Long-term Buy
This setup waits for a correction to lower liquidity zones to enter Buy orders with optimal R:R ratio.
📍 Entry: 3976 (Temporary liquidity buy zone)
🛑 SL: 3970
🎯 TP: 4040 → 4090 → 4150
🛑 Failure Scenario (Wait for Breakout Confirmation)
If the price breaks the 4060 peak and creates a new ATH (All-Time High), the ABC wave scenario will fail.
Action: Continue to prioritize Buying. The best entry is to wait for the price to retest the broken liquidity zone (Breakout Retest) around 3976.
🧭 Fundamental & Long-term Analysis
Macroeconomic Sentiment: The Royal Bank of Canada (RBC) forecasts Gold to rise to $4,500 in the next two years, bolstered by long-term inflation concerns. This confirms the long-term uptrend of Gold remains intact.
US Dollar Impact (USD): The traditional view is that USD rises as investors seek liquidity during market stress. However, Gold's rise alongside USD shows the market prioritizes gold as an inflation hedge rather than just a safe haven.
Long-term Strategy: The buy zone at POC (~3850) according to Volume Profile is extremely suitable. Large liquidity here will help traders enter optimal orders and hold long-term, leveraging the pressure from the Seller's Liquidity to push prices up.
📌 Conclusion
Gold is at a critical crossroads. Although the long-term trend is up, the short-term correction risk (ABC Wave) at the 4028–4033 zone is very high.
Priority: Watch for short-term sells at the resistance zone with a tight SL.
Safe strategy: Wait to Buy at liquidity support zones like 3976 or POC (~3850) to optimize risk/reward (R:R).
I will continue to update Gold scenarios daily with insights from 8 years of trading experience.
👉 Follow me to not miss important updates!
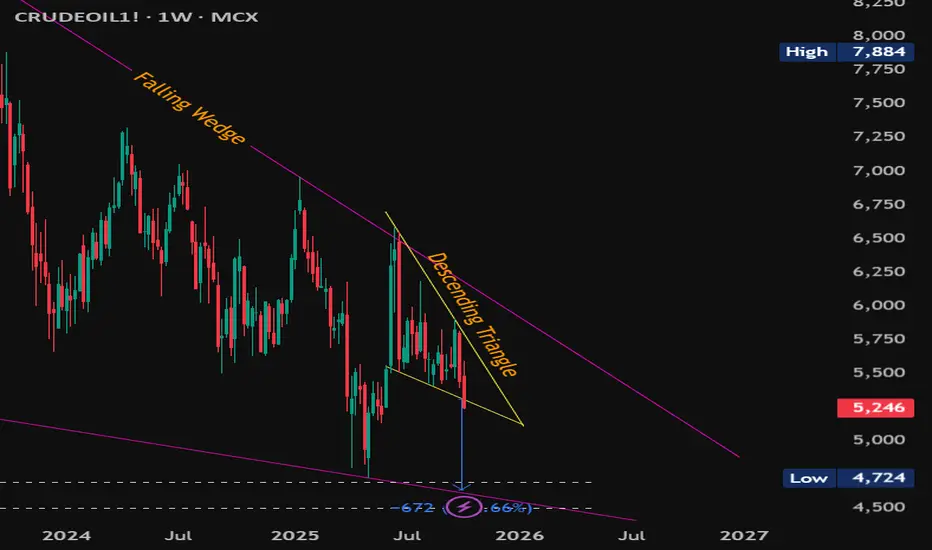
#MCXCrudeOil Weekly – Breakdown into Major Support Zone#MCXCrudeOil Weekly – Breakdown into Major Support Zone
CMP: 5,246
Crude Oil has broken down from a descending triangle with a confirmed weekly close below 5,308 , triggering target of 4,636 . This move unfolds within a larger falling wedge pattern , adding confluence and signaling potential volatility ahead.
This breakdown aligns with two key confluences :
📉 The falling wedge lower trendline.
🟠 A major historical demand zone at 4,692 – 4,499 , which was previous resistance turned strong support on multiple occasions.
This make-or-break support zone could act as:
🔄 A reversal zone , potentially triggering a bullish breakout from the wedge.
📉 Or, if breached, it may invalidate the wedge and lead to extended downside.
Key Levels:
Resistance: 5,903 & 6,184 (price action + wedge top)
Support: 4,692 – 4,499 (confluence zone)
Breakdown Target: 4,636 (descending triangle pattern)
Watch weekly candle behavior near this zone closely for signs of either rejection or continuation .
#CrudeOil #MCXCrude #ChartPatterns #FallingWedge #DescendingTriangle #PriceAction #BreakdownAlert #SwingTrading #CommodityTrading
📌 Disclaimer: This analysis is shared for educational purposes only. It is not a buy/sell recommendation. Please do your own research before making any trading decisions.
Gold 4H – Bullish Setup Ahead of Fed & CPI Week🥇 XAUUSD – Weekly Smart Money Plan | by Ryan_TitanTrader
📈 Market Context
Gold continues to trade near the ₹4,000 mark as traders brace for a volatile week driven by the U.S. CPI release and Federal Reserve remarks.
Recent Fed comments hint that policymakers are open to rate cuts if inflation cools further, boosting gold’s appeal as a hedge against policy easing and market uncertainty.
Meanwhile, tensions in the Middle East and strong central bank demand for gold continue to provide underlying bullish momentum, though short-term pullbacks remain likely.
🔎 Technical Analysis (4H / SMC Style)
• The higher-timeframe BOS (Break of Structure) confirms that gold remains in a bullish market phase, with buyers defending every major retracement.
• The current pullback could target the Potential Reaccumulation Zone around 3947, where liquidity may be swept before the next bullish impulse.
• The Discount Demand Zone (3873–3875) aligns with strong 4H imbalance and previous structure support — ideal for a high-probability buy setup.
• The Premium Supply Zone (4134–4132) is positioned as a liquidity target, where price may react for short-term corrections.
🟢 Buy Zone: 3873–3875
SL: 3866
TP targets: 3947 → 4020 → 4050 → 4130+
🔴 Sell Zone: 4134–4132
SL: 4141
TP targets: 4080 → 4020 → 3950
⚠️ Risk Management Tips
• Wait for H1 ChoCH / BOS confirmation before executing positions.
• Anticipate liquidity hunts near 3950–3970 ahead of CPI or Fed events.
• Use partial scaling and secure partial profits once the structure confirms continuation.
• Avoid entering during the first 15 minutes of major news releases to reduce slippage risk.
✅ Summary
Gold remains structurally bullish on the 4H timeframe, with potential retracement opportunities offering premium entries.
Smart Money may induce a liquidity sweep into 3873–3875 before pushing toward 4130+, where a reaction from institutional supply is likely.
With major macro catalysts this week, traders should expect sharp volatility and manipulative moves before the next major leg develops.
🔔 Stay patient — let the market reveal its intent before entering.
Premium buys remain favored above 3870 while watching for potential distribution near 4130.

LiamTrading – XAUUSD: Structure BreakLiamTrading – XAUUSD: Structure Break, Preparing for a STRONG DOWNTREND?
Hello trader,
The Gold market has undergone a significant Market Structure Shift, breaking the previous sustainable uptrend. After the key support area around 4000 was breached with high volume, the Bears have taken short-term control.
Currently, the price is experiencing a slight correction after a sharp drop, but overall, it is forming Lower High – Lower Low patterns on the H1 chart, confirming the downward movement.
📊 Technical Analysis (Chart 1H – XAUUSD)
The recent sharp decline has broken the upward structure (Break of Structure - BOS) and created significant inefficiencies/imbalances that need to be filled:
Liquidity Zone (Resistance): $4050 – $4060. This is the resistance peak to watch.
Sell Liquidity Zone (FVG Sell Zone): $4030 – $4040. This is the ideal Fair Value Gap for Bears to re-enter.
Key Support/Buy Scalping Zone: $3925 – $3935 (Confluence area of Fibonacci Extension 2.272).
Swing Buy/Accumulation Zone: $3905 – $3915 (Confluence area of Fibonacci Extension 2.618).
🎯 Main Trading Scenario (Short-term BEARISH)
Sell entry 4000 – 4002
SL 4008
TP 3986 – 3965 3950 – 3923
Sell Entry 4028 – 4031 (FVG)
SL 4036
TP 4022 – 4010 4000 – 3960
Buy Scalping
3926 – 3928
SL 3921
TP 3939 – 3955 3970 – 3990
Buy Bottom Zone 3900 – 3908
SL 3895
TP 3922 – 3945 3970 – 3988
Export to Spreadsheet
🧭 Fundamental View & Market Sentiment
The downward momentum is being driven by the following factors:
Monetary Policy: Fed official Williams' remarks supporting continued rate cuts seem to be reducing the safe-haven demand for Gold. Although rate cuts typically support Gold in the long term (due to "cheap money"), a slowing labour market is a short-term negative signal.
CPI News: The Bureau of Labour Statistics recalling staff to compile the CPI report amid a government shutdown highlights the importance of this data. If CPI is not as expected, it could cause significant volatility.
Market Sentiment: After the structure break, technical selling sentiment may dominate, especially if the price cannot quickly recover to the 4000 level.
📌 Conclusion & Recommendations
Gold has confirmed a short-term structure change to a downtrend. While the long-term trend is not yet clearly defined, the current priority is to seek Sell opportunities when the price retraces to key resistance and FVG areas (such as $4000 and $4030).
Advice: Always adhere to SL (Stop Loss) and prioritise risk reduction when the market shows reversal signals. DO NOT BUY when the downtrend structure is prevailing.
👉 Follow me for detailed updates and the latest trading plans during the session!

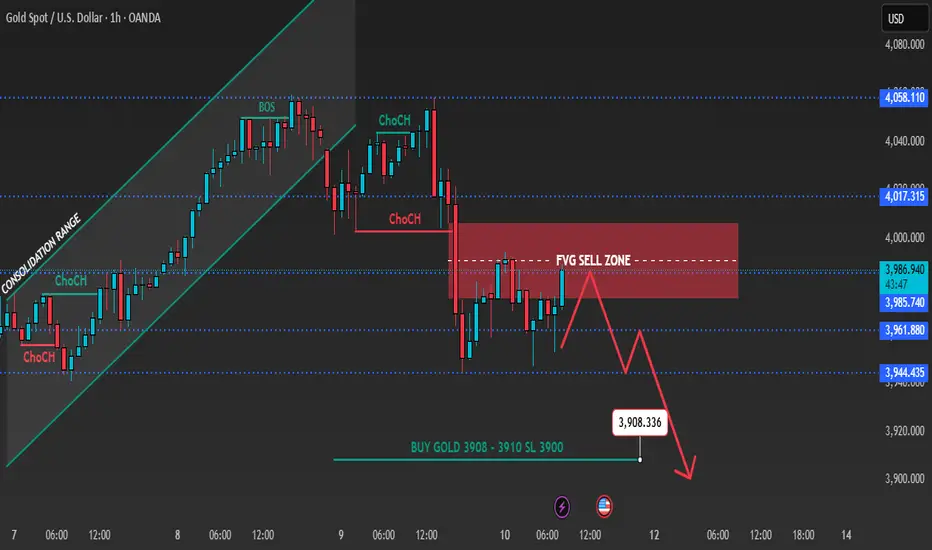
Gold 1H – Price Reaction Ahead of U.S. CPI DataXAUUSD – Intraday Trading Plan | by Ryan_TitanTrader
________________________________________
📈 Market Context
Gold prices remain steady around $3,975, as traders await the U.S. CPI data release later today — a key event that could shape expectations for the Fed’s next rate move.
If inflation cools, the dovish sentiment may boost gold’s safe-haven appeal; however, a hotter CPI print could trigger renewed dollar strength and short-term pressure on XAUUSD.
Market volatility is expected to spike near the release, so liquidity grabs and false breaks are likely before the true direction forms.
________________________________________
🔎 Technical Analysis (H1 / SMC Style)
• The recent Change of Character (ChoCH) confirms short-term bearish control after breaking the bullish structure near 4017.
• FVG Sell Zone (4015–4017) aligns with premium imbalance and prior liquidity — ideal for short setups if price retests that zone.
• BOS to the downside was confirmed at 3960, showing sellers in control.
• The discount zone 3908–3910 is a strong demand area where buyers may step in after liquidity sweep below 3910.
________________________________________
🟢 Buy Zone: 3908–3910
SL: 3900
TP targets: 3920 → 3940 → 3960+
🔴 Sell Zone: 4015–4017
SL: 4022
TP targets: 4000 → 3985 → 3970
________________________________________
⚠️ Risk Management Tips
• Wait for M15 ChoCH / BOS confirmation before entering either side.
• Use partial position sizing around CPI release — volatility may cause large wicks.
• Watch for liquidity hunts near 3980–3990 before CPI, then confirm structure direction.
________________________________________
✅ Summary
Gold is consolidating below key resistance while awaiting U.S. inflation data.
Smart money may engineer a liquidity sweep toward 4015–4017 (FVG) before resuming the bearish leg into 3910.
However, if CPI comes in softer than expected, buyers may defend 3908–3910, sparking a recovery back toward 3980+.
🔔 Stay alert around CPI release hours — expect manipulative price action and confirm structure breaks before committing to directional trades.
Silver Reversed from 1,50,000Silver reversed from the psychological hurdle of 1,50,000 level as expected and posted on 6th Oct,2025.

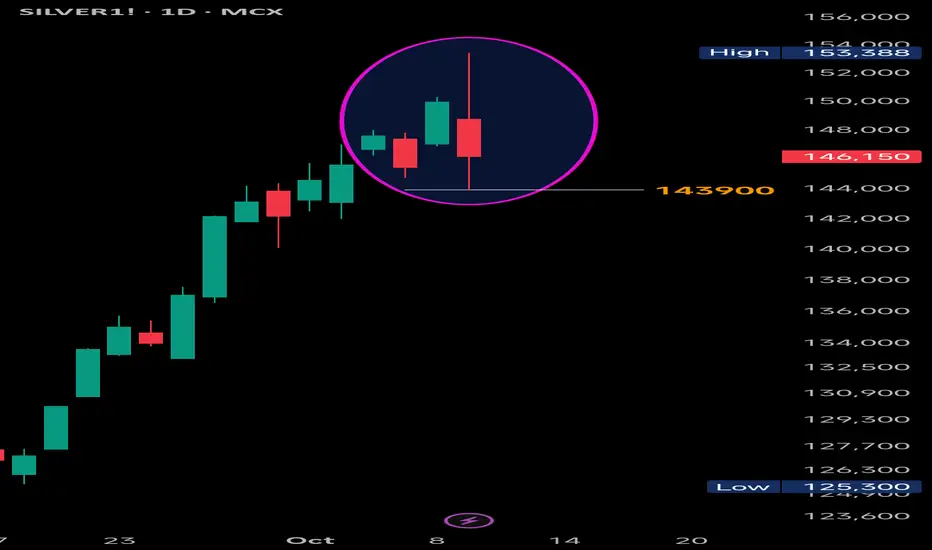
Silver: Bearish Engulfing – Is the Top In?#Silver View:
Just like Gold, Silver has formed a strong Bearish Engulfing pattern on the daily chart, potentially signaling a temporary top in the current trend. While it’s still early to confirm a full reversal, the price action suggests caution for bulls.
✅ Confirmation:
A daily close below 143,900
(today's low), especially with increased volume, would confirm the pattern and likely trigger further downside momentum.
❌ Negation:
If Silver manages to close above 153,388 (today’s high), the bearish structure will be invalidated.
🎯 Key Levels to Watch:
Resistance: 153,388 (pattern high)
Support: 143,900 (pattern low)
Stay alert for follow-through candles and volume spikes in coming sessions.
#Silver | #XAGUSD | #BearishEngulfing | #CandlestickPatterns | #TechnicalAnalysis | #PriceAction | #SilverAnalysis
📌 Disclaimer: This analysis is shared for educational purposes only. It is not a buy/sell recommendation. Please do your own research before making any trading decisions.
Gold 1H – Watch for Liquidity Hunt Before Fed Minutes💎 XAUUSD – Intraday Trading Plan | by Ryan_TitanTrader
📈 Market Context
Gold continues to shine past the ₹4,000 mark, driven by persistent safe-haven demand amid U.S. government shutdown risks and growing expectations for multiple Fed rate cuts this year.
The upcoming Fed minutes will be a pivotal catalyst—if the tone leans dovish, gold could accelerate. But any hawkish surprises may provoke a short squeeze or shakeout.
🔎 Technical Analysis (H1 / SMC Style)
• Structure around 4070–4068 marks a premium liquidity zone, likely a sweep or reversal point.
• The lower band 3987–3989 serves as a discount zone / support base from which buyers may re-enter.
• Watch for clean Breaks of Structure (BOS) or Change of Character (ChoCH) on lower timeframes as confirmation.
• Always expect potential liquidity sweeps before major news reactions.
🟢 Buy Zone: 3987–3989
SL: 3980
TP targets: 4000 → 4015 → 4025 → 4040+
🔴 Sell Zone: 4068–4070
SL: 4077
TP targets: 4060 → 4045 → 4030 → 4015
⚠️ Risk Management Tips
• Let the price show intent (reject / sweep / BOS) before jumping in.
• On Fed minutes release, volatility may spike—use partial sizing and tighter trailing stops.
• Avoid trading right at the release; look for reactions and structural confirmation.
✅ Summary
Gold remains bullish structurally, but intraday plays hinge on how markets interpret the Fed minutes. Expect a liquidity sweep around 4068 before potential shorting, and a resilient support zone around 3987–3989 for re-entries aligned with the bigger bullish structure.
🔔 Stay alert for live updates and structure breaks around the Fed minutes to fine-tune entries.

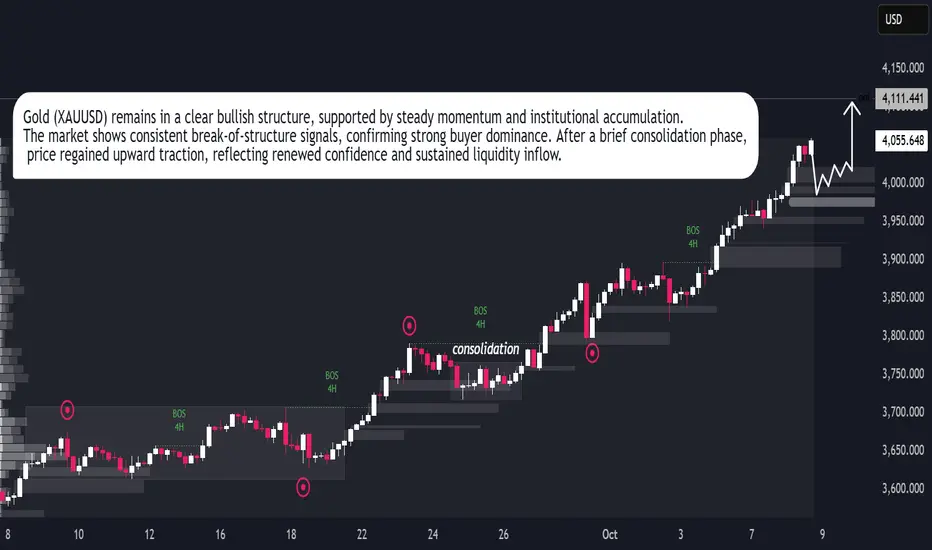
Gold Price Rally Sustains – Market Eyes Next Breakout PointGold (XAUUSD) continues to follow a strong bullish trajectory, confirming consistent market confidence and institutional participation. The chart structure reveals clear liquidity shifts and a steady series of bullish break-of-structure (BOS) points, suggesting that buyers remain in firm control. After a brief consolidation phase, gold resumed upward momentum, supported by sustained volume and steady market sentiment.
The current trend indicates controlled buying pressure rather than speculative spikes, showing the market’s preference for stability as price builds toward higher levels. If momentum maintains its present pace, gold could extend gains in the short term while maintaining its established bullish rhythm across the higher timeframe outlook.
Silver Levels For October 2025Important support and Resistance Levels For Silver.
When Market touches the level, the price action plays important roles.
For More Learning Reach out to us.
Crude Oil Levels For October 2025Important support and Resistance Levels For Crude Oil.
When Market touches the level, the price action plays important roles.
For More Learning Reach out to us.
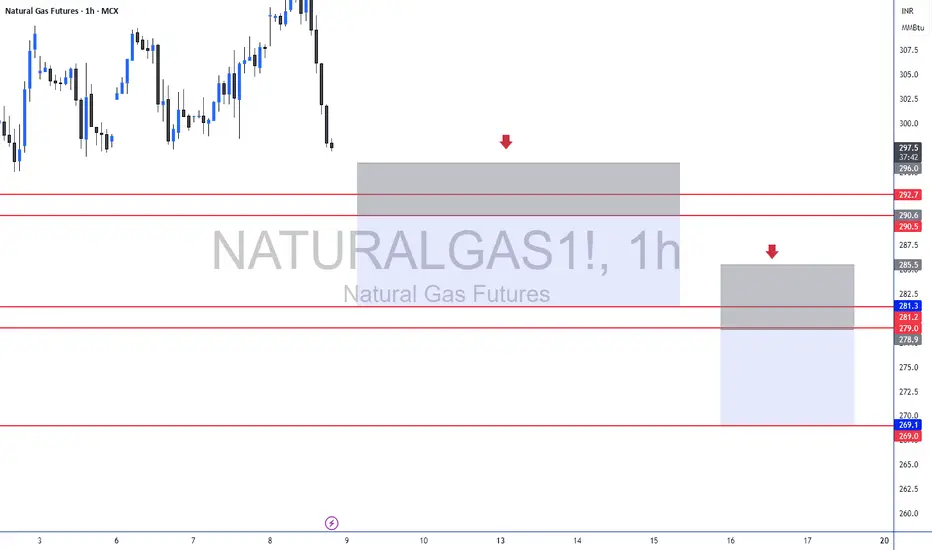
Natural Gas Levels For October 2025Important support and Resistance Levels For Natural Gas.
When Market touches the level, the price action plays important roles.
For More Learning Reach out to us.
Gold 1H – Bulls Seek Re-Entry Before Fed Minutes💎 XAUUSD – Intraday Trading Plan | Ryan_TitanTrader
📈 Market Context
Gold extends its advance above $4,030 as traders position ahead of this week’s FOMC minutes and key U.S. inflation expectations data. The metal remains supported by persistent geopolitical risk and renewed central-bank demand, while Treasury yields hover near monthly lows.
However, sentiment is mixed after the IMF warned of slower global growth, keeping the dollar steady and prompting potential short-term corrections before continuation.
🔎 Technical Analysis (H1/H4)
Price structure shows a clean Break of Structure (BOS) to the upside following a higher-low formation. The market is currently reacting near premium liquidity at 4068–4066, where a rejection could trigger a retracement toward the discount buy zone at 3969–3971 before resuming the bullish leg.
🟢 Buy Zone: 3969–3971 (Discount Demand / FVG) – potential re-entry area for continuation buyers.
🔴 Sell Zone: 4068–4066 (Premium Liquidity) – possible engineered sweep zone for short-term sellers.
🔑 Key Levels
• BUY Zone: 3969–3971 (main support 3960)
• SELL Zone: 4068–4066 (liquidity pool)
• Psychological Resistance: 4070
• Intraday Pivot: 4035
💡 Trading Scenarios & Plan
🟢 BUY ZONE: 3969–3971
SL: 3960
TP: 3980 – 3990 – 4005 – 4020 – 4035+
🔴 SELL ZONE: 4068–4066
SL: 4075
TP: 4050 – 4035 – 4020 – 4000
⚠️ Risk Management Notes
Expect liquidity sweeps near 4068 before the U.S. session. Wait for lower-timeframe confirmation (ChoCH / BOS) before entry.
Volatility may spike around the Fed minutes, so partial profits and tight stop management are advised.
✅ Summary
Gold remains structurally bullish above 3960, with intraday retracements likely before continuation.
Ryan_TitanTrader anticipates buy reactions around 3970 and short-term rejections at 4068, aligning with the current SMC structure and macro catalysts ahead of FOMC updates.
🔔 Follow Ryan_TitanTrader for live setups, liquidity plays, and real-time gold structure updates!

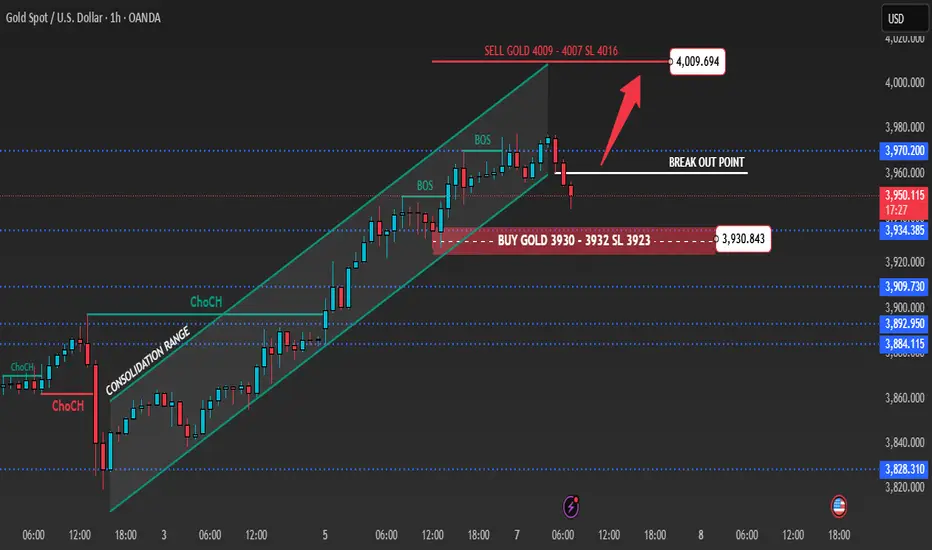
Gold 1H – Pullback Expected Before Key CPI Data💎 XAUUSD – Intraday Trading Plan | Ryan_TitanTrader
📈 Market Context
Gold is stabilizing below the $4,000 mark as traders await this week’s U.S. CPI data and fresh remarks from the Federal Reserve. After a strong multi-week rally, the metal is showing early exhaustion near premium liquidity zones, where engineered pullbacks often occur before continuation.
While the mid-term bias remains bullish, several analysts — including those from Citi and UBS — caution that gold could face short-term corrections if the dollar regains strength. The market continues to price in around a 65% probability of a December rate cut, keeping volatility elevated and sentiment uncertain.
🔎 Technical Analysis (H1/H4)
Price has slipped slightly below the ascending channel after consecutive BOS signals, indicating a potential short-term retracement before resuming the uptrend.
🟢 Buy Zone: 3932–3930 (Breakout & FVG zone) – an ideal discount area where buyers may re-enter the market.
🔴 Sell Zone: 4009–4007 (Premium liquidity) – a key region for short setups if price rejects strongly.
🔑 Key Levels
• BUY Zone: 3932–3930 (main support 3923)
• SELL Zone: 4009–4007 (liquidity reaction area)
• Psychological Resistance: 4000
💡 Trading Scenarios & Plan
🟢 BUY ZONE: 3932–3930
SL: 3923
TP: 3945 – 3955 – 3965 – 3975 – 3980+
🔴 SELL ZONE: 4009–4007
SL: 4016
TP: 3995 – 3980 – 3975 – 3965 – 3955
⚠️ Risk Management Notes
The 4000–4010 region acts as a high-liquidity magnet, where false breakouts and engineered sweeps may occur before reversals.
Wait for lower-timeframe confirmation (BOS or rejection candle) before entry.
Avoid overleveraging ahead of CPI — expect volatility spikes and rapid shifts in sentiment.
✅ Summary
Gold remains structurally bullish but vulnerable to intraday retracements near 4009–4007. Ryan_TitanTrader anticipates potential buy reactions from 3932–3930 and short-term rejections near 4009–4007. Holding above 3923 keeps the bullish outlook intact with upside targets toward 3970–3980.
🔔 Follow Ryan_TitanTrader for real-time updates, live setups, and advanced SMC insights as gold reacts to CPI data this week!
Gold Neowave UpdateNamaskaram Everyone
Welcome to intelligent investor, we provide market insights by synchronising and combining all the price action waves from different time frames and gives you single trend.
Degree Information
FX:XAUUSD OANDA:XAUUSD FOREXCOM:XAUUSD

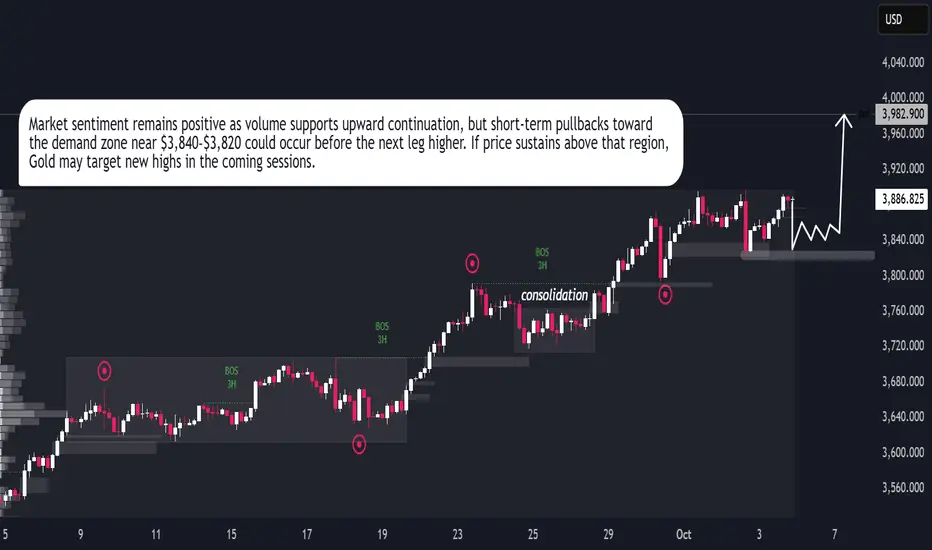
GOLD → Structural Rebalance Before Next Bullish LegGOLD → Structural Rebalance Before Next Bullish Leg
Gold remains in a strong bullish structure, showing consistent higher highs and steady momentum after each correction. The market has been consolidating above the $3,800 zone, where buyers continue to absorb liquidity and prevent deeper declines. This zone acts as a solid base for potential upward expansion. Current market behavior indicates controlled accumulation, suggesting that institutional buyers are maintaining dominance. If gold holds above $3,840–$3,820, the next bullish leg may target the $3,960–$4,000 region. A short-term retracement could occur, but overall momentum favors continuation. The price structure and volume behavior both support further upside, reflecting strong buyer control and stable sentiment in the market.
Gold 1H – Liquidity Plays Between 3794 and 3918Gold on the 1H timeframe is fluctuating within a defined range after multiple ChoCH signals, with liquidity concentrated at both premium supply and discount demand. Current price action suggests engineered sweeps remain likely: upside liquidity sits near 3918–3916, while downside support aligns with 3794–3796. This dual structure sets up both tactical sell and buy plays depending on liquidity grabs.
From the macro perspective, gold traders are balancing caution ahead of upcoming U.S. data releases with the backdrop of a resilient dollar and persistent geopolitical risks. These drivers reinforce intraday volatility, where engineered liquidity hunts at extremes provide clearer opportunities.
⸻
📌 Key Structure & Liquidity Zones (1H):
• 🔴 SELL GOLD 3918–3916 (SL 3925): Premium supply sweep zone. Downside targets at 3896 → 3872 → 3853.
• 🟢 BUY GOLD SUPPORT 3794–3796 (SL 3788): Discount demand aligned with structural lows. Upside targets at 3819 → 3853 → 3872+.
⸻
📊 Trading Ideas (Scenario-Based):
🔻 Sell Setup – Liquidity Grab at 3918–3916
• Entry: 3918–3916
• Stop Loss: 3925
• Take Profits:
• TP1: 3896
• TP2: 3872
• TP3: 3853
🔺 Buy Setup – Discount Demand at 3794–3796
• Entry: 3794–3796
• Stop Loss: 3788
• Take Profits:
• TP1: 3819
• TP2: 3853
• TP3: 3872+
⸻
🔑 Strategy Note
Gold remains liquidity-driven and range-bound, with engineered sweeps expected at both premium highs and discount lows. Flexibility is crucial: fade rallies into the 3918 supply zone, while preparing to scale into longs if liquidity clears into the 3794 demand base.

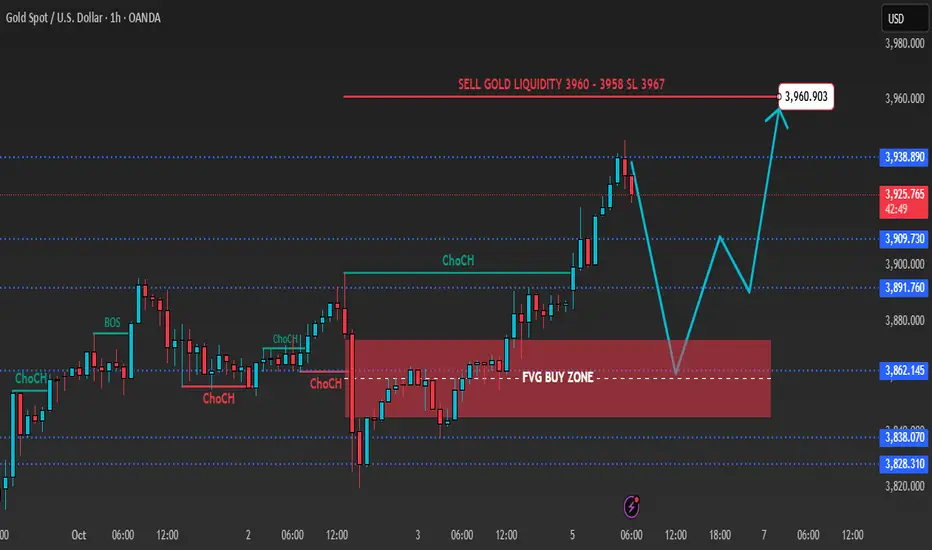
Gold 1H – Will CPI Repricing Push Gold Into FVG Reversal?Gold on the 1H timeframe is reacting near 3,928 after a clean structure break and buildup toward the premium zone 3960–3958, where liquidity remains above recent highs. Market structure shows a bullish impulse leg forming, but engineered sweeps at premium supply are likely before continuation. The defined FVG buy zone around 3840–3842 marks discount territory for potential re-entry if price retraces deeper.
From the macro side, gold is consolidating as traders brace for this week’s U.S. CPI data and renewed Treasury yield volatility. The dollar’s firm tone and cautious risk sentiment following stronger U.S. job figures are keeping gold capped near short-term supply. Still, geopolitical tensions and central-bank demand continue to provide underlying support, reinforcing the buy-on-dip narrative toward year-end.
________________________________________
📌 Key Structure & Liquidity Zones (1H):
• 🔴 SELL GOLD 3960–3958 (SL 3967): Premium liquidity sweep zone targeting retracement toward 3940 → 3900.
• 🟢 BUY ZONE 3840–3842 (SL 3833): Discount demand and FVG mitigation aligned with higher-timeframe support. Upside targets 3860 → 3880 → 3900+.
________________________________________
📊 Trading Ideas (Scenario-Based):
🔻 Sell Setup – Liquidity Sweep at 3960–3958
• Entry: 3960–3958
• Stop Loss: 3967
• Take Profits:
• TP1: 3940
• TP2: 3920
• TP3: 3900
🔺 Buy Setup – FVG Mitigation at 3840–3842
• Entry: 3840–3842
• Stop Loss: 3833
• Take Profits:
• TP1: 3860
• TP2: 3880
• TP3: 3900+
________________________________________
🔑 Strategy Note
Gold remains liquidity-driven within a mid-range structure. Expect engineered sweeps into 3960–3958 before deeper pullbacks into discount demand near 3840–3842. Tactical bias favors fading rallies at premium while preparing to join the continuation move from discount FVG support if CPI-related volatility clears the liquidity pools.