Gold dips again – is the bounce just a trap?Hello traders!
After a quiet start to the day, gold has turned lower and is now hovering around the $3,300 mark. The decline in OANDA:XAUUSD came as U.S. Treasury yields rose in response to strong U.S. economic data. The Fed is widely expected to maintain its current monetary policy stance during today’s session.
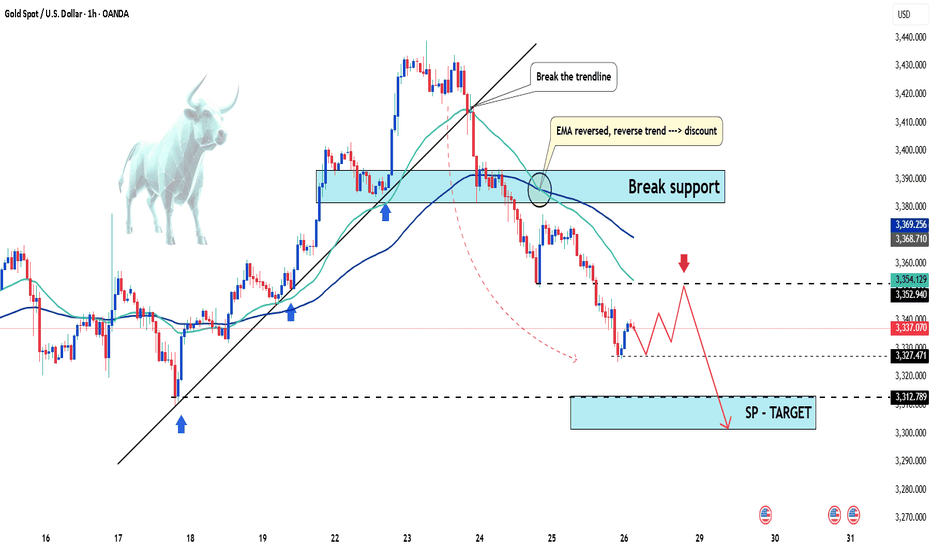
From a technical perspective, XAUUSD continues to form bearish structures and breakdowns. While a short-term bullish correction is currently underway, the bears still hold the upper hand — and selling opportunities remain the preferred strategy.
I’ll be focusing on two key entry zones marked on the chart, with a short-term bias favoring sell setups.
Do you agree with this approach?
⚠️ Please remember: This is just a trading idea — make sure to manage your risk properly with defined TP and SL levels.
Good luck and happy trading!
Commodities
Gold Trading Strategy XAUUSD July 31, 2025Yesterday's trading session, after breaking the rising price channel in the 3318 - 3320 area, the gold price fell sharply to the 3269 area.
Basic news: US Treasury yields fell and the weak US labor market report could boost investor demand. Data released by the US Department of Labor on Tuesday showed that the number of new jobs fell in June after 2 consecutive months of increase. Today, the Federal Reserve will announce a new interest rate decision.
Technical analysis: The rising price channel in the H1 frame was broken, and the gold price immediately fell sharply. Currently, the downtrend of gold is still maintained. The MA lines are still resistance for gold prices.
Important price zones today: 3300 - 3305, 330 - 3325 and 3267 - 3272.
Today's trading trend: SELL.
Recommended orders:
Plan 1: SELL XAUUSD zone 3303 - 3305
SL 3308
TP 3300 - 3290 - 3280 - 3270.
Plan 2: SELL XAUUSD zone 3323 - 3325
SL 3328
TP 3320 - 3310 - 3290 - 3280.
Plan 3: BUY XAUUSD zone 3267 - 3269
SL 3264
TP 3272 - 3282 - 3292 - 3302 (small volume).
Wish you a safe, favorable and profitable trading day.🌟🌟🌟🌟🌟
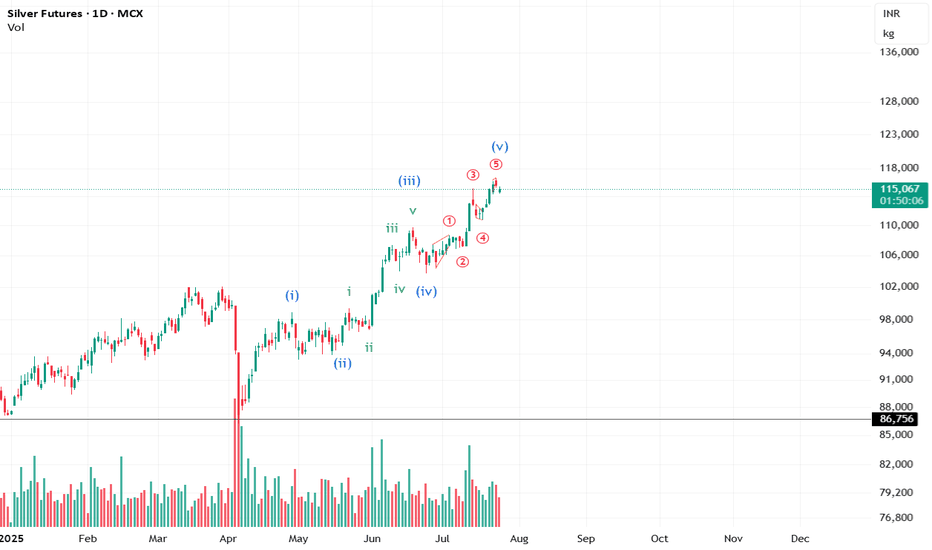
#Silver up for another short sell move?Silver is currently completing the 4th wave and may witness a down move in the short term. Keeping my eyes glued. :)
**This is an educational market outlook, not investment advice. Please consult a SEBI-registered advisor before taking any investment decisions.**
MCX Silver Powers Through Pattern Targets – Momentum Continues#Update | #MCXSilver
On Dec 27, 2022 , we identified a bullish flag pattern when Silver was trading around 69,845 . A follow-up update was shared on Apr 4, 2025 , with prices near 87,878 .
Since then, MCX Silver moved up and touched a high of 1,16,641 on Jul 14, 2025 , meeting the projected zone of the earlier chart pattern — a move of 67% from the initial post and +32% from the April update.
At present, Silver is trading within an ascending channel on the long-term charts — a structure often associated with a sustained trend.
Stay tuned — this could just be the beginning!
⚠️ This is a technical observation shared for educational purposes only. Not a buy/sell recommendation. Please consult your financial advisor before making any trading decisions.
#Silver | #MCX | #TechnicalAnalysis | #PriceAction | #Commodities | #TrendAnalysis | #ChartPatterns
Gold price analysis before FOMC Looking at current price action, after sharp decline we witnessed earlier. Gold has found support around the monthly open level between 3300-3310, which is acting as a solid support zone right now. now price is attempting to climb higher with the help of ascending trendline, but it's running into resistance at the weekly open around 3329-31.
If we can see a clean breakout above this weekly resistance, I'd expect gold to make a move toward the 3350 level as the next logical target. Beyond that, we've got the pivot at 3367 which will likely serve as a stronger resistance barrier. On the downside, our immediate support remains at that trendline, with the major support zone at 3300 acting as our safety net.
Today's Fed interest rate decision is the major market mover event;;that could dictate gold next directional move. Personally, I'm leaning toward seeing some upward momentum today, but the real test will be whether price can hold those higher levels or if we'll see rejection and another leg down. The key is watching how gold reacts to whatever the Fed delivers and whether buyers can step in with conviction at these elevated levels. It's definitely a day to stay alert and let the market show its hand before making any big moves.
Silver at Multiple Confluence ResistanceSilver came up to a confluence of three Channel Resistances on all major timeframes i.e. Monthly, Weekly & Daily. Near term support currently is only the Daily Channel Support line & the last breakout attempt on D1 has failed to a certain extent. Should big volatility be expected? A break of such strong resistance may signal strong bullish momentum but can the support hold under such conditions.
Breaking 3322, gold price continues to recoverPlan XAU day: 29 July 2025
Related Information:!!!
Gold prices (XAU/USD) advance to a new intraday high during the first half of the European session on Tuesday, recovering from the nearly three-week low around the $3,300 level reached the previous day. As market participants absorb the latest wave of trade-related optimism, lingering uncertainty ahead of this week’s key central bank events and high-impact US macroeconomic releases continues to lend support to the safe-haven precious metal.
At the same time, the US Dollar (USD) has eased slightly from its highest level since June 23, providing an additional tailwind for gold. Nonetheless, the increasingly widespread expectation that the Federal Reserve (Fed) will maintain elevated interest rates for an extended period is likely to limit any significant USD correction. Consequently, this may act as a headwind for the XAU/USD pair as attention turns to the highly anticipated FOMC meeting set to commence later today.
personal opinion:!!!
Gold price recovered, broke 3322. Good buying power, continued to recover and accumulate above 3300
Important price zone to consider : !!!
Support zone point: 3322, 3302 zone
Sustainable trading to beat the market
Gold XAUUSD Trading Strategy July 29, 2025Gold XAUUSD Trading Strategy July 29, 2025:
Yesterday's trading session, gold prices continued to fall as expected. After approaching the resistance area of 3300, gold prices are recovering.
Basic news: The market is almost unlikely to see the possibility of the FED cutting interest rates in July and about 40% chance that the FED will continue to keep interest rates unchanged in September, up from about 10% the previous month. US non-farm payrolls are likely to continue to increase rapidly, showing a rapid recovery in the labor market.
Technical analysis: Gold prices continue to stick with the MA lines, the downtrend channel has not been broken. Currently, the 3280 - 3285 area may be a support area for gold prices to recover after the previous sharp decline. We will mainly trade according to the short-term trend and wait for a long-term buying point.
Important price zones today: 3330 - 3335, 3350 - 3355 and 3280 - 3285.
Today's trading trend: SELL.
Recommended orders:
Plan 1: SELL XAUUSD zone 3333 - 3335
SL 3338
TP 3330 - 3320 - 3300 - 3280.
Plan 2: SELL XAUUSD zone 3353 - 3355
SL 3358
TP 3350 - 3340 - 3320 - 3300.
Plan 3: BUY XAUUSD zone 3283 - 3285
SL 3280
TP 3288 - 3300 - 3320 - 3340 - Open.
Wish you a safe, successful and profitable trading day.💗💗💗💗💗
GOLD: Is This Just the Calm Before a Bigger Move? – GOLD: Is This Just the Calm Before a Bigger Move?
Gold has dropped nearly $50 in the last 4 sessions — showing strong bearish momentum, but is the downside exhausted? Or is this just a pause before continuation?
🔍 Macro Drivers:
Recent US–EU defense and trade agreements have weighed on gold's safe-haven appeal.
Strong US economic data has pushed USD and equities higher, redirecting flows out of precious metals.
Market sentiment is leaning short-term risk-on, which is bearish for gold – but key technical levels are approaching.
📊 Technical Context – H12 Structure:
Price broke below 3,342 key support, retested it and rejected — validating short-term supply zone.
Price is now consolidating between Sell-side liquidity (3,301–3,292) and deeper FVG/OBS zone around 3,270.
Above, multiple sell zones align at Fib 0.5–0.618 retracement with order blocks and fair value gaps.
🔧 Trade Scenarios (Plan for Reaction – Not Prediction):
🟢 BUY SCALP – Quick bounce off demand zone
Entry: 3,292 – 3,290
SL: 3,285
TPs: 3,296 → 3,300 → 3,305 → 3,310 → 3,315 → 3,320 → 3,325 → 3,330
📍Low-risk intraday bounce play from liquidity pocket
🟢 BUY SWING – Deeper test of FVG/OBS zone
Entry: 3,272 – 3,270
SL: 3,265
TPs: 3,276 → 3,280 → 3,284 → 3,288 → 3,292 → 3,294 → 3,300 → open
📍Higher R:R setup if price sweeps final liquidity zone
🔴 SELL SCALP – Rejection from short-term resistance
Entry: 3,340 – 3,342
SL: 3,346
TPs: 3,335 → 3,330 → 3,325 → 3,320 → 3,310
📍Reaction-based trade if price fails to reclaim the zone
🔴 SELL SWING – Deeper pullback into macro zone
Entry: 3,370 – 3,372
SL: 3,376
TPs: 3,365 → 3,360 → 3,355 → 3,350 → 3,345 → 3,340 → 3,330 → 3,320
📍FVG + CP zone overlap with strong OB; ideal for patient sellers
⚠️ Risk Notes:
Watch for false breakouts/liquidity traps near session opens.
Wait for price confirmation; reaction over prediction.
Maintain disciplined risk management – this is a volatile area.
🧭 I’ll be tracking price behavior at these zones closely.
If this approach to mapping price action resonates with you —
Feel free to stay connected or share your bias in the comments.
Gold dives toward 3,320 as Fed decision loomsHello everyone, what are your thoughts on gold prices?
Gold's decline is accelerating, dragging the precious metal down toward the 3,320 USD mark. A stronger U.S. dollar and further developments on the trade front following the U.S.-EU agreement have significantly impacted demand for safe-haven assets.
From a technical perspective, the break below the rising price channel could mark the beginning of a deeper correction. Oscillators on the chart have just started turning negative, suggesting that the path of least resistance for gold is now downward.
Looking ahead, Wednesday’s key FOMC decision—along with the accompanying policy statement and Powell’s press conference—will be closely scrutinized for clues on the Fed’s interest rate cut roadmap.
Additionally, investors will face several important U.S. macroeconomic data releases this week, which will play a vital role in shaping the USD’s trajectory and provide new momentum for XAUUSD.
What do you think about the precious metal? Share your thoughts below!
Trendline Support Pattern in Natural GasNatural Gas is currently respecting a well-established horizontal trendline support zone around the 264–265 level. As seen in the chart, price has tested this area multiple times, indicating strong demand and buyer interest at this zone.
📉 The recent candles show rejection from the support, suggesting a potential bounce. If this level continues to hold, we may see an upward move toward the 267–270 resistance area.
📌 Trade Idea:
Entry: Near 265.3
Stop-loss: Below 262.8 (structure break)
Target: 267.1 and above for short-term move
🧠 Watch for confirmation with volume or bullish candlestick formations before entering the trade.
Gold price accumulation, price reduction rangePlan XAU day: 28 July 2025
Related Information:!!!
Gold prices (XAU/USD) have stalled their intraday rebound from a more than one-week low and are trading around the $3,335 level during the early European session on Monday, marking a decline for the third consecutive day. Renewed strength in the US Dollar (USD) continues to weigh on the precious metal, serving as a primary headwind. Additionally, a broadly positive market sentiment—supported by recent trade-related optimism—is further limiting the upside potential for the safe-haven asset.
That said, USD bulls may exercise caution and refrain from initiating aggressive positions ahead of further clarity on the Federal Reserve’s (Fed) monetary policy outlook. As such, market participants are expected to closely monitor the outcome of the upcoming two-day FOMC meeting concluding on Wednesday, which is likely to influence USD dynamics and provide fresh directional impetus for non-yielding gold. Moreover, this week’s key US macroeconomic data releases will be instrumental in determining the next leg of movement for the XAU/USD pair
personal opinion:!!!
Very important news this week, gold price is forecast to continue to fall sharply below 3300 with the almost certain result that the FED will continue to keep the current interest rate unchanged.
Important price zone to consider : !!!
resistance zone point: 3340, 3358 zone
Sustainable trading to beat the market
Gold (XAU/USD) Daily Trading Plan - 28th July 2025🔺 Technical Analysis
Gold started the Asian trading week with a small pullback, testing the 0.382 Fibonacci Retracement level. However, it quickly bounced back strongly to last week's closing price, which was around 3339. This movement confirms the price action from a technical point of view.
Importantly, gold has broken above a minor resistance on the M15 timeframe. This cancels out the previous bearish pattern and has formed a strong H1 candle. This indicates that a potential corrective uptrend might begin now.
On the Daily timeframe, the initial dip in the session retested the bullish trendline and bounced back within the boundaries of the flag pattern. It is likely that this week, the price will continue moving towards the end of this pattern, which will give a clearer confirmation of the medium-term trend.
🔺 Key Macroeconomic News
This week is expected to be quite volatile due to several important economic announcements, especially as it's the end of one month and the start of a new one. Traders should pay close attention to two key events:
FOMC Interest Rate Decision: This is always a major focus for the market and has a big impact on safe-haven assets like gold.
Non-Farm Payroll (NFP) Report: This is crucial US labour market data, and it can cause significant movements in both the US Dollar (USD) and gold.
Therefore, be ready for possible market shocks and make sure to manage your risks carefully.
📈 Trading Strategy & Considerations
Considering the current technical setup and the upcoming macroeconomic events, here are some points to keep in mind:
Possible Corrective Uptrend: The cancelled bearish pattern on M15 and the strong H1 candle suggest a short-term bullish bias for a corrective move.
Daily Flag Pattern: Keep an eye on how the price behaves as it approaches the end of the flag pattern on the Daily timeframe. This will help confirm the medium-term trend.
High Volatility Expected: Be extremely cautious around the FOMC and NFP announcements. These events can lead to large and quick price changes.
Risk Management: It's very important to manage your risks strictly. Consider reducing your position sizes or using wider stop-losses during high-impact news events.
Disclaimer: This analysis is only for information purposes and should not be considered financial advice. Trading involves significant risk, and you should only trade with money you can afford to lose.
Latest Gold Price Update TodayIn the most recent trading session, global gold prices dropped over 31 USD per ounce, closing at 3,337 USD. This sharp decline follows a three-day rally and reflects profit-taking by investors and a shift in capital flow.
Newly released economic indicators show that the U.S. labor market remains strong, with jobless claims falling for the sixth consecutive week — the longest streak since 2022. This helped the U.S. dollar rebound slightly, putting pressure on gold, a non-yielding asset.
At the same time, investor sentiment has tilted toward riskier assets like equities, as trade talks between the U.S., EU, and Japan show positive progress. Stock markets in the U.S. and Europe surged, drawing capital away from gold.
Although expectations remain for a potential Fed rate cut in September, gold faces short-term headwinds. The 3,300 USD zone is now a key level to watch. Traders should look for reversal signals and volume confirmation before considering long entries.
Personal view: USD strength, rising stock markets, and profit-taking are creating a short-term correction for gold. However, in the longer term, there is still upside potential if the Fed signals a policy shift in the coming months.
And you — what’s your take on gold prices today?
Natural Gas Technical Breakdown Ahead? Eyes on the 264.90 Mark#Commodity
#NaturalGas View:
CMP: 271.70
🔹 Resistance Levels:
• 270.70 – 273.40
• 275.00
• 284.00
🔹 Support Level:
• 264.90
Technical View:
Natural Gas seems to be forming a bearish flag pattern on the hourly & 4 hours chart. The price is currently facing resistance at the pink trendline breakdown level. While it's still early for confirmation, a decisive hourly close below 264.90 may validate the pattern and open the door for further downside. If the pattern plays out, a possible target zone around 220 could be in sight.
📌 Note: This is a technical analysis view shared for educational purposes only and not a recommendation to buy/sell. Always consult your financial advisor before making any trading decisions.
#Commodity | #NaturalGas | #MCX | #PriceAction
Gold holds steady—Is a breakout above $3,400 next?Gold prices have corrected exactly as we anticipated yesterday. At the time of writing, gold is hovering around $3,370 USD, showing little volatility since the start of the session.
Although the market is undergoing a short-term pullback, I still believe gold remains in a medium- to long-term uptrend. One key reason is the global shift away from the US dollar, with many countries increasing their gold reserves. Meanwhile, the USD is projected to weaken further in the long run. On top of that, if the Federal Reserve indeed begins to ease monetary policy, gold could break above the $3,400 level and potentially set a new record.
In addition, trendline support remains intact—if momentum picks up from here, the bullish trend may soon resume.
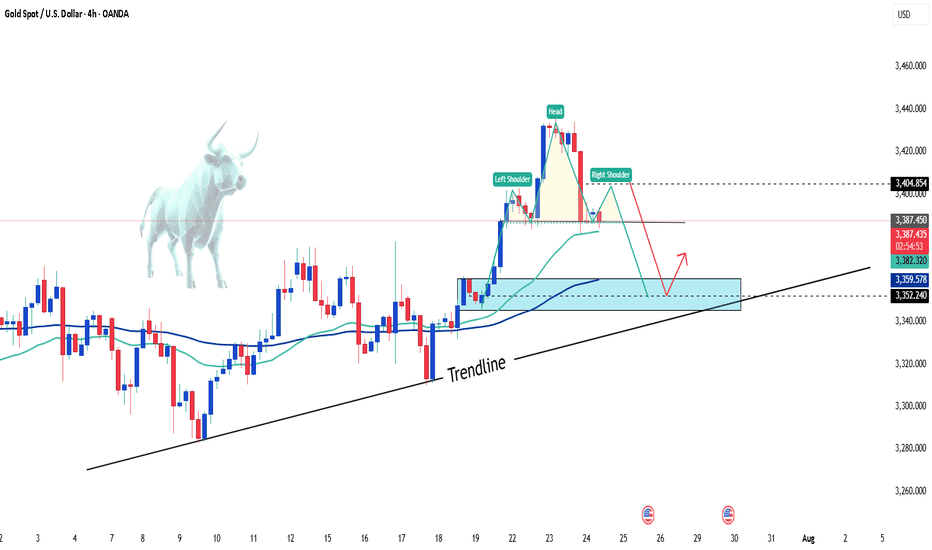
Gold takes a break – what's next?After Tuesday’s strong breakout, XAUUSD is now consolidating just as we expected yesterday. The price is hovering around 3,385 USD and is forming a head and shoulders pattern.
Technically speaking: If gold continues to hold the 3,350 USD support zone and the trendline, the bullish outlook remains intact. At this stage, gold is simply "taking a break" before its next move.
I'm still optimistic about gold’s potential — how about you?
Is the move over for Silver? #CommodityIt looks like the impulse for Silver is about to end. However, we still need the price action to confirm the view.
**This analysis is based on the Elliott Wave Principle.
This analysis is for educational purposes only and not investment advice.
Please consult your SEBI-registered advisor before making any investment decisions. Markets are subject to risk.**
Gold Trading Strategy XAUUSD July 24, 2025Gold Trading Strategy XAUUSD July 24, 2025:
Yesterday's trading session, after rising to the 343x area, created a double-top pattern and fell sharply at the beginning of today's trading session.
Basic news: The EU is close to a 15% tariff agreement with the United States. The yield on 10-year US Treasury bonds fell more than 5 basis points to 4.332% before recovering to 4.364% but is still very low. The US real yield also fell 4.5 basis points to 1.932%.
Technical analysis: Gold prices fell sharply after forming a double-top pattern at the 343x area. RSI H1 is approaching the oversold area; RSI H4 and D1 are currently showing signs of correction to the average line. We will wait for the recovery of gold prices and continue trading at resistance areas.
Important price zones today: 3400 - 3405, 3420- 3425 and 3360 - 3365.
Today's trading trend: SELL.
Recommended orders:
Plan 1: SELL XAUUSD zone 3400 - 3402
SL 3405
TP 3397 - 3387 - 3377 - 3367.
Plan 2: SELL XAUUSD zone 3420 - 3422
SL 3425
TP 3417 - 3407 - 3387 - 3367.
Plan 3: BUY XAUUSD zone 3363 - 3365
SL 3360
TP 3368 - 3378 - 3388 - 3400.
Wish you a safe, favorable and profitable trading day.🌟🌟🌟🌟🌟
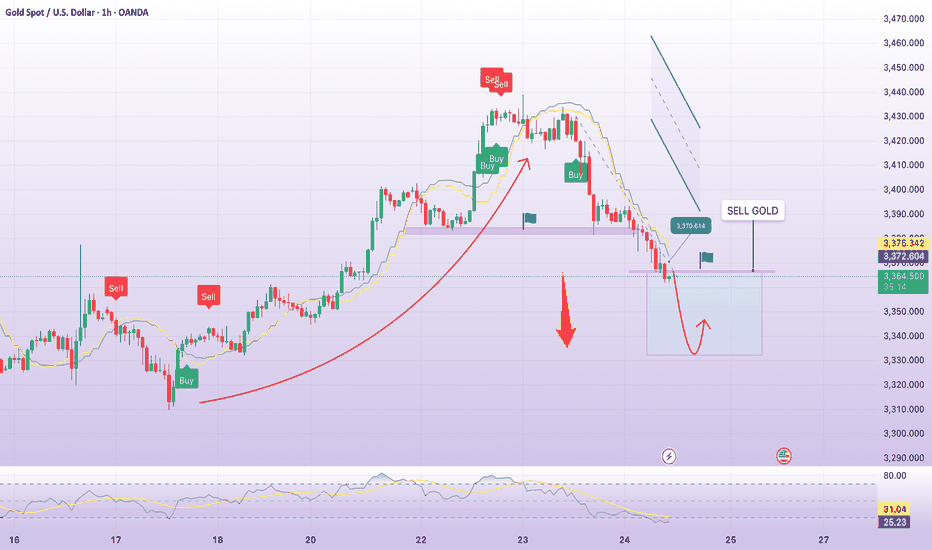
SELL GOLD 3370 ! downtrend todayPlan XAU day: 24 July 2025
Related Information:!!!
US President Donald Trump announced late Tuesday that his administration had reached a trade agreement with Japan. In addition, reports suggesting progress toward a 15% trade deal between the United States and the European Union have bolstered investor confidence, exerting downward pressure on the safe-haven appeal of gold for the second consecutive session on Thursday.
Despite President Trump’s persistent calls for lower borrowing costs, markets do not anticipate an interest rate cut from the Federal Reserve in July. In fact, President Trump has continued his public criticism of Fed Chair Jerome Powell, including personal attacks on his stance regarding interest rates and repeated calls for his resignation.
personal opinion:!!!
Tariff negotiations between countries and the US, the catalyst for the sharp drop in gold prices, continued selling pressure.
Important price zone to consider : !!!
resistance zone point: 3370 zone
Sustainable trading to beat the market
Gold :Back in range , again ??We have seen solid rally over the last two weeks, but that momentum seems to be losing steam. In yesterday’s session, price faced a sharp rejection near 3440 (Near to major resistance of 3450) and closed below the key 3400 level which is a clear warning sign for the bulls. Even though price is still holding above last week’s high (around 3377) and Weekly R1, the failure to sustain above 3400 weakens the bullish structure. If gold dips back below last week’s high, it could open the door for deeper correction and possibly trigger more selling pressure.
On the upside, a decisive move and close above 3400 is needed for buyers to regain control and attempt another leg higher. Until then, upside looks capped and short-term sentiment has turned cautious. Immediate support now lies around 3345, which is also the weekly pivot level, followed by 3333.
The price action suggests that gold may be slipping back into a range-bound phase, with no clear directional strength unless key levels break decisively. For now, the bias remains neutral to slightly bearish unless we see a strong reclaim of 3400 with momentum.
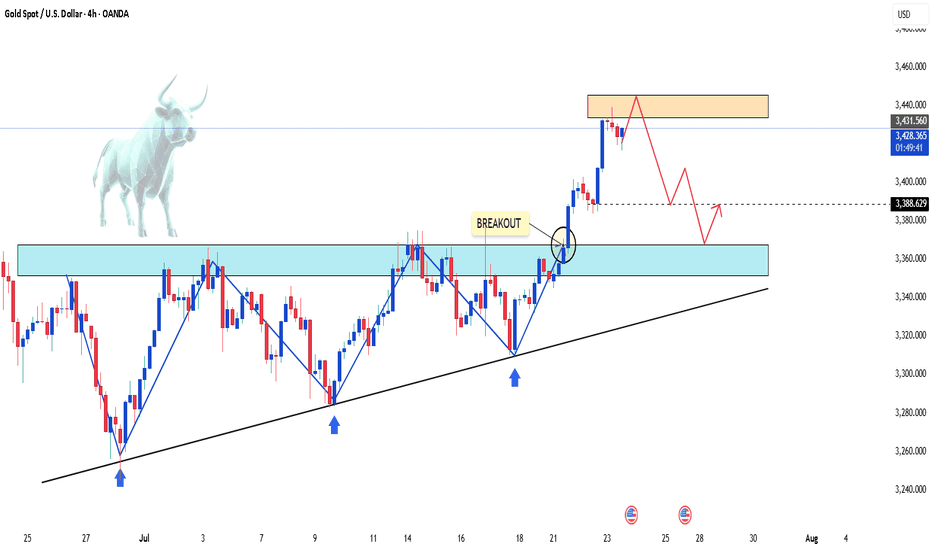
Gold Breaks $3,400 – Bullish Momentum BuildsGold is gaining strong upside momentum, breaking above the $3,400 mark to hit a fresh five-week high.
This sharp rally in the precious metal comes alongside a renewed pullback in the US dollar. Declining Treasury yields across the curve and ongoing trade tensions are also fueling gold’s recovery as a safe-haven asset.
Currently trading around $3,426, gold may see a slight pullback to consolidate before resuming its bullish run.
What’s your take on gold today?
Gold surges with explosive breakoutGold prices launched into a powerful rally yesterday, soaring from $3,350 to nearly $3,400 — a stunning $50 move, equivalent to 500 pips.
This surge was supported by a weakening US Dollar and a drop in the 10-year Treasury yield, which fell to its lowest level in over a week. On the macro front, if the Federal Reserve signals an earlier-than-expected rate cut, the bullish momentum could extend further in the long term.
Technical outlook: The H2 chart reveals a strong breakout after gold successfully breached the $3,372 resistance zone ( as highlighted in yesterday’s strategy ). Price is now completing a pullback, which may serve as the base for the next bullish wave.
Do you agree with this view? Share your thoughts and let’s discuss together.
Good luck with your trades! ✨


