Latest Gold Price Update TodayIn the most recent trading session, global gold prices dropped over 31 USD per ounce, closing at 3,337 USD. This sharp decline follows a three-day rally and reflects profit-taking by investors and a shift in capital flow.
Newly released economic indicators show that the U.S. labor market remains strong, with jobless claims falling for the sixth consecutive week — the longest streak since 2022. This helped the U.S. dollar rebound slightly, putting pressure on gold, a non-yielding asset.
At the same time, investor sentiment has tilted toward riskier assets like equities, as trade talks between the U.S., EU, and Japan show positive progress. Stock markets in the U.S. and Europe surged, drawing capital away from gold.
Although expectations remain for a potential Fed rate cut in September, gold faces short-term headwinds. The 3,300 USD zone is now a key level to watch. Traders should look for reversal signals and volume confirmation before considering long entries.
Personal view: USD strength, rising stock markets, and profit-taking are creating a short-term correction for gold. However, in the longer term, there is still upside potential if the Fed signals a policy shift in the coming months.
And you — what’s your take on gold prices today?
Commodities

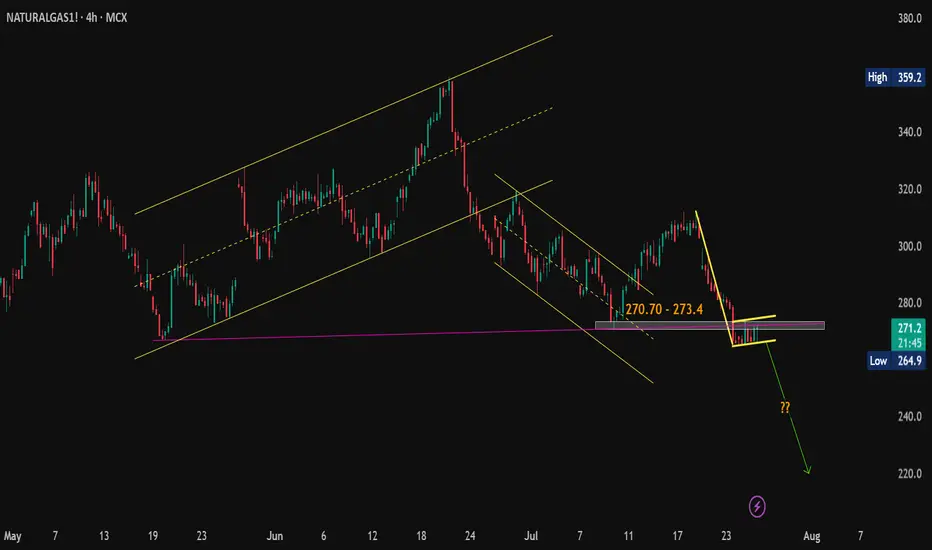
Natural Gas Technical Breakdown Ahead? Eyes on the 264.90 Mark#Commodity
#NaturalGas View:
CMP: 271.70
🔹 Resistance Levels:
• 270.70 – 273.40
• 275.00
• 284.00
🔹 Support Level:
• 264.90
Technical View:
Natural Gas seems to be forming a bearish flag pattern on the hourly & 4 hours chart. The price is currently facing resistance at the pink trendline breakdown level. While it's still early for confirmation, a decisive hourly close below 264.90 may validate the pattern and open the door for further downside. If the pattern plays out, a possible target zone around 220 could be in sight.
📌 Note: This is a technical analysis view shared for educational purposes only and not a recommendation to buy/sell. Always consult your financial advisor before making any trading decisions.
#Commodity | #NaturalGas | #MCX | #PriceAction
Gold holds steady—Is a breakout above $3,400 next?Gold prices have corrected exactly as we anticipated yesterday. At the time of writing, gold is hovering around $3,370 USD, showing little volatility since the start of the session.
Although the market is undergoing a short-term pullback, I still believe gold remains in a medium- to long-term uptrend. One key reason is the global shift away from the US dollar, with many countries increasing their gold reserves. Meanwhile, the USD is projected to weaken further in the long run. On top of that, if the Federal Reserve indeed begins to ease monetary policy, gold could break above the $3,400 level and potentially set a new record.
In addition, trendline support remains intact—if momentum picks up from here, the bullish trend may soon resume.
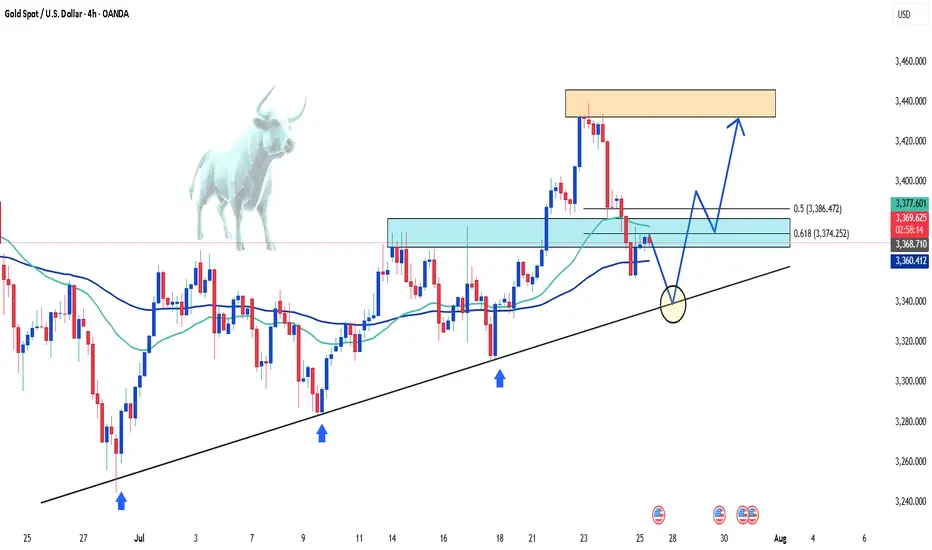
Gold takes a break – what's next?After Tuesday’s strong breakout, XAUUSD is now consolidating just as we expected yesterday. The price is hovering around 3,385 USD and is forming a head and shoulders pattern.
Technically speaking: If gold continues to hold the 3,350 USD support zone and the trendline, the bullish outlook remains intact. At this stage, gold is simply "taking a break" before its next move.
I'm still optimistic about gold’s potential — how about you?

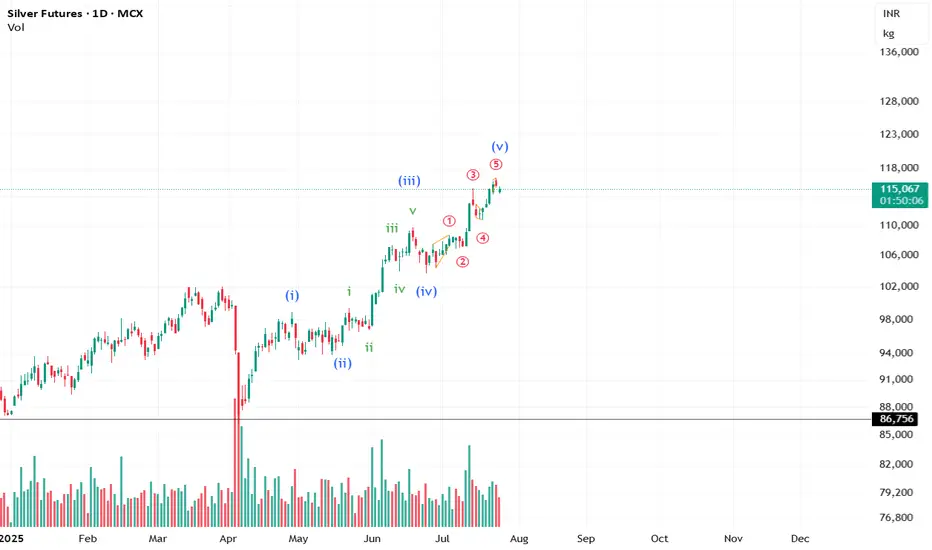
Is the move over for Silver? #CommodityIt looks like the impulse for Silver is about to end. However, we still need the price action to confirm the view.
**This analysis is based on the Elliott Wave Principle.
This analysis is for educational purposes only and not investment advice.
Please consult your SEBI-registered advisor before making any investment decisions. Markets are subject to risk.**
Gold Trading Strategy XAUUSD July 24, 2025Gold Trading Strategy XAUUSD July 24, 2025:
Yesterday's trading session, after rising to the 343x area, created a double-top pattern and fell sharply at the beginning of today's trading session.
Basic news: The EU is close to a 15% tariff agreement with the United States. The yield on 10-year US Treasury bonds fell more than 5 basis points to 4.332% before recovering to 4.364% but is still very low. The US real yield also fell 4.5 basis points to 1.932%.
Technical analysis: Gold prices fell sharply after forming a double-top pattern at the 343x area. RSI H1 is approaching the oversold area; RSI H4 and D1 are currently showing signs of correction to the average line. We will wait for the recovery of gold prices and continue trading at resistance areas.
Important price zones today: 3400 - 3405, 3420- 3425 and 3360 - 3365.
Today's trading trend: SELL.
Recommended orders:
Plan 1: SELL XAUUSD zone 3400 - 3402
SL 3405
TP 3397 - 3387 - 3377 - 3367.
Plan 2: SELL XAUUSD zone 3420 - 3422
SL 3425
TP 3417 - 3407 - 3387 - 3367.
Plan 3: BUY XAUUSD zone 3363 - 3365
SL 3360
TP 3368 - 3378 - 3388 - 3400.
Wish you a safe, favorable and profitable trading day.🌟🌟🌟🌟🌟

SELL GOLD 3370 ! downtrend todayPlan XAU day: 24 July 2025
Related Information:!!!
US President Donald Trump announced late Tuesday that his administration had reached a trade agreement with Japan. In addition, reports suggesting progress toward a 15% trade deal between the United States and the European Union have bolstered investor confidence, exerting downward pressure on the safe-haven appeal of gold for the second consecutive session on Thursday.
Despite President Trump’s persistent calls for lower borrowing costs, markets do not anticipate an interest rate cut from the Federal Reserve in July. In fact, President Trump has continued his public criticism of Fed Chair Jerome Powell, including personal attacks on his stance regarding interest rates and repeated calls for his resignation.
personal opinion:!!!
Tariff negotiations between countries and the US, the catalyst for the sharp drop in gold prices, continued selling pressure.
Important price zone to consider : !!!
resistance zone point: 3370 zone
Sustainable trading to beat the market

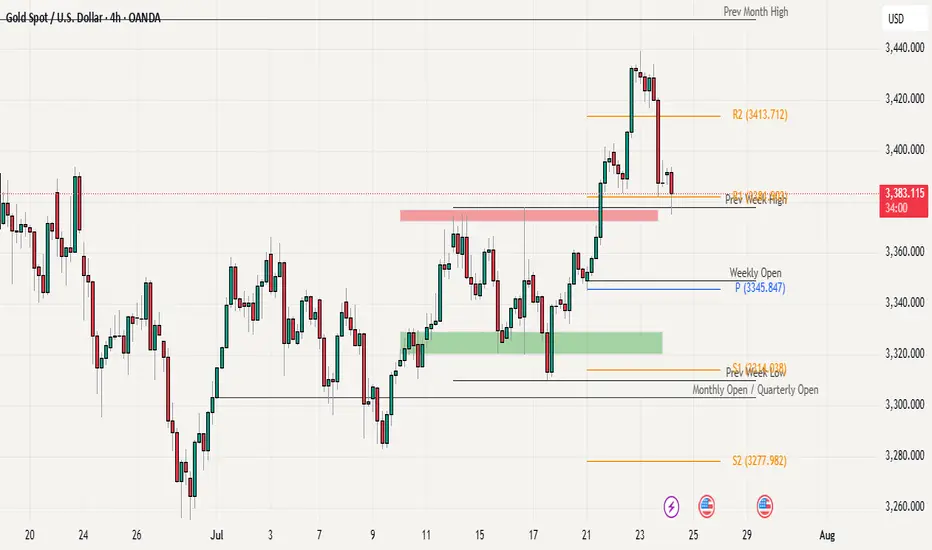
Gold :Back in range , again ??We have seen solid rally over the last two weeks, but that momentum seems to be losing steam. In yesterday’s session, price faced a sharp rejection near 3440 (Near to major resistance of 3450) and closed below the key 3400 level which is a clear warning sign for the bulls. Even though price is still holding above last week’s high (around 3377) and Weekly R1, the failure to sustain above 3400 weakens the bullish structure. If gold dips back below last week’s high, it could open the door for deeper correction and possibly trigger more selling pressure.
On the upside, a decisive move and close above 3400 is needed for buyers to regain control and attempt another leg higher. Until then, upside looks capped and short-term sentiment has turned cautious. Immediate support now lies around 3345, which is also the weekly pivot level, followed by 3333.
The price action suggests that gold may be slipping back into a range-bound phase, with no clear directional strength unless key levels break decisively. For now, the bias remains neutral to slightly bearish unless we see a strong reclaim of 3400 with momentum.
Gold Breaks $3,400 – Bullish Momentum BuildsGold is gaining strong upside momentum, breaking above the $3,400 mark to hit a fresh five-week high.
This sharp rally in the precious metal comes alongside a renewed pullback in the US dollar. Declining Treasury yields across the curve and ongoing trade tensions are also fueling gold’s recovery as a safe-haven asset.
Currently trading around $3,426, gold may see a slight pullback to consolidate before resuming its bullish run.
What’s your take on gold today?

Gold surges with explosive breakoutGold prices launched into a powerful rally yesterday, soaring from $3,350 to nearly $3,400 — a stunning $50 move, equivalent to 500 pips.
This surge was supported by a weakening US Dollar and a drop in the 10-year Treasury yield, which fell to its lowest level in over a week. On the macro front, if the Federal Reserve signals an earlier-than-expected rate cut, the bullish momentum could extend further in the long term.
Technical outlook: The H2 chart reveals a strong breakout after gold successfully breached the $3,372 resistance zone ( as highlighted in yesterday’s strategy ). Price is now completing a pullback, which may serve as the base for the next bullish wave.
Do you agree with this view? Share your thoughts and let’s discuss together.
Good luck with your trades! ✨

Gold XAUUSD Trading Strategy on July 22, 2025Gold XAUUSD Trading Strategy on July 22, 2025:
Yesterday's trading session, gold prices rebounded strongly from the 3345 area to the 3402 area after the previous multi-timeframe compression.
Basic news: President Donald Trump's trade stance towards Europe became tougher; Europe plans to develop a retaliation plan.
Technical analysis: After the previous multi-timeframe compression, gold prices rebounded strongly again. The previous resistance zone of 3365 - 3370 has now become a support zone for gold prices. Currently, a strong uptrend is showing in multiple timeframes. However, the RSI on the H1 frame is currently quite overbought, we will wait for a correction to the support zone to trade.
Important price zones today: 3365 - 3370, 3347 - 3352 and 3422 - 3427.
Today's trading trend: BUY.
Recommended orders:
Plan 1: BUY XAUUSD zone 3365 - 3367
SL 3362
TP 3370 - 3380 - 3400 - 3420.
Plan 2: BUY XAUUSD zone 3347 - 3349
SL 3344
TP 3352 - 3362 - 3372 - 3400.
Plan 3: SELL XAUUSD zone 3425 - 3427
SL 3430
TP 3422 - 3412 - 3402 - 3382 (small volume).
Wish you a safe, favorable and profitable trading day.💯💯💯💯💯

Gold Price Soars Today Amidst USD WeaknessGold prices surged unexpectedly today, surpassing the 3,350 USD/ounce mark, thanks to the weakening of the USD and falling U.S. Treasury yields. Concerns over U.S. President Donald Trump's unpredictable trade policies have also fueled demand for the precious metal as a safe haven.
Despite gold dipping several times near the 3,300 USD/ounce level in recent days, the support from bargain hunters and the continued demand for gold as a safe investment has helped maintain its high price. If this upward momentum continues, gold may soon break through the next resistance level, with 3,372 USD being the immediate target.

Gold price increased, broke 3360Plan XAU day: 21 July 2025
Related Information:!!!
Gold prices (XAU/USD) are extending their upward momentum for the second consecutive session on Monday, as buyers remain cautiously optimistic and await a decisive breakout above a multi-week trading range before committing to further gains. The US Dollar (USD) begins the new week on a softer footing amid mixed signals regarding the Federal Reserve’s (Fed) interest rate outlook—an important factor currently supporting the precious metal.
Additionally, persistent concerns over the potential economic consequences of former President Donald Trump’s unpredictable trade policies are bolstering gold’s appeal as a safe-haven asset.
personal opinion:!!!
Short term H1 frame, gold price breaks 3360 forming bullish structure. Uptrend continues to maintain
Important price zone to consider : !!!
resistance zone point: 3377 zone
Sustainable trading to beat the market

Gold Prices Rise Amidst USD WeaknessAmong precious metals, prices are increasing due to the weakening of the USD. There are no negative scenarios for gold in the medium term, considering the current developments: US government spending is out of control, ongoing trade tensions, uncertain inflation, and increasing criticism aimed at the Fed.
As of the time of writing, gold has risen by 0.3% in the past 24 hours, equivalent to an increase of 100 pips, currently trading at 3,350 USD.
The current environment is highly favorable for gold, especially as investors lose confidence in the stability of US monetary policy. If the Fed begins to concede to political pressure, gold prices could break previous highs and head toward 3,440 USD/ounce in the short term.
Do you agree with this view?

XAUUSD 1H – Watching for a Bounce Inside the ChannelGold is still moving nicely inside this big ascending channel. After hitting resistance, price is pulling back toward the lower support area and trendline.
👉 My Plan:
Waiting to see if price holds around $3,310–$3,320 zone.
If we get bullish signs (strong candle, rejection wick), I’ll look for longs back up toward $3,350–$3,370 and maybe higher.
✅ Key Levels:
Support: $3,310 area
Resistance: $3,345 – $3,370
Break below support could invalidate this idea.
Just being patient and letting price action confirm the next move. Let’s see how it plays out!

Gold Trading Strategy XAUUSD July 18, 2025
Yesterday's trading session, after a strong correction to the 3310 area, the gold price increased sharply again.
Basic news: FED Governor Christopher Waller supports a 25 basis point interest rate cut later this month. The number of weekly unemployment claims in the US fell to 221,000, lower than the forecast of 233,000 and the previous period's level of 228,000; data shows that the US labor market remains stable, strengthening the economic growth outlook.
Technical analysis: The M30 and H1 time frames have not clearly shown the trend of the gold price, when the tug-of-war between buying and selling is quite large. However, in the H4 and D1 frames, there are signs that the gold price will increase again. If the gold price continues to trade in the 3290 - 3300 area, it shows a new multi-frame compression process. This area is very important as it can be a trading point that brings us great profits.
Important price zones today: 3318 - 3323, 3287 - 3292 and 3352 - 3357.
Today's trading trend: BUY (hold).
Recommended orders:
Plan 1: BUY XAUUSD zone 3318 - 3320
SL 3315
TP 3323 - 3233 - 3343 - 3353.
Plan 2: BUY XAUUSD zone 3288 - 3290
SL 3285
TP 3293 - 3303 - 3320 - 3340 - Open.
Plan 3: SELL XAUUSD zone 3353 - 3355
SL 3358
TP 3350 - 3340 - 3330 - 3310.
Wish you a lucky, safe and profitable weekend trading day.🌟🌟🌟🌟🌟

BREAK OUT GOLD On H1 frame, gold has signs of breakout, so pay attention to the support area 3342
XAUUSD BUY Zone: 3341 - 3343
Stoploss: 3337 (60pips)
Takeprofit: 3346 - 3350 - 3354

Gold's Short-Term DeclineHello everyone, what do you think about gold?
Today, gold continues its short-term downtrend. After new data was released at the end of yesterday’s trading session, the USD rose by 0.3%, and U.S. Treasury yields also increased, reducing the appeal of gold. Additionally, the latest unemployment claims data shows improvement in the U.S. economy, which has contributed to the drop in the precious metal.
As of writing, gold is trading around the EMA 34, 89 levels at 3,336 USD. With the recent news, the market is expected to maintain its current stance throughout the day, as no new significant updates are expected.
From a technical standpoint, the downtrend remains in place, with prices continuing to be capped below the trendline. The series of lower highs and lows could likely lead XAUUSD to test lower levels, with the possibility of reaching the 3,300 USD mark.
What do you think about the price of gold today? Let us know in the comments!

Gold Weekly Recap – XAU/USD OutlookOANDA:XAUUSD experienced sharp volatility last week as investors reacted to escalating U.S. tariff announcements and shifting expectations around the Federal Reserve’s rate policy. Although prices dropped early in the week, gold quickly bounced back with three consecutive bullish sessions—highlighting strong buying interest amid growing inflation fears and trade tensions.
Analysts remain split: half foresee more upside, while others maintain a neutral stance. Yet, most agree on one thing—gold continues to serve as a defensive fortress during times of uncertainty, especially with markets grappling with both fiscal and monetary headwinds.
Technically, gold is fluctuating within a tight range around 3,360 USD. While no clear breakout from consolidation has occurred, supportive factors like a weakening U.S. dollar, the U.S. national debt surpassing 37 trillion dollars, and safe-haven inflows from reserve funds are helping keep prices stable.
📍If upcoming CPI data or new tariff announcements from the U.S. further pressure the dollar, gold could test the 3,400 resistance level. Otherwise, a sideways trend may dominate if negative news is absorbed smoothly.
Trend Bias: Neutral – leaning bullish if 3,300 holds strong.
So, are you siding with the bulls or waiting for a clear breakout?
Drop your thoughts in the comments! 💬

Gold XAUUSD Trading Strategy on July 17, 2025:
Yesterday's trading session was as we expected when the gold price adjusted from the 334x area, however, the gold price did not approach 3300 as we expected for a long-term trading point.
Basic news: News that President Trump considered firing FED Chairman Jerome Powell caused the USD to plummet, gold prices to skyrocket and stocks to fall. The US PPI and core PPI last month both recorded a 0% increase, lower than the forecast of 0.2% and the previous period's level of 0.1%. Data showed that inflationary pressure from the manufacturing side continued to cool down.
Technical analysis: After adjusting from the 334x area and approaching the nearest bottom of 3320, the gold price immediately increased sharply. RSI on the H1, H4 and D1 time frames crossed the average line, showing a renewed uptrend. Currently, the higher bottom pattern is compressing at the 3320 - 3357 border. If the price breaks this compression zone, it will fluctuate very strongly.
Important price zones today: 3325 - 3330, 3352 - 3357 and 3300 - 3305.
Today's trading trend: BUY.
Recommended orders:
Plan 1: BUY XAUUSD zone 3325 - 3327
SL 3322
TP 3330 - 3340 - 3360 - 3380.
Plan 2: BUY XAUUSD zone 3300 - 3302
SL 3297
TP 3305 - 3315 - 3335 - 3360.
Plan 3: SELL XAUUSD zone 3355 - 3357
SL 3360
TP 3352 - 3342 - 3332 - 3322.
Wish you a safe, successful and profitable trading day.🌟🌟🌟🌟🌟

Gold XAUUSD Trading Strategy on July 16, 2025Gold XAUUSD Trading Strategy on July 16, 2025:
Yesterday's trading session was in line with our prediction, the gold price corrected strongly after meeting the resistance zone of 336x. However, the support zone of 333x did not help the gold price continue to maintain the sideway range.
Basic news: The US CPI reached 2.7%, higher than the forecast of 0.1% and higher than the previous 0.3%; positively affecting the USD, helping the gold price to decrease sharply.
Technical analysis: Currently, the gold price has broken the sideway range of 3335 - 3375 and is likely to compress in the 3300 area. RSI of the H1, H4 and D1 time frames are moving towards the buying zone. This could be a good long-term trading opportunity for us.
Important price zones today: 3338 - 3343, 3350 - 3355 and 3300 - 3305.
Today's trading trend: SELL (BUY hold).
Recommended orders:
Plan 1: SELL XAUUSD zone 3341 - 3343
SL 3346
TP 3338 - 3328 - 3318 - 3308.
Plan 2: SELL XAUUSD zone 3353 - 3355
SL 3358
TP 3350 - 3340 - 3330 - 3300.
Plan 3: BUY XAUUSD zone 3300 - 3302
SL 3297
TP 3305 - 3315 - 3335 - 3350 - Open (small volume).
Wish you a safe, favorable and profitable trading day.🌟🌟🌟🌟🌟

Gold Faces Pressure as USD Strengthens – A Buying Opportunity?Gold prices have seen a slight decline today compared to yesterday’s trading session, fluctuating around 3,328 USD after losing over 43 USD in just one session.
The main factors contributing to this drop are:
-USD Strength: The USD Index rose by 0.56%, making gold more expensive for investors holding other currencies.
-Rising U.S. Bond Yields: U.S. Treasury yields surged to nearly 4.5%, drawing money away from the gold market.
-U.S. CPI for June: The CPI met expectations, easing inflation fears and reducing the demand for gold as a safe-haven asset.
Despite the short-term pressure, investors remain hopeful that the Fed will cut interest rates in September, potentially providing a boost for gold.
Personal assessment: While gold is currently in a correction phase, its long-term trend remains intact. This could be a buying opportunity if you believe in the upcoming monetary easing cycle.
What do you think about gold’s price today? Let us know in the comments!

Gold Price Today: Uptrend or Correction?The price of gol today is showing mixed trends, with key factors affecting the market. Expectations around Federal Reserve monetary policy and important economic data, such as CPI and unemployment rate, are directly influencing the precious metals market. Additionally, global political tensions and the strengt continue to play a significant role in gold's direction.
Gold remains a safe-haven asset amid economic uncertainty, but fluctuating interest rates and market volatility could lead to unpredictable movements.
Current Trend: Gold may experience a slight correction if economic data turns positive and the USD strengthens, but it still remains an attractive long-term asset due to global uncertainty and inflation.
