Gold XAUUSD Trading Strategy on July 16, 2025Gold XAUUSD Trading Strategy on July 16, 2025:
Yesterday's trading session was in line with our prediction, the gold price corrected strongly after meeting the resistance zone of 336x. However, the support zone of 333x did not help the gold price continue to maintain the sideway range.
Basic news: The US CPI reached 2.7%, higher than the forecast of 0.1% and higher than the previous 0.3%; positively affecting the USD, helping the gold price to decrease sharply.
Technical analysis: Currently, the gold price has broken the sideway range of 3335 - 3375 and is likely to compress in the 3300 area. RSI of the H1, H4 and D1 time frames are moving towards the buying zone. This could be a good long-term trading opportunity for us.
Important price zones today: 3338 - 3343, 3350 - 3355 and 3300 - 3305.
Today's trading trend: SELL (BUY hold).
Recommended orders:
Plan 1: SELL XAUUSD zone 3341 - 3343
SL 3346
TP 3338 - 3328 - 3318 - 3308.
Plan 2: SELL XAUUSD zone 3353 - 3355
SL 3358
TP 3350 - 3340 - 3330 - 3300.
Plan 3: BUY XAUUSD zone 3300 - 3302
SL 3297
TP 3305 - 3315 - 3335 - 3350 - Open (small volume).
Wish you a safe, favorable and profitable trading day.🌟🌟🌟🌟🌟
Commodities

Gold Faces Pressure as USD Strengthens – A Buying Opportunity?Gold prices have seen a slight decline today compared to yesterday’s trading session, fluctuating around 3,328 USD after losing over 43 USD in just one session.
The main factors contributing to this drop are:
-USD Strength: The USD Index rose by 0.56%, making gold more expensive for investors holding other currencies.
-Rising U.S. Bond Yields: U.S. Treasury yields surged to nearly 4.5%, drawing money away from the gold market.
-U.S. CPI for June: The CPI met expectations, easing inflation fears and reducing the demand for gold as a safe-haven asset.
Despite the short-term pressure, investors remain hopeful that the Fed will cut interest rates in September, potentially providing a boost for gold.
Personal assessment: While gold is currently in a correction phase, its long-term trend remains intact. This could be a buying opportunity if you believe in the upcoming monetary easing cycle.
What do you think about gold’s price today? Let us know in the comments!

Gold Price Today: Uptrend or Correction?The price of gol today is showing mixed trends, with key factors affecting the market. Expectations around Federal Reserve monetary policy and important economic data, such as CPI and unemployment rate, are directly influencing the precious metals market. Additionally, global political tensions and the strengt continue to play a significant role in gold's direction.
Gold remains a safe-haven asset amid economic uncertainty, but fluctuating interest rates and market volatility could lead to unpredictable movements.
Current Trend: Gold may experience a slight correction if economic data turns positive and the USD strengthens, but it still remains an attractive long-term asset due to global uncertainty and inflation.

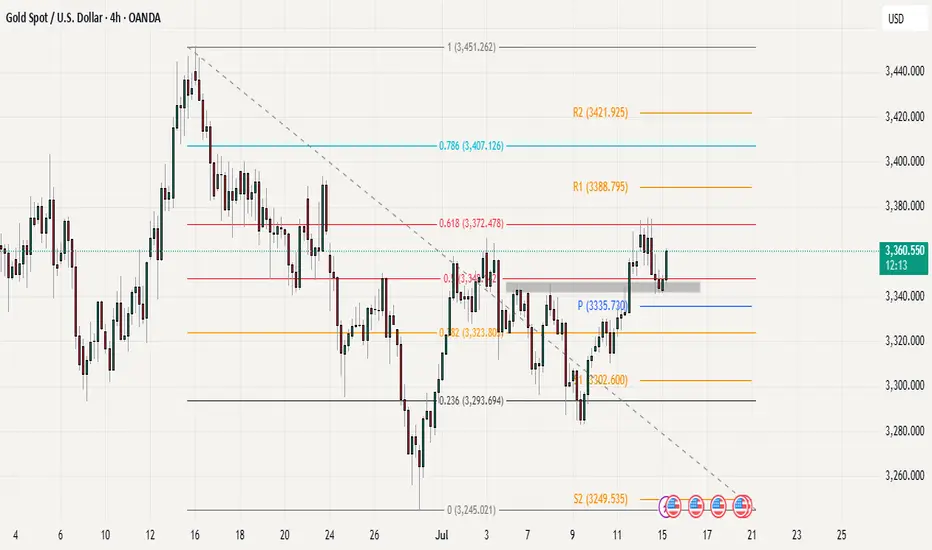
Gold at Critical Support After Fib Rejection CPI Day SetupGold has shown a rejection from the 60% Fibonacci resistance zone as we anticipated, and the price is now testing crucial support levels. The market is currently finding some stability around key areas that we need to monitor closely.
Our primary support zone remains at 3340-3345, which is particularly significant as this was the previous breakout area. This level has proven to be strong in the past and could provide the foundation for any potential bounce. Just below this, we have the 3335 pivot acting as additional support, creating a solid floor for the current price action.
What makes the current setup interesting is that price is attempting to reclaim the 3350 level. If we can see a successful breakout above Monday's high, this could trigger a strong bullish move as it would indicate that buyers are regaining control and pushing through previous resistance levels.
Today's CPI data release will be the main driver for gold's direction.
The trading scenario looks fairly straightforward a break above Monday's high with good volume would signal bullish momentum and could target higher resistance levels. we already seen a strong bounce from the 3340-3345 support zone in opening today,. However, if the 3335 pivot fails to hold, we might see further downside pressure.
GOLD SHORT 1H TIMEFRAMEGOLD CAN BE GO BEARISH IN NY SESSION
as per the market maker point of view
3.8RR

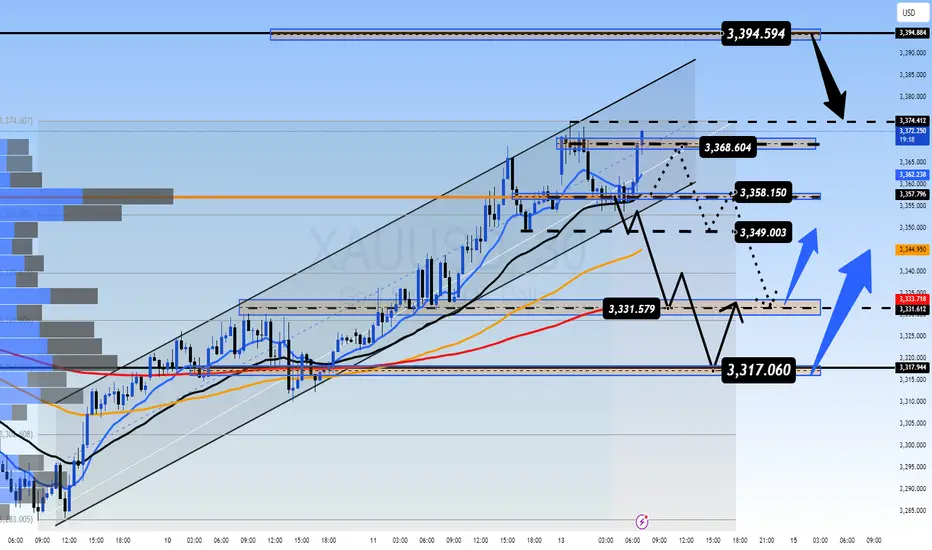
Early Week Correction Ahead of Heavy News Flow GOLD PLAN – July 14 | Early Week Correction Ahead of Heavy News Flow
📰 Macro Context – Volatile Week Expected
Gold opened this week with a sharp correction, retracing after sweeping liquidity from the previous 2-week FVG zone. This early reaction reflects investor caution ahead of key tariff-related announcements due later this week.
In addition to geopolitical factors, the market is also bracing for major US economic data, including:
📊 CPI (Consumer Price Index)
📊 PPI (Producer Price Index)
📊 Unemployment Claims
📊 Retail Sales Figures
These events combined make this a high-volatility week with potentially strong directional moves in the second half.
📉 Technical Outlook – M30 Timeframe
Price has taken out minor liquidity above recent highs
Currently retracing over $15 from the top
Price is now trading below the intraday VPOC (around 3358) — suggesting potential bearish momentum
If momentum continues, gold may dip into key demand zones:
🎯 333x
🎯 Possibly lower into 332x
This could provide a healthy retracement before resuming the broader uptrend.
🧭 Trading Strategy
✅ BUY ZONE: 3331 – 3329
Stop-Loss: 3325
Take-Profits:
TP1: 3335
TP2: 3340
TP3: 3344
TP4: 3350
TP5: 3360 – 3370+
🔍 This zone aligns with prior support, potential liquidity traps, and EMAs on higher timeframes — high-probability area for bounce trades if volume confirms.
⚠️ SELL ZONE: 3393 – 3395
Stop-Loss: 3399
Take-Profits:
TP1: 3390
TP2: 3386
TP3: 3382
TP4: 3378
TP5: 3374 – 3370 – 3360
📉 Great for short-term scalps if price re-tests the zone and shows rejection signs, especially around key news events.
📊 Key Levels to Watch
🔺 Resistance Zones
3358
3368
3374
3394
🔻 Support Zones
3349
3340
3331
3318
⚠️ Execution Notes & Sentiment
🕰️ At the time of writing, gold is consolidating near the M30 VPOC with no clear break in either direction.
🧘 Stay patient and wait for clear confirmation from European session volume
🚫 Avoid FOMO trades — stick to structure
✅ Respect all SL/TP levels to protect your capital
This week’s volatility will reward discipline, not speed.
📌 Summary
Gold is currently in a short-term pullback after reaching previous liquidity zones.
There’s potential for a deeper dip early this week before macro news pushes price decisively.
📌 3331–3329 remains the primary BUY zone to watch if price shows bullish confirmation.
📌 3393–3395 remains the key SELL zone for potential short-term rejections.
🔍 What’s your view this week? Are you looking to buy the dip or short the bounce?
💬 Drop your thoughts in the comments — let’s discuss setups!
✅ If this helped you, hit that like & follow for more daily plans.
📩 Want private signals & deeper trade setups? DM to join our premium group.

Gold Finds Strength in UncertaintyGold prices surged for the fourth consecutive session after U.S. President Donald Trump announced a new wave of tariffs — including a 35% import tax on Canadian goods and threats of 15–20% tariffs on other major trade partners. Previously, the U.S. had already imposed a 50% tariff on copper and Brazilian imports. These aggressive trade measures have reignited fears of a global economic slowdown, prompting investors to seek refuge in gold.
As a result, gold is increasingly viewed as a buying opportunity, with many prioritizing safety over chasing equity market highs.
Adding to the bullish case, expectations of a Federal Reserve rate cut — reinforced by comments from Fed officials Waller and Daly — have further boosted the metal’s appeal.
In summary, the mix of rising trade tensions and a dovish monetary outlook is providing strong short-term support for gold’s upward momentum.

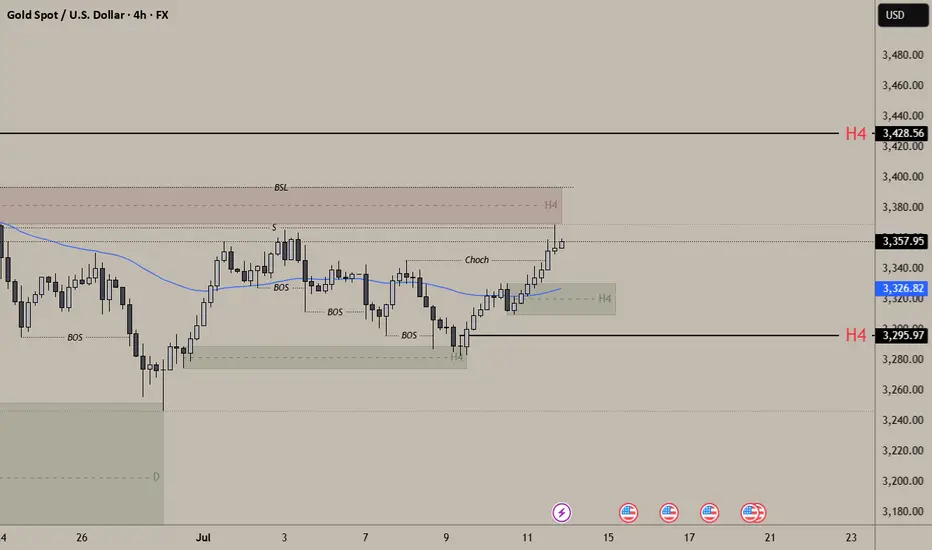
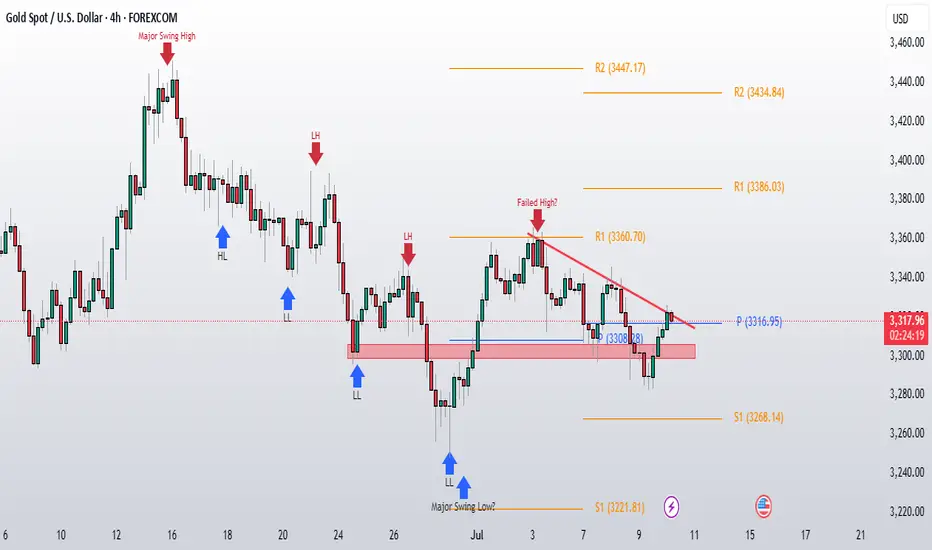
GOLD ANALYSIS AS PER THE MARKET MAKER PERSPECTIVEThis is a gold 4 hour analysis for upcoming week
Gold This week target is 3428 (H4 Supply) in term of bullish
In term of Bearshish (which is low probability) target can be 3296 (H4 demand)
TRADER PSYCHOLOGY - Overtrading The Silent Killer of ConsistencyTRADER PSYCHOLOGY | EPISODE 1: Overtrading – The Silent Killer of Consistency
In the dynamic world of forex trading, success doesn't come from doing more — it comes from doing right. Yet many traders, especially full-time traders in India, unknowingly fall into a common psychological trap that slowly erodes both their capital and confidence: Overtrading.
Let’s break it down — what overtrading is, why it happens, and most importantly, how to stop it before it burns through your progress.
🧠 What Is Overtrading in Forex?
Overtrading refers to excessive trading – opening too many positions without clear signals or justification based on your strategy. In most cases, it’s driven by emotion, not logic.
It usually shows up in two forms:
Trading out of boredom or the urge to “do something”
Trying to recover from previous losses (a.k.a. revenge trading)
Over time, this behavior becomes a habit — and like most bad habits in trading, it’s expensive.
⚠️ Signs You Might Be Overtrading
If you answer "yes" to any of these, it’s time to check your discipline:
Do you feel uncomfortable when you’re not in a trade?
Do you enter trades even when your system says “no trade”?
Do you keep switching charts hoping to “find a setup”?
After a losing trade, do you jump right back in to recover?
Have you lost more to fees/spread than actual price movement?
🧩 Why Indian Traders Often Fall Into Overtrading
🔹 The Action Bias
Traders often feel they must "do something" to be productive. In reality, sitting out is a strategy — especially when markets are flat or unclear.
🔹 Pressure to Perform Daily
Many traders in India try to generate consistent income from trading — and assume they must win every day. That pressure leads to forcing trades just to “hit targets.”
🔹 Overconfidence After a Winning Streak
Success leads to confidence — but too much confidence without structure leads to impulsive trading. One good day shouldn’t convince you that you’ve mastered the market.
🔥 Consequences of Overtrading
Overtrading doesn’t just hurt your account — it breaks your mindset.
Capital Depletion: Small losses + transaction costs = big drawdown over time
Mental Burnout: You feel drained, frustrated, and reactive
Lack of System Trust: You abandon good strategies because you never followed them properly
Emotional Instability: You start making decisions based on fear or revenge, not analysis
✅ How to Control Overtrading – Practical Steps
1. Limit the Number of Trades Per Day
Set a clear rule — e.g., “Maximum 3 trades per day.” This forces you to choose the best setups and ignore mediocre ones.
2. Keep a Simple Trading Journal
Write down:
Why you took the trade
Whether it matched your plan
Your emotional state
Reviewing this weekly will reveal patterns you never noticed in real time.
3. Block Out Non-Active Trading Hours
For Indian traders, this might mean avoiding low-volume periods like mid-Asia session. Focus on London or US overlap hours — when liquidity and volatility are high.
4. Understand: Not Trading Is Still Trading
Being flat (no position) is a strategic decision. Markets reward patience, not impatience.
🎯 Final Thoughts
Overtrading is not a technical issue — it’s a mindset issue.
When you feel the urge to “do something,” remind yourself: the best traders don’t trade all the time. They wait, they observe, and they only act when everything aligns.
"The market doesn’t pay you for activity — it pays you for accuracy."
If you want to grow consistently, you must master the art of waiting, filtering, and executing with purpose.
📌 Next in the Series:
TRADER PSYCHOLOGY | EPISODE 2: FOMO – How Fear of Missing Out Destroys Good Decisions
Follow this page to get notified when it drops!
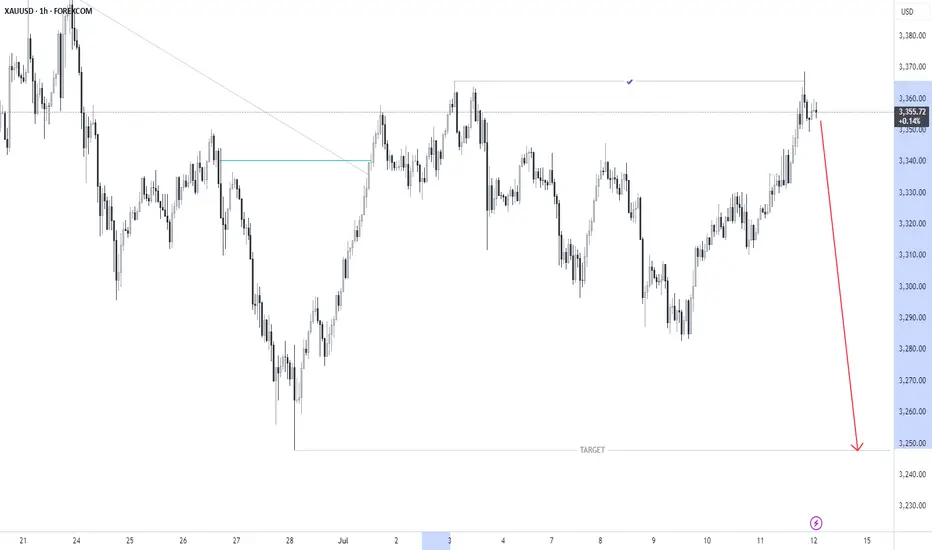
XAUUSD - 1H SHORT (GOLD)FOREXCOM:XAUUSD
Hello traders , here is the full multi time frame analysis for this pair, let me know in the comment section below if you have any questions, the entry will be taken only if all rules of the strategies will be satisfied. wait for more Smart Money to develop before taking any position . I suggest you keep this pair on your watchlist and see if the rules of your strategy are satisfied...
Keep trading
Hustle hard
Markets can be Unpredictable, research before trading.
Disclaimer: This trade idea is based on Smart money concept and is for informational purposes only. Trading involves risks; seek professional advice before making any financial decisions. Informational only!!!
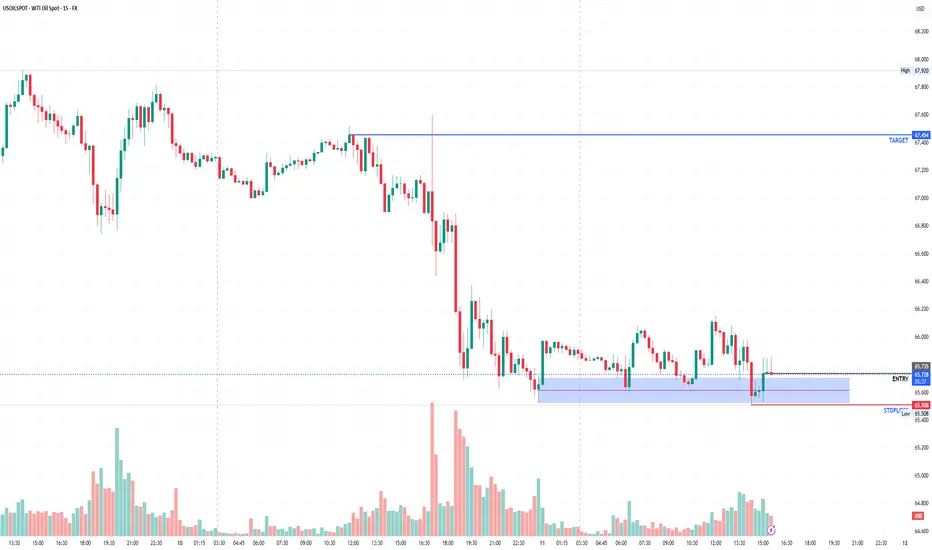
USOIL is taking support at lower levels and making higher highsThe trading signal for USOIL has been triggered. The asset has demonstrated consistent support near the 65.5 price level, exhibiting this pattern of support three times previously, each instance resulting in the formation of a higher high. Currently, USOIL is once again showing support at this crucial level. Therefore, I recommend initiating a bullish or long trade position, with a suggested entry point around the 65.75 mark.
Gold Struggles Under Tariff Pressure Hello everyone, great to see you again!
Today, OANDA:XAUUSD remains under notable pressure as the U.S. continues to signal a tougher trade stance. The latest move: the U.S. President announced a 50% import tariff on copper and a potential 200% tariff on pharmaceuticals, following a previous tariff notice ranging from 25% to 40% sent to 14 countries — including Japan, South Korea, Thailand, and Malaysia.
This isn’t just about protectionism. These measures fuel fears of global inflation, supply chain disruptions, and a broader economic slowdown. With surging prices in raw materials and essential goods, consumers may be forced to cut back spending, a classic warning sign for future growth.
In this environment, investors had hoped gold would shine again as a safe haven asset. However, the recent bullish momentum has been underwhelming, signaling ongoing market hesitation.
📉 On the H4 chart, XAUUSD is being squeezed into a descending pattern, which typically carries a high probability of a downside breakout. If the current support fails, the next target could fall below the 32xx area.
On the flip side, if supportive news emerges — such as a hint of rate cuts from the Fed — gold must break above the $3,335 level to revive bullish sentiment.
🔎 What do you think? Will gold break lower — or bounce back? Drop your thoughts below!

Gold Update - July 11th, 2025Gold is holding strong above 3300 on the daily close and today price breakout from the resistance trendline I mentioned yesterday. Also price is staying above the weekly pivot, which shows the bulls are getting more confident.
We're seeing some real momentum building up. The breakout from that trendline resistance is a good sign that buyers are ready to push higher.
Key Levels to Watch:
Upside Targets:
For intra day, watch 3340-45 as the next resistance area
For the bigger timeframe, we need to break and hold above 3355-60. That's the major level that will tell us if this is just a bounce or the start of something bigger.
Downside Support:
If things go wrong, the weekly pivot is our first support to watch
Also keep an eye on this week's low as backup support
Gold is finally picking a direction and it's pointing up. The breakout from the trendline gives us some confidence, but we're still in range on higher TF.
The real test will be if we can push through 3340-45 and then tackle that bigger 3355-60 area. If we can do that, then we might be back in business for the bulls.

Gold price stabilizes above 3300Plan XAU day: 10 July 2025
Related Information:!!!
Gold prices (XAU/USD) have pared a portion of their modest intraday gains but continue to maintain a positive bias for the second consecutive day, trading around the $3,320 level during the early European session on Thursday. Ongoing uncertainties surrounding US President Donald Trump’s trade policies and their potential implications for the global economy are keeping investors cautious. In addition, expectations that the Federal Reserve (Fed) will lower interest rates later this year continue to lend support to the non-yielding precious metal.
Meanwhile, the minutes from the Federal Open Market Committee (FOMC) meeting released on Wednesday indicated limited support for a potential rate cut as early as this month. This has provided a boost to the US Dollar (USD), which—alongside a broadly positive tone in equity markets—is capping the upside potential for gold as a safe-haven asset. As such, it would be prudent to await confirmation through sustained buying interest before anticipating further gains, as market participants turn their attention to upcoming US Weekly Jobless Claims data and speeches from Federal Reserve officials for near-term trading cues
personal opinion:!!!
Market accumulates, sideways above 3300 waiting for US unemployment news today
Important price zone to consider : !!!
support zone point: 3307 zone
Sustainable trading to beat the market

Gold’s Recent Movement and Market SentimentXAUUSD: Gold Bounces Strongly From the Bottom, Is This the Start of a New Uptrend?
🌍 Macro Overview – Gold’s Recent Movement and Market Sentiment
Gold recently experienced a strong bounce from the 3.282 USD/oz low, reaching up to 3.317 USD/oz. This move has sparked some optimism, but let’s take a look at the key macro factors that might be affecting gold:
📉 US bond yields have dropped, signaling that market risk aversion is starting to return
💵 The USD remains strong, but buying interest for gold in Asia is increasing, as confidence in fiat currencies begins to wane
🇪🇺 The EU is pushing ahead with negotiations with the US on tariffs before the August 1st deadline. If these talks break down, gold could benefit significantly
🏦 The Fed is maintaining interest rates, but the market is betting that cuts could come in September if inflation remains under control
📊 US unemployment data and the Fed’s speech tonight will be key, with the market waiting anxiously for clues on the Fed’s next move
📊 Technical Analysis – Gold Approaching Key Resistance Zones
Gold is trading within a descending channel, but signs of a breakout are emerging after a solid test of the bottom.
Key resistance levels are around 3330 – 3340, and these will be crucial in determining whether gold can continue its upward momentum.
Fair Value Gap (FVG) has appeared between 3310 – 3320, which suggests that if buying pressure remains, a breakout could be on the horizon.
🎯 Trading Strategy for Today – Focused on Clear Entry Points
🟢 BUY SCALP:
Entry: 3310 – 3308
SL: 3304
TP: 3314 → 3318 → 3322 → 3326 → 3330
🔵 BUY ZONE (safer entry points):
Entry: 3290 – 3288
SL: 3284
TP: 3294 → 3298 → 3302 → 3306 → 3310 → 3320 → 3330
🔴 SELL SCALP (if price hits resistance levels):
Entry: 3335 – 3337
SL: 3342
TP: 3330 → 3325 → 3320 → 3315 → 3310 → 3300
⚫ SELL ZONE (strong resistance at 3360-3362):
Entry: 3360 – 3362
SL: 3366
TP: 3356 → 3352 → 3348 → 3344 → 3340 → 3336 → 3330
📌 Note:
Always place SL and TP to protect your account, especially in a market that may experience significant volatility.
Monitor the volume from London and New York sessions for clearer market direction. A strong breakout above resistance could signal the start of a new uptrend.
💬 Gold has bounced strongly, but is this the start of a larger rally, or just a brief pullback? What do you think about today’s potential trend? Share your thoughts in the comments below!

Gold Finds Support as Tariff Tensions RiseHello everyone! What’s your take on XAUUSD today?
OANDA:XAUUSD is showing a mild recovery, currently trading around $3,323, gaining over 100 pips on the day. Despite this bounce, the short-term structure still leans in favour of the bears.
On July 9th, President Biden announced a 50% tariff on copper and a projected 200% tariff on pharmaceuticals, following earlier notices of 25–40% tariffs imposed on 14 countries including Japan, South Korea, Thailand, Laos, and Malaysia.
This escalation has led to a sharp rise in international copper prices and reignited fears of global inflation, supply chain disruptions, and slower economic growth. As consumers cut back and companies face contract renegotiations, financial risk is spreading across global markets.
In this climate, investors are returning to gold as a safe haven, seeking capital protection in anticipation of broader market instability.
📈 Outlook: Gold prices may continue to rally in the short term if the U.S. unveils further tariff measures or reveals new negotiation drafts in the coming days.

Gold Update - July 10th, 2025Yesterday we have seen breakdown below Monday's low , but bulls again stepped in at the lower levels and pushed gold back above 3300 by the daily close. This was actually a really encouraging sign that buyers are still willing to defend this level.Things are looking a bit better now. Gold is trading above the weekly pivot, which is a positive shift from yesterday's weakness.
What's in the way:
The immediate challenge is that dynamic trendline you can see on the chart
Bulls need to break through this first ....
After that, the next big test is around 3340 this is a high volume area where we've seen plenty of action before.
old is basically stuck in a range between 3280-85 on the bottom and 3335-40 on the top. Right now, there's no clear direction.
We need a decisive break from this range. Until then, we're just watching price bounce between these levels without any real commitment from either buyers or sellers.
Selling pressure, gold downtrendPlan XAU day: 09 July 2025
Related Information:!!!
Gold (XAU/USD) continues to extend its decline on Wednesday for a second consecutive session, as the US Dollar (USD) and US Treasury yields strengthen ahead of the release of the Federal Open Market Committee (FOMC) Meeting Minutes.
The US Dollar Index (DXY) has climbed to a two-week high, exerting downward pressure on XAU/USD, which has fallen below the $3,300 level at the time of writing.
The forthcoming release of the FOMC Minutes from the June meeting is anticipated to provide insight into the Federal Reserve’s internal discussions regarding the future course of monetary policy.
In June, the central bank chose to maintain its benchmark interest rate within the 4.25% to 4.50% range, citing continued labor market resilience and persistent inflationary pressures.
personal opinion:!!!
Gold price is in the accumulation zone below 3300, big selling pressure. Pay attention to selling gold according to the trend line 3294
Important price zone to consider : !!!
support zone point: 3274; 3252 zone
Sustainable trading to beat the market

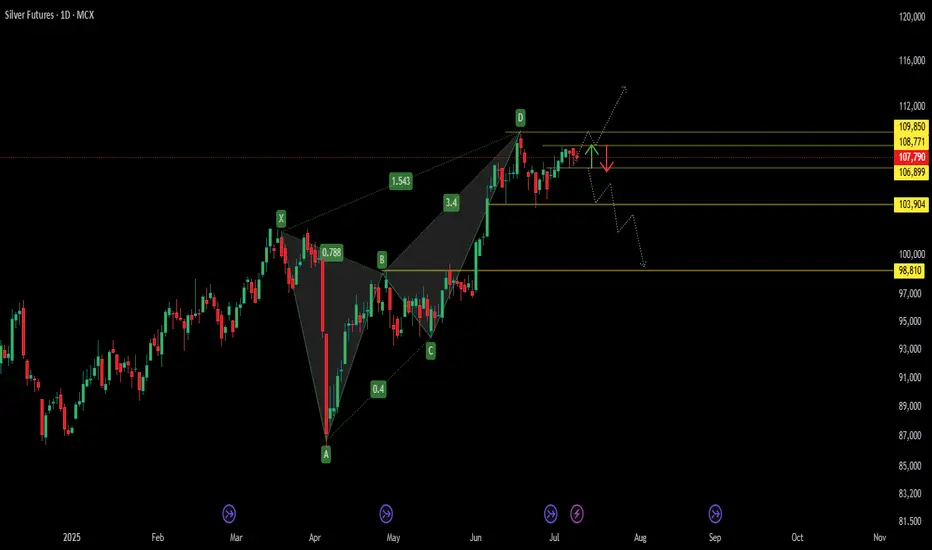
Bearish Harmonic in Play – Silver Sell Zone TriggeredBearish Harmonic in Play – MCX:SILVER1! Sell Zone Triggered 🔔
The pattern marked from X → A → B → C → D forms a Bearish Harmonic Structure , most likely a Bearish Butterfly , confirmed by key Fibonacci ratios:
* XA to AB retracement: 78.8%
* BC to CD extension: 1.543
This setup signals the formation of a Potential Reversal Zone (PRZ) near point D , where a bearish trend may initiate.
📉 Bearish Price Outlook
The dotted projection lines and red arrow illustrate the anticipated downward move:
* Price is likely to face resistance and reverse from the PRZ between ₹108,771 and ₹109,850
* A break below ₹106,899 could trigger further decline toward key support levels at ₹103,904 and ₹98,810
Gold at a Crossroads – Rebound or Breakdown?Gold just faced a sharp sell-off as optimism surged around a potential trade truce. After President Trump announced a 25% tariff on Japan and South Korea, the deadline was surprisingly pushed to August 1st, giving countries room to negotiate. That pause eased market fears and triggered a short-term risk-on sentiment.
But the real pressure came from a stronger US Dollar and 10-year Treasury yields hitting a two-week high – a deadly combo for gold, which offers no yield. The shift in capital flow toward safer, interest-bearing assets pushed gold further into the red.
Now, all eyes are on the upcoming Fed minutes and speeches from key officials this week. If the tone is hawkish, gold could lose further ground. But a dovish hint might spark a bounce from the $3,290 support zone.

Gold Price Action Update - July 9th, 2025We have seen that gold retested crucial 3300 support level once again yesterday and managed to bounce back, closing above it by day's end. This suggesting that the bulls were still in control.
but again in eary asian session today Gold broke below 3300 and is now trading under Monday's low(3295-96).This is definitely a shift in momentum that we need to watch carefully.
If we stay below Monday's low (3295-96) and can't reclaim the weekly pivot, more downside pressure possible,
The next logical target /support would be the weekly S1 at 3268.
For any bullish recovery, we NEED to reclaim that weekly pivot at 3316,and 3345 our next major hurdle to overcome,while today's action looks bearish on the shorter timeframes, the daily close is still favoring the bulls for now. This creates an interesting dynamic where we're seeing some short-term weakness within what's still technically a bullish structure.

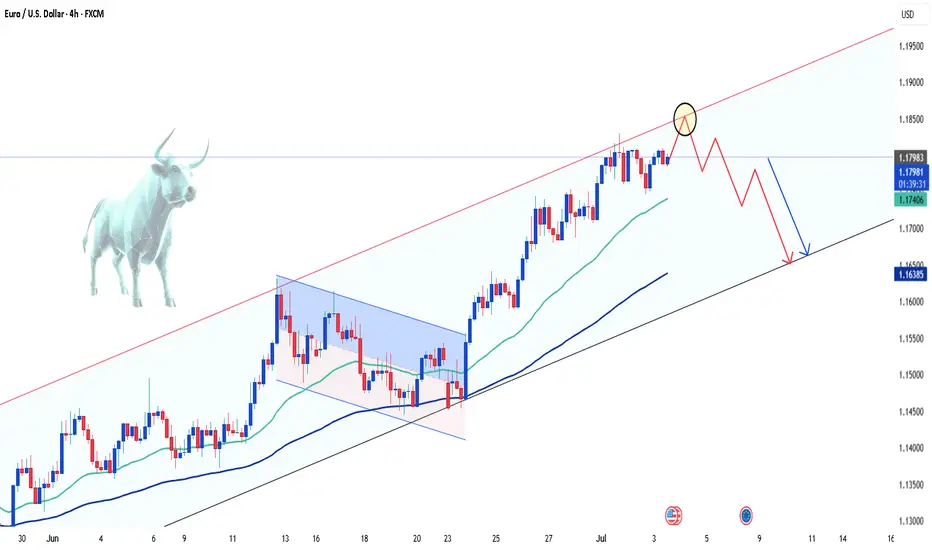
EURUSD - Sideways Action Sparks Reversal SpeculationHello traders, what are your expectations for EUR/USD?
Today, EUR/USD continues to move sideways around the 1.1800 mark during Thursday’s European session. The pair is showing signs of caution as the US Dollar gains ground amid optimism over a US–Vietnam trade deal.
From a technical perspective, the bullish trend still dominates as the price remains within an upward channel. However, a short-term pullback could be on the horizon, especially with buying momentum fading as EUR/USD approaches the upper boundary of the channel.
What do you think—could a reversal be forming from this zone?
Drop your thoughts in the comments!
Happy trading, everyone!