Potential Breakdown with Retest or Reversal Zone This chart represents a classic Double Top pattern, a bearish reversal signal indicating strong resistance around the 3,380 - 3,390 USD zone (marked with two white circles).
🔍 Key Zones and Levels:
1. Resistance Zone (~3,380 - 3,390 USD):
Price was rejected twice here.
Suggests strong selling pressure and buyer exhaustion.
2. Mid Support/Retest Zone (~3,337.857 USD):
Marked with a horizontal white line.
Could act as a short-term resistance if price retraces.
3. Demand Zone (~3,330 - 3,337 USD):
Highlighted green box: potential reversal/retest zone.
Bullish scenario: price bounces from here and heads back to retest resistance.
4. Current Price (~3,309.980 USD):
Price has broken below the demand zone and is approaching strong horizontal support.
5. Lower Support (~3,265 - 3,270 USD):
Highlighted with blue horizontal lines and purple arrows.
Could be the next bearish target if breakdown is confirmed.
🔄 Two Possible Scenarios:
📉 Bearish Continuation:
Price retests the broken demand zone (now resistance).
Rejects and forms a lower high.
Falls toward the lower support around 3,265–3,270 USD.
📈 Bullish Reversal:
Price reclaims the green demand zone.
Pushes above 3,337.857 USD level.
Heads back to retest the double top area (~3,380
✅ Conclusion:
The bias is currently bearish, supported by:
Double top formation.
Breakdown below key demand zone.
Momentum favoring further downside
However, a bullish reversal is possible if price reclaims the 3,337 USD zone and shows strong bullish structure.
Commodities

Waiting for the Breakout: Consolidation or Trend Continuation?XAUUSD – Waiting for the Breakout: Consolidation or Trend Continuation?
Gold (XAUUSD) is trading within a narrowing range, building momentum after rebounding from the 3.276 support area. Despite short-term uncertainties, the overall macroeconomic landscape continues to favor bullish scenarios — though key resistance levels must be cleared to confirm continuation.
🌍 MACRO & MARKET SENTIMENT
USD Weakness: The DXY continues to trade under pressure, increasing the appeal of non-yielding assets like gold.
US–China Trade Talks: Ongoing high-level negotiations in London could either ease geopolitical tensions or fuel safe-haven demand, depending on outcomes.
Global Risk Appetite: With US debt ceiling concerns still looming and the Fed showing hesitancy to cut rates soon, gold remains in focus as a hedge.
📈 TECHNICAL OUTLOOK (30M–H1)
The price has formed a descending wedge structure and is hovering near key EMAs (13–34–89–200).
A breakout above 3,334 could trigger a short-term bullish wave, while failure at this zone would likely lead to deeper correction toward 3,276 or lower.
📍 STRATEGIC KEY LEVELS
Resistance: 3,334 – 3,336 – 3,362 – 3,390
Support: 3,300 – 3,276 – 3,250
🧭 TRADING SCENARIOS
🔵 BUY ZONE: 3,276 – 3,274
SL: 3,270
TP: 3,280 → 3,284 → 3,288 → 3,292 → 3,296 → 3,300
🔻 SELL SCALP: 3,334 – 3,336
SL: 3,340
TP: 3,330 → 3,326 → 3,322 → 3,318 → 3,314 → 3,310
🔻 SELL ZONE: 3,362 – 3,364
SL: 3,368
TP: 3,358 → 3,354 → 3,350 → 3,346 → 3,340 → 3,335 → 3,330 → 3,320
✅ SUMMARY
Gold remains in a critical range, and traders should focus on well-defined zones to capitalize on volatility. Use confirmation-based entries and respect risk parameters — especially as macro headlines and technical patterns align for a potential breakout.

Sideways Gold, Stronger Dollar: A Pause Before the BreakGold attempted a bullish breakout recently but failed to sustain momentum and is now back within a consolidation zone between 3,250–3,350. The repeated failure to break above descending trendline resistance suggests weakening buyer strength. It is currently forming lower highs, indicating distribution or sideways movement rather than a clear rally.
On the other hand, DXY has bounced from a key demand zone near 99.00, showing signs of short-term strength. It is now targeting the 102.60–104. resistance zone, which aligns with a Fibonacci retracement. If DXY continues higher, it could put pressure on gold prices in the near term.
Given this context, it is wise to remain on the sidelines for the next 2–3 weeks and wait for one of two scenarios:
1. DXY rejection from the 102.60–104 area – This would support a bullish case for gold.
2. Gold breakout above 3,400 with strong volume or need another bounce from lower support area as marked on chart which can provide confirmation of bullish continuation.
Until then, gold is likely to stay in a range or face minor downside due to DXY strength.
NFP STORM BREWING: WILL GOLD BREAK HIGHER OR DIVE LOWER?XAUUSD – NFP STORM BREWING: WILL GOLD BREAK HIGHER OR DIVE LOWER?
Gold enters a highly sensitive phase ahead of tonight’s Non-Farm Payrolls (NFP) release – one of the most influential data points for global financial markets. With US-China trade tensions rekindling and sovereign debt concerns mounting in the US, the yellow metal could experience a major breakout or a sharp reversal during the New York session.
🌍 MACRO & FUNDAMENTAL OUTLOOK
US-China trade talks have resurfaced, with concerns around tariffs and strategic metals dominating headlines. China's recent stance signals it may take stronger defensive actions.
The US national debt is projected to hit $55 trillion by 2034, prompting global central banks to ramp up gold purchases as a strategic hedge.
Fed Chair Powell reiterated a “no rush to cut” stance, yet political pressure is mounting – especially with Donald Trump urging immediate rate cuts following the weakest ADP job growth in two years.
Unemployment Claims released today came in slightly better than expected (236K vs. 240K), adding fuel to speculations around a softer NFP print – potentially bullish for gold.
🔍 TECHNICAL ANALYSIS (H1 – EMA 13/34/89/200)
The chart shows a clean impulsive wave structure. After hitting the resistance zone at 3408–3410, gold entered a consolidation range.
Price is currently hovering around EMA 89–200, suggesting trend divergence and uncertainty ahead of NFP.
A breakdown below the 3344–3332 support zone could push price down to the FVG (Fair Value Gap) at 3320, which may act as a strong liquidity pool for buyers.
⚠️ KEY LEVELS TO WATCH
Resistance: 3380 – 3392 – 3408 – 3436
Support: 3365 – 3350 – 3344 – 3332 – 3320
🧭 TRADE SETUPS
🔻 SELL ZONE: 3408 – 3410
Stop Loss: 3415
Take Profit: 3404 → 3400 → 3395 → 3390 → 3380 → 3370 → 3360 → 3350
🔵 BUY ZONE: 3318 – 3316
Stop Loss: 3310
Take Profit: 3322 → 3326 → 3330 → 3335 → 3340 → 3350 → 3360 → ???
✅ CONCLUSION
Gold is poised for a volatile breakout with NFP acting as the key catalyst. A soft jobs report may trigger a breakout above 3410, while stronger-than-expected numbers could fuel a bearish reversal. In this sensitive phase, traders should stick to defined zones and wait for confirmed liquidity reactions rather than chasing price impulsively.

Analysis on Silver : XAGUSDSilver run halts at immediate resistance $36.12698
On breakout, upside targets are T1, T2 and T3 as mentioned respectively.
If price rejects this and falls below the Immediate support, then the 2024 year's high level will be a strong support to invalidate bullish sentiment.
Below S2, it will still be a weak bullish zone instead of a reversal or bearish knock.
IMO, a pullback is quite possible before hitting the upper targets. A valid close is important above the immediate resistance level.
There is a slight negative divergence in RSI to support the pullback.

Silver also looking good from HereThis is the only time frame where I am watching silver as on now (On Monthly )
Chart is self explanatory, All we need a break above 35 , closing above this level can start a much awaited bull run on silver from here.
and if we see good momentum from silver , gold also goig to follow the same in short term to mid term basis.

Gold : Looking good so far ...No Change to chart
Support Levels that we have to watch:
Immediate Support : 3345-50(PDL and 50)
Secondary Support : 3330-35
Major Support : 3280-90
Immediate resistance : Current Week High(3390-92)
secondary Resistance : 3440-45
Major Resistance : ATH (3500)

Gold Stalls Ahead of Key Trade TalksGold Stalls Ahead of Key Trade Talks – Will Price Explode Out of the 3345–3370 Range?
After Monday’s explosive rally, gold is currently consolidating within a tight price range. The market is at a critical juncture, awaiting high-level trade talks between the U.S. and China — an event that could serve as a major catalyst for the next directional move.
🌍 MACRO OUTLOOK & MARKET SENTIMENT
A major trade call between Trump and President Xi Jinping is on the horizon. This conversation could reset global trade expectations and potentially trigger large moves in risk assets.
Last week’s strong U.S. jobs data (NFP) pushed back expectations of Fed rate cuts. Treasury yields remain elevated, which is temporarily capping gold’s upside.
Market sentiment is neutral-to-cautious, with traders waiting for confirmation of a breakout or breakdown before committing capital to new positions.
📈 TECHNICAL ANALYSIS (H1 – EMA 13/34/89/200)
Gold appears to be in a wave 4 correction, consolidating after completing wave 3.
EMAs remain aligned to the upside (bullish), suggesting the broader trend still favors buyers.
Key range:
Above 3370 → breakout confirmation → momentum push toward 3400–3410
Below 3345 → breakdown → fast dip to 3310–3300 to complete wave 4 and initiate wave 5 upward
🧭 STRATEGIC ZONES
🔵 BUY ZONE: 3317 – 3315
Stop Loss: 3310
Take Profits:
3322 → 3326 → 3330 → 3334 → 3338 → 3345 → 3350 → 3360
This zone aligns with a strong FVG + EMA89 support. A bullish reaction here could provide a high-probability entry for the next impulsive leg upward (wave 5).
🔻 SELL ZONE: 3372 – 3374
Stop Loss: 3378
Take Profits:
3368 → 3364 → 3360 → 3356 → 3350 → 3345
3370 is a critical resistance zone. Any rejection at this level with weak momentum or divergence could open a short-term bearish correction back toward 331x levels.
✅ SUMMARY
Gold is trapped in a decision zone between 3345–3370. The market awaits clarity from macro headlines and technical breakout signals. Until then, traders should watch key levels closely, stay patient, and position accordingly based on price action confirmation at strategic zones.

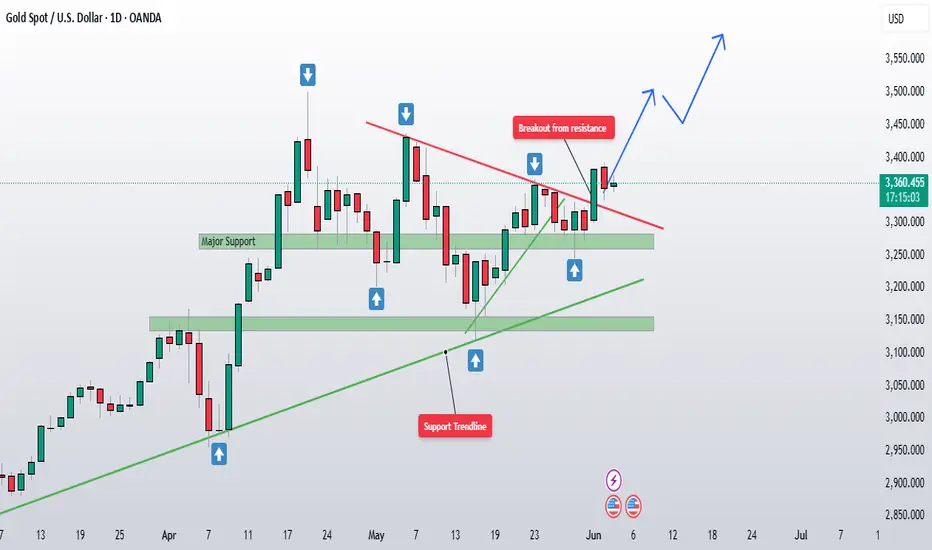
Gold Holding Strong Looks Like It’s Building Power AgainPrice appears to be consolidating just above the breakout trendline, forming a new bullish base between 3350–3365 on the daily timeframe. This is a healthy sign ,it indicates that buyers are absorbing supply and not allowing price to fall back into the old range.
As long as this consolidation holds, the setup remains bullish, with upside potential still targeting 3445 and then ATH at 3500. If we get a decisive breakout above ATH, we might see a continuation rally. However, if a double top starts forming there, it will be time to book partial profits and wait for confirmation.
For Invalidation Level: I am Watching the 3380–3390 zone closely (Monday’s low). A strong move below this level could signal a failed breakout and invalidate the current bullish structure.
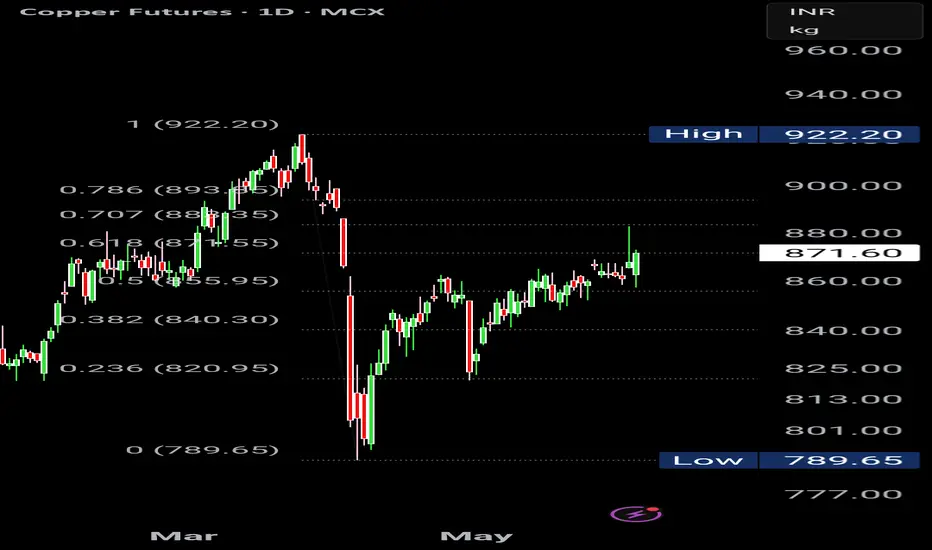
MCX COPPER CLOSES ABOVE 61.8 Fib Level. Today is an important GANN DATE for MCX COPPER. LETS SEE IF IT GOES INTO A BULLISH TRAJECTORY.
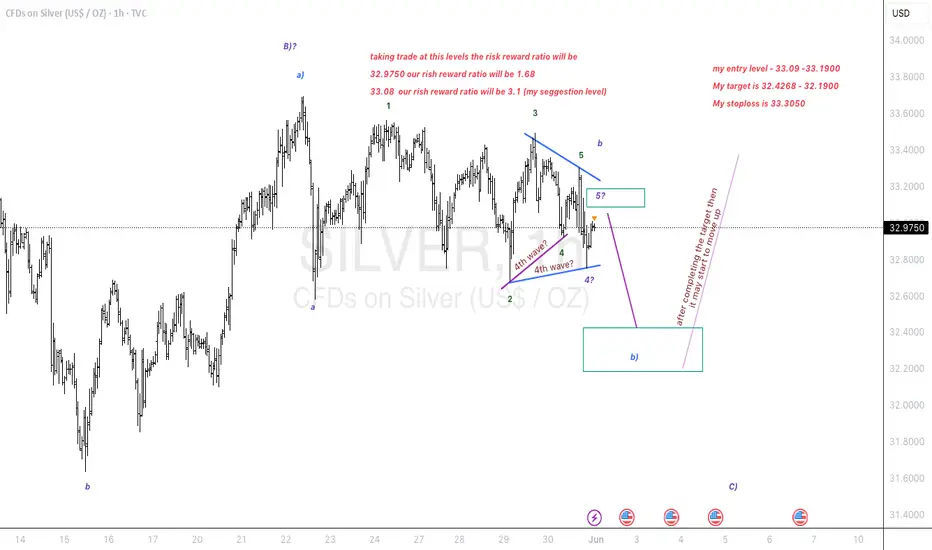
Triangle breakout in silver. Down to earth..
Elliott Wave Analysis:-
1st possibility:- (look Previous chart published)
Silver is in a triangle breakout. if it is getting towards upside breakout then we have a nice opportunity of pullback and and we can add it if the pullback occurs. else we can enjoy this journey quietly.
2nd possibility:-
Silver had already made a pullback towards down side breakout. Once it start the way it will fly towards downside and then it will complete a C wave in whole B wave then upside C wave will be impulsive.
My Entry, Stop, Target all have been discussed.
My suggestion to take a trade at this place to reduce the risk better reward.
I just spoke what chart whisper's in my ear.
I am not a SEBI registered advisor. Before taking a trade do your own analysis or consult a financial advisor. I share chart for education purpose only. I share my trade setup.
Gold (XAU/USD) 1H Analysis – Potential Breakout Play🟡 Gold (XAU/USD) 1H Analysis – Potential Breakout Play 📈
🔎 Key Levels and Zones
Resistance Zone: Around $3,410 – $3,430.
Midpoint/Key Resistance-Turned-Support: Around $3,360 – $3,370.
Support Zone: Around $3,270 – $3,290.
🔀 Chart Structure & Momentum
The price is in a short-term bullish recovery after finding strong support at the $3,270 – $3,290 level.
The breakout above the midpoint around $3,360 is a significant bullish trigger, suggesting that bulls are taking charge.
📊 Scenario Analysis
Bullish Scenario (Primary Bias) 🟢: If the price holds above the midpoint ($3,360), we expect a push towards the resistance zone ($3,410 – $3,430). This aligns with the “resistance-flip-support” concept, where the previous resistance becomes a new support base.
Bearish Scenario (Alternate Bias) 🔴: If the price fails to hold above $3,360, a re-test of the support zone ($3,270 – $3,290) is likely. From there, bulls will likely try to defend the area and launch another attempt upwards.
📌 Conclusion
The path of least resistance currently favors the bulls while the $3,360 level holds.
Watch for consolidation near $3,360 – $3,370 as a healthy retest before potential continuation to the upside target zone ($3,410 – $3,430).
📅 Near-Term Bias
Remain cautiously bullish while above $3,360.
A confirmed breakout above $3,410 opens room for further bullish momentum, while a breakdown below $3,360 can re-test the key support at $3,270.

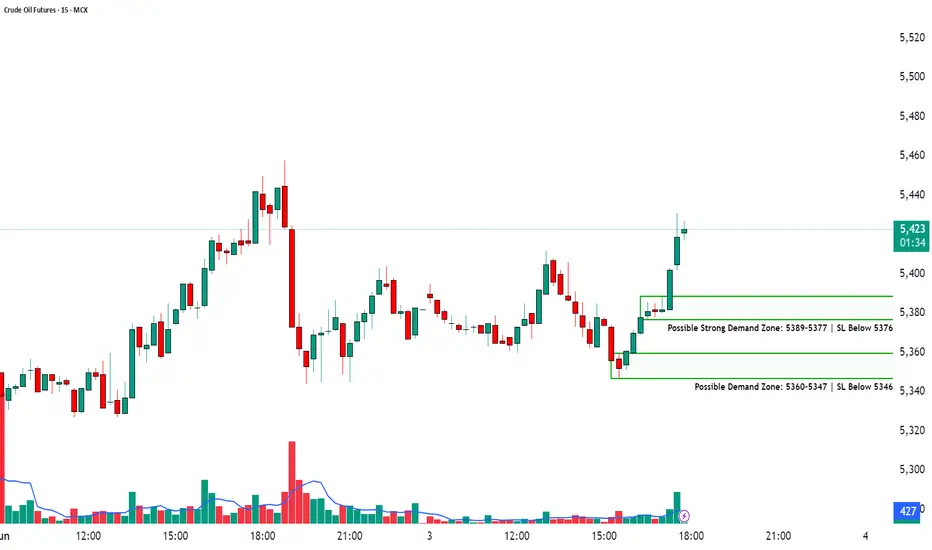
Demand Zone Breakdown + Trade Strategy📈CRUDE OIL FUTURES | 15-Min Chart Analysis
📆Date: June 3, 2025
Ticker: MCX:CRUDEOIL!
Chart Overview:
The chart highlights a bullish reversal from previously marked demand zones. Price sharply bounced with volume confirmation, indicating renewed buying interest.
Two demand zones have been marked for observation:
Possible Strong Demand Zone: ₹5389–5377 | SL Below ₹5376
Possible Demand Zone: ₹5360–5347 | SL Below ₹5346
Price is currently trading around ₹5,425, showing a significant up move post-demand zone test, suggesting buyer dominance in the short term.
Demand Zone Breakdown:
🟩🟩 Strong Demand Zone (₹5389–5377):
Strong volume-backed bullish engulfing formed after price dipped here.
Ideal zone for aggressive long entries with SL below ₹5376.
🟩 Lower Demand Zone (₹5360–5347):
Acts as deeper support and a conservative re-entry zone.
Long entries possible with SL below ₹5346 if retested.
How to Trade Demand Zones (Long Trade):
Wait for a retest of the zone.
Watch for bullish confirmation candles (hammer, bullish engulfing, etc.).
Enter long near the bottom of the zone.
Place SL just below the demand zone.
Stop-Loss Placement:
For Strong Demand Zone: SL below ₹5376
For Lower Demand Zone: SL below ₹5346
Targets: Use Risk-Reward Ratio
🎯 Use a 1:2 or 1:3 RRR to set logical target levels.
📌 Example: If risk is ₹10, target should be ₹20–₹30 above entry.
💡 Why Use Risk-Reward?
Sets clear and objective targets
Keeps emotions out of trading decisions
Helps maintain long-term profitability with disciplined risk control
⚠️ Risk Management Tip:
Always trade with a clearly defined stop-loss. Avoid impulse entries. Start with small quantities and increase size only with confirmation. Capital protection comes first.
📢 Disclaimer
This post is intended for educational and informational purposes only. It does not constitute investment advice or trade recommendations. Trading in commodities and financial markets involves risk. Please consult a SEBI-registered advisor before making financial decisions. The author is not SEBI registered and shall not be liable for any losses. Always use proper risk management and do your own research.
👉 Follow for more trade setups, chart breakdowns, and educational content to improve your trading edge. Stay informed. Trade smart. 📊📈
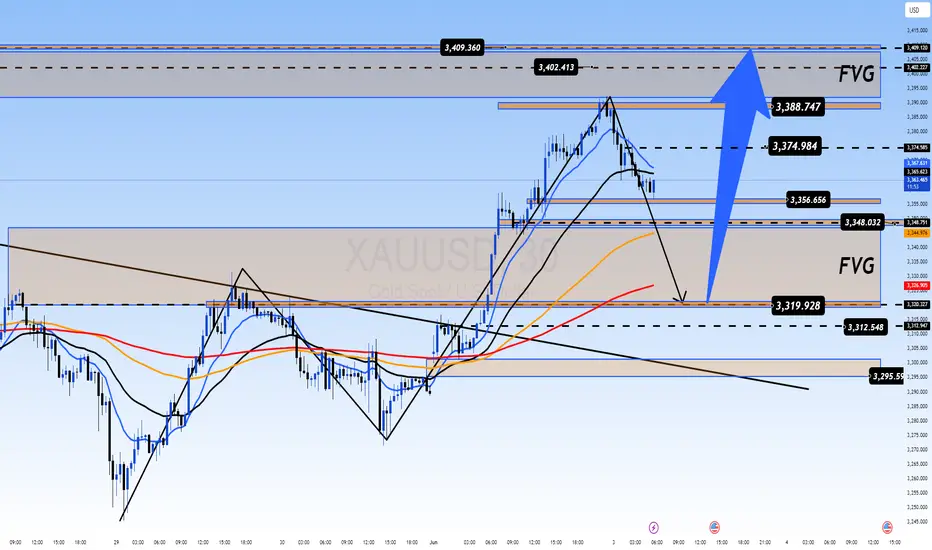
MARKET WAITS FOR TRUMP–XI TRADE CALL XAUUSD PLAN – JUNE 3XAUUSD PLAN – JUNE 3 | GOLD CORRECTS AFTER $100 SURGE | MARKET WAITS FOR TRUMP–XI TRADE CALL
After an explosive $100+ rally earlier this week, gold has entered a sharp correction phase, dropping $30 during the Asian session. This pullback comes as the market anticipates a high-level trade call between former President Trump and President Xi Jinping, which could reshape short-term expectations around US–China relations and global risk sentiment.
🌍 MACRO CONTEXT – POLITICS MEETS FINANCE:
The upcoming Trump–Xi call is expected to guide markets over the next few sessions and may impact trade risk positioning.
Investors have begun profit-taking following the aggressive rally, leading to temporary risk-off sentiment and cash-out flows.
From an Elliott Wave perspective, wave 3 (the strongest wave) may have completed, and price could now retrace into lower FVG zones to gather liquidity for the next upward move.
📈 TECHNICAL STRUCTURE (H1–H4 – EMA 13/34/89/200):
On higher timeframes (H4 and D1), gold maintains a strong bullish structure.
Price appears to have peaked near 3,402 – 3,409, and is now retracing toward the key FVG support zone between 3,320 – 3,310.
EMAs are beginning to compress after a strong expansion – suggesting the market may consolidate or correct further in the short term.
🧭 KEY PRICE LEVELS:
Support: 3,346 – 3,340 – 3,318 – 3,310 – 3,295
Resistance: 3,374 – 3,388 – 3,402 – 3,410
🔍 TRADE SETUPS:
🔵 BUY ZONE: 3,320 – 3,318
Stop Loss: 3,314
Take Profits:
3,324 – 3,328 – 3,332 – 3,336 – 3,340 – 3,344 – 3,350 – 3,360 – 3,374+
Buy on dips into the liquidity zone or after confirmation candles near EMA13–34 support. Ideal entry for positioning ahead of a potential wave 5 continuation.
🔻 SELL ZONE: 3,388 – 3,390
Stop Loss: 3,394
Take Profits:
3,384 – 3,380 – 3,376 – 3,370 – 3,366 – 3,360 – 3,350
Sell only if there is a strong rejection or bearish divergence near the recent highs – this zone marks the top of wave 3 and potential exhaustion.
📌 SUMMARY:
Gold’s macro structure remains bullish, but short-term corrections are expected. Price may dip into FVG zones to absorb liquidity before launching the next move. Avoid FOMO and follow technical zones with disciplined SL.
Gold price breakout from Key resistnace Gold price breakout from resistance key area (3360-65) with good volume , as per price action, price can now make another move higher and we can expect continuation of bullish wave towards ATH (3500) , at ATH we have to wait for price action , we can expect breakout or double top like structure there , on breakout we can add to current buy if price move in higher side with current moentum.

Technical Analysis on XAU/USD (Gold vs USD) – Bullish Reversal 📊 Chart Overview:
This chart of XAU/USD (Gold) on a lower timeframe shows a potential bullish reversal setup. The price action has formed a series of lower highs and lower lows, but now a bullish momentum is building up, suggesting a possible breakout to the upside.
🔍 Key Observations:
🟠 Swing Points Identified:
The orange circles mark significant swing highs and lows, clearly outlining a recent downtrend.
The latest swing low (bottom-right) shows a strong rejection with a bullish engulfing candle forming, indicating buyer interest.
📦 Demand Zone (Support Area):
The grey rectangle near the lower region marks a demand zone where buyers have stepped in before.
Price has reacted strongly from this zone again, validating it as a key support level.
📉 Resistance Turned Potential Breakout Zone:
The red line (~3,291.416) represents a resistance level that was previously support.
Price has broken above it and now appears to be retesting it, indicating a possible retest-confirmation for a bullish continuation.
🎯 Target & Risk Management:
✅ Entry: Confirmed breakout and retest around 3,291.
📈 Target: 3,364.819 (green zone above), based on previous resistance.
❌ Stop Loss: Below 3,267.772, the recent swing low.
The setup offers a favorable risk-to-reward ratio.
🧭 Projection Path:
The white arrowed path illustrates a likely pullback before continuation upward, suggesting a bullish structure if confirmed.
✅ Conclusion:
Gold is showing signs of a bullish reversal from a well-defined demand zone, with a potential rally toward the 3,365 area. A successful retest of the broken resistance as new support would strengthen the bullish bias.
📌 Watch closely for confirmation candles on the retest before entering.

XAUUSD PLAN END-OF-MONTH CASHOUT OR TREND REVERSAL? XAUUSD PLAN – MAY 30 | GOLD DROPS SHARPLY IN ASIAN SESSION | END-OF-MONTH CASHOUT OR TREND REVERSAL?
Gold surprised the market this morning with a sharp drop of nearly $30/oz, despite closing yesterday with a strong bullish daily candle. Profit-taking pressure near month-end and uncertainty surrounding US–China trade negotiations have returned gold to a bearish technical structure in the short term.
🌍 MACRO OVERVIEW:
US–China trade talks show no clear progress, with both sides signaling a cautious and non-committal stance.
Hedge funds and large players may be exiting ahead of monthly/weekly candle closes, causing increased volatility.
Meanwhile, investors are waiting for key US PCE inflation data and more Fed speeches, keeping risk sentiment fragile.
➡️ The market remains technically weak and highly reactive. Price is vulnerable to quick liquidity sweeps and false breakouts — best to stay reactive and trade confirmed zones.
📈 TECHNICAL ANALYSIS (H1 – EMA 13/34/89/200):
Gold has broken below EMA89 and is now trading beneath all major EMAs, indicating a strong short-term downtrend.
The resistance zone at 3,322–3,324 aligns with the EMA200 and a descending trendline, making it a prime area for short entries on rejection.
Key support sits at 3,266–3,264. A break below could send price to test deeper levels at 3,235 or even 3,210, following the broader descending channel.
The 3,274–3,276 zone (EMA13 crossing below EMA34) may offer minor reactions for scalpers in the London session.
🔍 TRADE SETUPS FOR TODAY:
🔵 BUY ZONE: 3,266 – 3,264
Stop Loss: 3,260
Take Profits:
3,270 – 3,274 – 3,278 – 3,282 – 3,286 – 3,290 – 3,300
🔻 SELL ZONE: 3,322 – 3,324
Stop Loss: 3,328
Take Profits:
3,318 – 3,314 – 3,310 – 3,306 – 3,300 – 3,295 – 3,290 – 3,280
🎯 INTRADAY SCALPING IDEAS:
BUY SCALP: 3,274 – 3,276 | SL: 3,270 | TP: 1R (50 pips max)
SELL SCALP: 3,302 – 3,304 and 3,310 zone | SL: 50–60 pips | Flexible TP
📌 SUMMARY:
The current momentum is bearish. Focus on short setups unless price clearly reclaims key EMAs. Scalping opportunities exist around reaction zones. With month-end volatility at play, avoid FOMO and stick to strict SL discipline.
💬 Found this plan helpful? LIKE – COMMENT – FOLLOW for daily GOLD strategies from the MMF Team, crafted for serious traders in India and beyond!

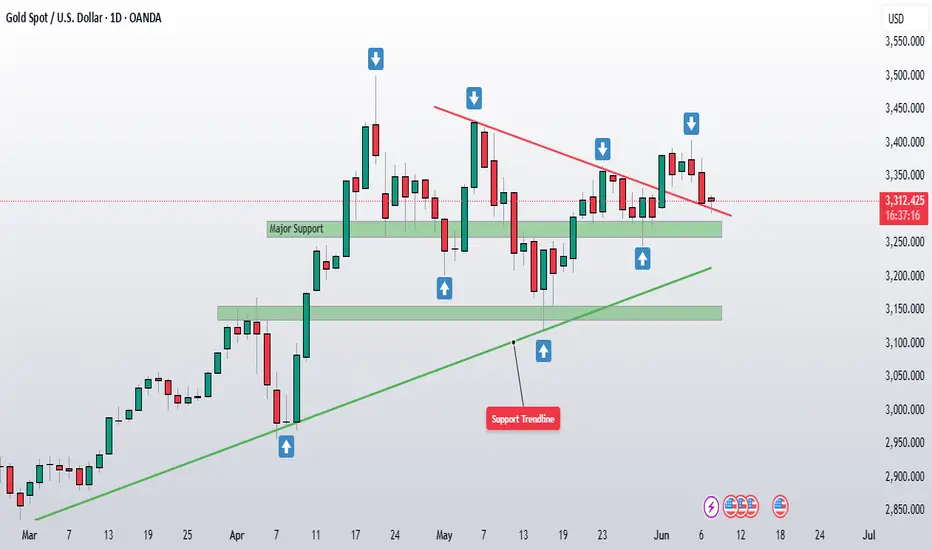
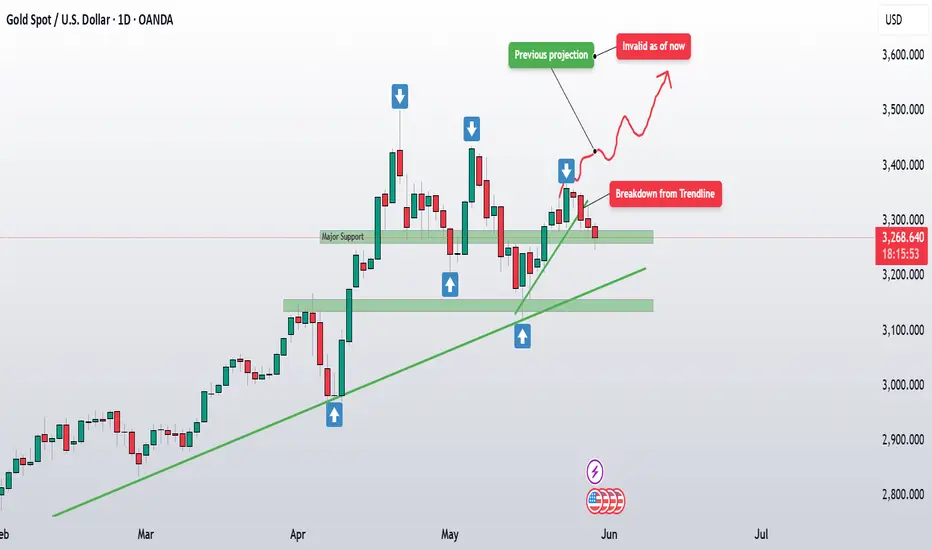
Gold stuck inside range : No clear direction as of now Yesterday, we have seen a strong bounce from the major support zone around 3260–3280 (marked as major support on chart), reclaiming the lost ground after the initial breakdown from the trendline (green line on chart). On daily time frame price seems to be stuck in a tight consolidation range and reflects a choppy environment where neither bulls nor bears have taken decisive control.
It's worth noting that we're right at the dynamic resistance zone ( the red trendline),which continues to cap any upside attempts. On the flip side, the major support area seems to be doing a decent job of holding the floor, at least for now.
With monthly and weekly closing candles coming up today, I’m still in "wait and watch" approach, just like yesterday. The price action around this consolidation zone isn’t giving any clear, high conviction directional clues.

GOLD RETESTING KEY ZONES AHEAD OF INFLATION DATA XAUUSD PLAN – MAY 29 | GOLD RETESTING KEY ZONES AHEAD OF INFLATION DATA | HOLDING OR BREAKING?
After yesterday’s sharp decline, GOLD is showing signs of stabilization around the 3,270 region. This appears to be a consolidation phase before the market reacts to key macro events — particularly the upcoming Core PCE inflation report and a string of Fed speeches this week.
🌍 MACRO LANDSCAPE:
US 10-year yields are holding steady near 4.5%, continuing to pressure gold in the short term.
Fed officials remain cautious about rate cuts, pushing back against dovish expectations.
However, concerns over structural fiscal pressure (including Fed losses and budget cuts) support the long-term bullish case for gold.
➡️ In the short term, the market remains range-bound, and tactical entries near key zones offer the best opportunities.
📈 TECHNICAL OUTLOOK (H1):
Gold is consolidating below a major resistance zone at 3,308–3,310, which aligns with the descending trendline and 200 EMA.
Fibonacci retracement zones (0.5–0.618) also highlight strong resistance around 3,297–3,309.
On the downside, support at 3,263 is key; a break below may expose the broader demand zone near 3,246.
🔍 TRADE SETUPS – MAY 29:
🔵 BUY ZONE: 3,247 – 3,245
Stop Loss: 3,241
Take Profit Targets:
3,251 – 3,255 – 3,260 – 3,264 – 3,270 – 3,275 – 3,280
🔵 BUY SCALP: 3,263 – 3,261
Stop Loss: 3,257
Take Profit Targets:
3,266 – 3,270 – 3,275 – 3,280 – 3,290 – 3,300
🔻 SELL SCALP: 3,294 – 3,296
Stop Loss: 3,300
Take Profit Targets:
3,290 – 3,286 – 3,282 – 3,278 – 3,274 – 3,270 – 3,260
🔻 SELL ZONE: 3,308 – 3,310
Stop Loss: 3,314
Take Profit Targets:
3,304 – 3,300 – 3,296 – 3,292 – 3,288 – 3,280
📌 STRATEGY TIP:
Price is range-bound ahead of key data. Avoid entering mid-range. Wait for price to reach the edges (BUY/SELL zones) and look for clear rejection or confirmation candles. Stick to strict risk management.

XAUUSD PLAN – MAY 28 |WATCHING FOMC + EU TRADE TENSIONS XAUUSD PLAN – MAY 28 | GOLD REBOUNDS SLIGHTLY BUT REMAINS UNDER PRESSURE | WATCHING FOMC + EU TRADE TENSIONS
Gold staged a mild technical recovery after last week’s heavy sell-off of nearly $100. While the bounce offers short-term opportunities, overall structure remains under bearish pressure unless bulls can reclaim the upper distribution zone.
🌍 MACRO CONTEXT – TRADE POLICY & MONETARY UNCERTAINTY:
Trump has delayed the 50% tariff on EU goods until July, calling recent trade talks “positive.”
In response, US 10-year yields spiked back above 4.55%, signaling market expectations for prolonged high interest rates.
Meanwhile, the Fed has announced a 10% workforce cut due to ongoing operational losses from interest payments — a rare move that underscores deeper fiscal constraints.
➡️ With mixed risk sentiment and no clear policy direction, Gold remains a safe-haven focus — but vulnerable in the short-term if yields and the dollar continue to rise.
📈 TECHNICAL OUTLOOK (H1):
Gold is currently trading below the 3,335–3,346 resistance zone, which has repeatedly rejected bullish attempts.
If price fails to reclaim this zone, we could see renewed bearish momentum toward the lower FVG support.
The Fair Value Gap near 3,248 remains a major zone of interest if sellers regain control.
🔍 TRADE PLAN – UPDATED LEVELS:
🔻 SELL ZONE: 3,344 – 3,346
Stop Loss: 3,350
Take Profit: 3,340 – 3,336 – 3,332 – 3,328 – 3,324 – 3,320
🔻 SELL SCALP: 3,326 – 3,328
Stop Loss: 3,332
Take Profit: 3,322 – 3,318 – 3,314 – 3,310 – 3,305 – 3,300
🔵 BUY SCALP: 3,278 – 3,276
Stop Loss: 3,272
Take Profit: 3,282 – 3,286 – 3,290 – 3,294 – 3,298 – 3,302 – 3,310
🔵 BUY ZONE: 3,246 – 3,244
Stop Loss: 3,240
Take Profit: 3,250 – 3,254 – 3,258 – 3,262 – 3,266 – 3,270 – 3,280
📌 STRATEGY TIP:
Avoid mid-range entries. Let price come to your zones. Prioritize confirmed reactions, especially near structural levels like 3,335 and 3,248.

Gold Major Support in Focus: Will It Hold or Slide Further?Gold is testing a major support zone around 3260–3280 after breaking down from trendline support and following up with another red candle.
This breakdown suggests that the recent bullish momentum has faded, and now we have to wait to see if this support can hold. If it doesn’t, the next downside target looks to be around 3130–3155, with even 3000 as a longer-term possibility if the pressure continues. Right now, I’m staying out of any trades, preferring to wait and see if this support zone can provide a bounce or if we’re heading for deeper levels. The price action isn’t giving any clear reversal signs at current area as of now and wee have to assess this on week closing basis.
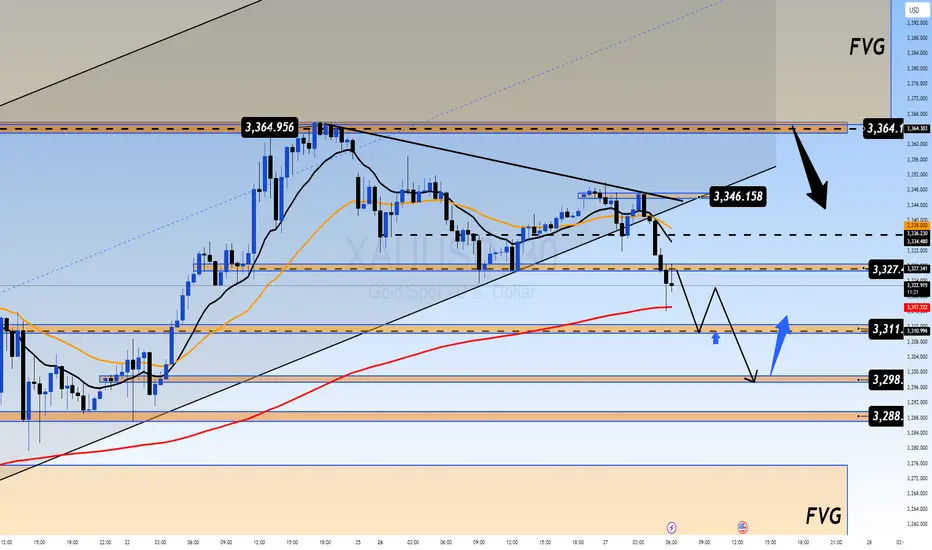
GOLD TRADING INSIDE COMPRESSION ZONE WAITING FOR A CLEAR BREAK XAUUSD PLAN – MAY 27 | GOLD TRADING INSIDE A COMPRESSION ZONE – WAITING FOR A CLEAR BREAKOUT
Gold continues to consolidate below the 3,364 resistance zone after a rejection late last week. The market is currently trading within a compression range, preparing for a breakout – but direction still depends heavily on macro triggers and technical structure.
🌍 MACRO CONTEXT:
U.S. 10-year yields remain above 4.5%, keeping the dollar stable and applying short-term pressure on precious metals.
The Fed’s cost-cutting moves and operational losses are raising deeper concerns about long-term monetary stability.
Risk sentiment is mixed, and institutional money continues to flow cautiously into gold as a long-term value hedge, especially with equities showing signs of exhaustion.
📈 TECHNICAL OUTLOOK (H1):
Price failed to break through the 3,345–3,364 resistance zone, triggering a pullback toward the mid-range.
Key support around 3,311 is now being tested – a decisive level that could determine whether bulls can regain momentum or bears take control.
If price breaks below 3,311, we could see a deeper dip toward the 3,298–3,288 demand zone, which may offer a better re-entry for buyers.
On the upside, a confirmed break above 3,364 could open the door for a move into the Fair Value Gap toward 3,407.
🔹 TRADE SETUPS:
🔵 BUY SCALP
Entry: 3,314 – 3,312
Stop Loss: 3,308
Take Profit Targets:
3,318 – 3,322 – 3,326 – 3,330 – 3,340 – 3,350
🔵 BUY ZONE
Entry: 3,298 – 3,296
Stop Loss: 3,292
Take Profit Targets:
3,302 – 3,306 – 3,310 – 3,314 – 3,320 – 3,330
🔻 SELL SCALP
Entry: 3,346 – 3,348
Stop Loss: 3,350
Take Profit Targets:
3,342 – 3,338 – 3,334 – 3,330 – 3,320 – 3,310
🔻 SELL ZONE
Entry: 3,364 – 3,366
Stop Loss: 3,370
Take Profit Targets:
3,360 – 3,356 – 3,352 – 3,348 – 3,344 – 3,340 – 3,330
📌 Note:
Price is trading in the mid-range of a larger structure. Best opportunities remain near the edges of support/resistance with confirmation. Avoid overtrading in the middle zone. Let the market come to your areas of value.
💬 If you found this plan helpful, Like + Comment + Follow for daily GOLD strategies from the MMF Team.
Gold Analysis Update: Bulls Holding Strong Above 3330Gold has been holding steady above the major pivot level at 3330, with price action continuing to create higher highs and showing strong respect for the ascending trendline support. This tells us that the bulls remain firmly in control. Currently, there’s no major rejection around these levels, and the volume is still supportive of the move higher, with no clear signs of exhaustion yet.
I’m also keeping an eye on the Fibonacci retracement levels visible on the chart: price is above the 0.786 mark at 3369 and could push towards the 1.0 level at 3436 if momentum remains strong.
