XAU/ USD) bullish trend analysis Read The ChaptianSMC Trading point update
analysis for XAUUSD (Gold vs. USD) on the 2-hour timeframe appears to suggest a bullish continuation setup after a correction. Here's a breakdown of the idea:
Key Points from the Chart:
1. Rising Channel:
The price is moving within an ascending channel.
After a breakout and strong rally, it is currently in a flag or wedge-like correction pattern.
2. Correction Zone:
The price is consolidating downward inside a small descending wedge (a bullish pattern), potentially forming a bull flag.
This is typically a sign of continuation after a strong upward impulse.
3. Support Zone:
A 4H support level is marked around 3,301.416, which aligns with the lower boundary of the flag pattern.
This is a potential buy zone for price to react and bounce.
4. Target Point:
The target is projected at 3,404.254, implying a breakout to the upside if the support holds.
5. RSI Indicator:
RSI is currently around 65, with previous values near 80, suggesting a slight cooldown but still in bullish territory.
A slight drop in RSI might occur before the next bounce.
6. EMA 200:
The EMA 200 is well below current price (around 3,137), indicating a strong bullish trend.
Mr SMC Trading point
Possible Trade Idea:
Entry: Around the 3,301–3,305 support area.
Confirmation: Wait for a bullish reversal pattern (engulfing candle or strong bounce).
Target: Around 3,404 (as per the marked target zone).
Stop Loss: Below the support zone (e.g., below 3,295), depending on risk tolerance.
Pales support boost 🚀 analysis follow)
Commodities

Extreme Sentiment in Metals: Gold & Silver Correction Ahead?In my previous update for this week , Despite my expectation of a correction beginning this week, Gold closed with a 3% gain yesterday, showing amazing strength . The daily chart still reflects an overbought RSI on monthly (85) and weekly (80) timeframes, reinforcing my view that a correction phase is imminent.
While Gold has soared, Silver has lagged, failing to reclaim its late March high. I expect Silver to follow gold during this correction, potentially pushing the Gold/Silver ratio higher to a target of 110-114. The recent upside move in Silver formed an ending diagonal with a powerful throw-over, suggesting exhaustion. For Silver to confirm an uptrend and invalidate the corrective count, it must break above 33.45.
Sentiment levels are at extremes, with the Daily Sentiment Index hitting 83 for Gold and 87 for Silver, indicating overbought conditions that often precede reversals. A major concern is the Dollar Index (DXY), which looks set to make a lower low after forming an triangle on the 1-hour chart. When DXY turns up, metals are likely to face heavy pressure. I believe better entry points for bullish metals positions will emerge after this correction, especially as DXY bottoming process nears.
Despite Gold recent strength, my view remains unchanged —both metals are due for a correction. Gold rally off the April 7 low appears corrective (wave iv) compared to the impulsive wave iii sell-off, and Silver ending diagonal adds to the bearish case.
The lack of daily close confirmation for a correction in Gold hasn’t altered my stance, but I’m watching closely. The DXY anticipated rally could be the catalyst to push metals lower. I’m targeting Gold support at 3,150-3,168 and then 3000 for this correction and Silver critical level at 30.50 as key areas to monitor.
Crudeoil levels for upcoming weekMCX:CRUDEOIL1!
After sharp fall in crude oil, now having Consolidation from 10th Thursday.
🚨Breakout above 5395
TGT 1️⃣ - 5505
TGT 2️⃣ - 5680
🚨Breakdown below 5175
TGT 1️⃣ - 4860
Apply stoploss according to you risk appetite

More downside space for GOLDImmediate support for XAUUSD will be between the $3015 to $2995 range as shown in the rectangular box in the chart.
Prices from here if validates the breakdown of the support zone will test the trendline hovering at around 2985.
From there downside targets are 2941, 2852.345 and 2778 respectively. These are long-term targets.

Gold Hits New ATH Amid Escalating US-China Tensions Gold Hits New ATH Amid Escalating US-China Tensions 💰📈
The market has become more sensitive than ever as investors are deeply influenced by decisions from the world’s most powerful leaders. The ongoing tensions between Trump and Xi Jinping are causing uncertainty, making gold the natural safe-haven asset for investors seeking refuge.
At this point, the question is no longer whether gold will rise or fall, but rather how far it can go with geopolitical tensions still high and escalating daily. A retaliatory decision could cause gold to spike by dozens of points, while a temporary halt in tariffs could lead to a sharp drop. The market is incredibly sensitive to economic policy decisions and political developments right now.
Currently, candle confirmations are less reliable, as bullish confirmations are often followed by sudden reversals. This makes it crucial to focus on key levels and avoid rushing into trades. Scalping should be done with caution, and identifying clear entry points is vital.
Key Support Levels:
3280, 3268, 3258, 3240, 3230
Key Resistance Levels:
3292, 3302, 3310
Trade Strategy:
SELL ZONE: 3302 - 3304
SL: 3308
TP: 3298 - 3294 - 3290 - 3286 - 3280
BUY ZONE: 3270 - 3268
SL: 3264
TP: 3274 - 3278 - 3282 - 3286 - 3290 - 3300
BUY ZONE: 3240 - 3238
SL: 3234
TP: 3245 - 3250 - 3255 - 3260 - 3264 - 3268 - 3274 - 3280 - OPEN
Risk Management: As mentioned above, the market is extremely sensitive and unpredictable right now. Please remain cautious, and always adhere to your TP/SL levels to protect your account. 🛡️

Gold Final Run ?Unedited chart ...Seems like gold is in final run (Max extension for this run that I am expecting is towards 3310-3330) , still expecting a rollback but as discussed in previous posts we have to wait for confirmation on day close ...Price is at Panic zone for both buyers and sellers...
I am looking for short at CMP 3280-3310 area ...

Strong Breakout and Continuation Within Sideways RangeGold Analysis: Strong Breakout and Continuation Within Sideways Range 💰📈
Gold (XAU/USD) made a strong move within its sideways range after breaking down below the 3215 level. At the start of the Asian session, gold bounced back and is now maintaining an upward movement within the range from 3245 to 3215, forming a small upward channel on the M15 timeframe. This is a clear continuation of the bullish trend.
Key Support Levels:
3215, 3204, 3195, 3188, 3178, 3168
Key Resistance Levels:
3235, 3245, 3257, 3272
The buying pressure remains strong, especially at the recent support level of 3196, where we saw a quick response of 30 pips back up. There is still significant buying interest below these levels, just waiting for the right opportunity for another entry.
Today's Strategy:
With no major U.S. news expected today, the price range is likely to be similar to yesterday, with a move of about 30-40 pips. We are waiting for a pullback to buy again, and will avoid sell signals in the current market environment. Even if we anticipate a drop, the focus should be on buying at good support levels rather than selling too early.
Trade Setup:
BUY ZONE: 3196 - 3194
SL: 3190
TP: 3200 - 3204 - 3208 - 3212 - 3216 - 3220 - 3225 - 3230
SELL ZONE: 3244 - 3246
SL: 3250
TP: 3240 - 3236 - 3232 - 3228 - 3224 - 3220
Important Reminder:
If gold fails to break the 3135 level, consider selling back to the 311x zone. If the price reaches 3135 and continues to show strong buying pressure, wait for a potential push towards 3145 and consider selling if the previous resistance holds. Always stick to your TP/SL levels to ensure risk management.
Final Thoughts:
AD expects a pullback or correction during the end of the Asian session or at the beginning of the European session, providing an opportunity to buy at better levels. Avoid buying at uncertain levels and wait for the ideal pullback.
Trade Safely and manage your positions with clear TP/SL targets. Always prioritize risk management to protect your account.

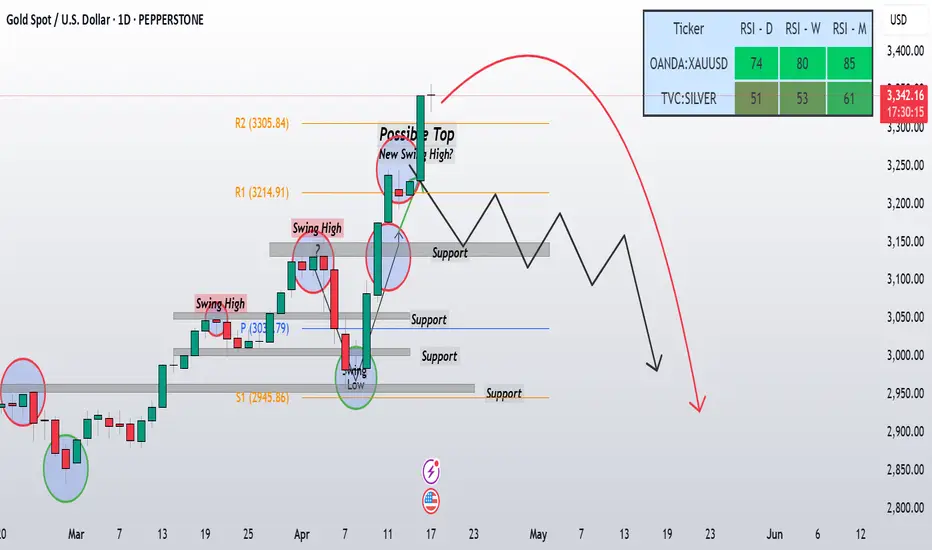
Gold Update: Rejection at 3245, Support at 3200—More Downside ?As anticipated, we’ve seen some rejection around the "New Swing High?" zone , and Gold has pulled back to find support around the 3,200 level. This aligns with the price action we discussed, and the market behaving as expected so far. 🔍
Monday Price Action :
In my last post, I highlighted that Gold was overextended after hitting an all-time high near, with overbought RSI readings on the monthly (84) and weekly (77) timeframes. I expected a correction, and we’ve now seen the price drop from that high to test the 3,200 level, which has acted as short-term support. This pullback reinforces the idea that the rally needed to cool off, and we’re seeing that play out.
View Remains the Same:
Correction Still in Play
My view hasn’t changed—I’m still leaning towards a deeper correction in the near term. While the 3200 level has provided some support, it’s not a major support zone yet. The first significant support remains at the previous swing high of 3,150-3,168, which I expect Gold to test soon. The overbought conditions on higher timeframes still suggest more downside potential before the uptrend can resume. If we break below 3,150, the next support zone between 3,040-3,050 could come into play, where I’d expect stronger buying interest for Intra day.
What to Watch For
-Resistance at last week high: The recent high remains a key resistance. Any rally back towards this level could face rejection again, offering another shorting opportunity.
- Support at 3,150-3,168: This is the next major level to watch. A break below 3,200 could see Gold head straight for this zone,
Final Thoughts :
Gold is playing out as expected, with the rejection from from the zone marked on chart leading to a pullback that found support at 3,200. However, I believe this correction has more room to run, and I’m still targeting the 3,150-3,168 zone as the next key level.

Sideways Action Awaiting Liquidity Pullback Before Push to $3300Gold Price Strategy for the Week: Sideways Action Awaiting Liquidity Pullback Before Push to $3300 💰📈
Gold (XAU/USD) is currently moving sideways within a wide range of 30 price levels, from 3246 to 3216, and is showing hesitation at these levels. There is no clear indication yet if gold will continue to rise or if we’ll see a corrective phase to gather liquidity. Currently, indicators are showing that gold is overbought, and a strong pullback to gather liquidity could happen anytime. The buying pressure has decreased compared to last week, and FOMO seems to have faded, so we may watch for an entry point during the European session today. If gold fails to push higher, we could consider a potential sell entry.
Key Resistance: 3246 (ATH), 3255, 3268, 3285, 3302
Key Support: 3216, 3195, 3172, 3152, 3120
Buy Zone 📈: 3172 - 3170, SL: 3166, TP: 3176 - 3180 - 3184 - 3188 - 3192 - 3196 - 3200
Sell Zone 🔽: 3268 - 3270, SL: 3274, TP: 3264 - 3260 - 3256 - 3252 - 3248 - 3244 - 3240
Market Outlook:
This week, there are no major news events to focus on, so the strategy will primarily revolve around observing the market volume for clues on the next move. The key focus will be on the European and U.S. sessions to determine the market direction more clearly. With the current market volatility, it’s essential to stick to your TP/SL levels for risk management and to protect your account.
Important Reminder: Despite the lack of news, the market remains extremely unpredictable, and large price movements are likely. Always adhere to your TP/SL and manage your trades carefully. 🛡

Gold Hits All-Time High: Is a Correction Coming? Recent Price Action Recap
Gold has been in a strong uptrend, as evidenced by the series of higher highs and higher lows on the daily chart. Last week, it broke above the previous swing high around the 3,150-3,168 zone, which I had initially flagged as a possible top in previous posts. However, the bulls showing amazing strenght again, pushing the price to a new all-time high near 3,240-45 area, as indicated by the "New Swing High?" zone on the chart. This breakout above the prior swing high confirms the continuation of the bullish momentum, but there are signs that this rally might be overextended.
Overbought Conditions on Higher Timeframes
While I’m not a huge fan of the RSI, I do pay attention to it on larger timeframes to gauge potential overbought or oversold conditions. On the monthly timeframe, Gold’s RSI is sitting at 84, which is significantly overbought. On the weekly chart, the RSI is at 77, also indicating overbought territory. These elevated RSI levels suggest that the market may need to cool off before resuming its upward trajectory. Historically, such high RSI readings often precede a consolidation or correction phase , as the market takes a breather after a strong rally.
First Major Support (3,150-3,168) : This zone, previously a swing high, should now act as support on any pullback. It’s a key area where buyers might step in to defend the uptrend. This level also aligns with the upper boundary of the support zone marked on the chart.
My View: A Correction Is Likely
Given the overbought RSI readings on the monthly and weekly timeframes, combined with the overextended rally on the daily chart, I’m leaning towards a correction phase in the near term. The price action around the "New Swing High?" zone at shows signs of hesitation as we have seen week open with a gap down, with a sharp drop following the peak, suggesting potential exhaustion among buyers. While the uptrend remains intact, I expect Gold to roll back this week to test the first major support at 3,150-3,168 or lower zone as marked on chart.

A Long-Term Outlook on Gold and the U.S. DollarTechnical and Fundamental Analysis: A Long-Term Outlook on Gold and the U.S. Dollar
1. Technical Analysis:
Gold (XAU/USD):
Current Price: Gold is currently trading around the 3,219.39 level, marking a significant high compared to recent price levels. This is seen as a major resistance point that could limit the price in the short term.
Key Support and Resistance Levels:
Resistance: 3,164.62, 3,190.48, 3,219.39
Support: 3,118.98, 3,069.60
Moving Averages (MA):
MA 13 (Short-Term) and MA 34 (Medium-Term) both lie below the current price, indicating a bullish trend in the short to medium term.
MA 200 (Long-Term) shows that the long-term trend for gold remains strong and stable, with the price currently trading above all these moving averages.
Current Situation: Gold is on a strong upward trajectory, supported by economic factors such as the Federal Reserve's interest rate policies and overall monetary policies. The current price suggests that gold could continue to rise in the short term, particularly if the U.S. Dollar remains weak.
Long-Term Outlook: If the resistance level of 3,219.39 is breached, gold could potentially move towards the 3,250 level and beyond. However, caution should be exercised as profit-taking may occur towards the end of the week. Avoid FOMO and buying at the peak.
2. Fundamental Analysis:
U.S. Dollar (DXY Index):
The DXY Index is currently in a strong downward trend, trading below 100.554. It may continue to fall towards 99.783 in the upcoming months.
Key Support Levels for USD: 99.783 and 97.500. If the DXY continues to drop and breaks these levels, it would put additional pressure on the USD and be supportive for gold.
Impact of Monetary Policies:
The Federal Reserve has indicated a potential interest rate cut in the future, which would continue to pressure the U.S. Dollar and support gold, especially amid global economic concerns.
Economic Situation in the U.S.: With some economic indicators such as CPI and PPI showing weakness, the U.S. economy is facing challenges. This adds further pressure to the U.S. Dollar and provides an advantage to gold.
3. Long-Term Perspective:
Gold is currently in a strong bullish trend, supported by both technical and fundamental factors. In the short term, gold may continue to rise as long as the U.S. Dollar remains weak. However, caution should be exercised toward the end of the week due to potential profit-taking.
For Gold (XAU/USD): If gold breaks key resistance levels, it could continue to rise in the long term, especially if the U.S. Dollar remains weak. However, caution should be taken at the peaks.
As for the U.S. Dollar: The DXY is expected to continue its decline in the short term, which would further support gold. However, if the DXY starts to recover, gold might face some pressure.
Trading Strategy:
Preferred Buy Zones for gold: 3,118.98 and 3,069.60. But be cautious as profit-taking could occur toward the end of the week.
Avoid selling gold unless the major resistance levels are broken and clear signals emerge from the market.
Conclusion:
With gold continuing its upward trend, supported by favorable monetary policies and economic expectations, gold remains a strong opportunity for both short and long-term investors. However, investors should be cautious about profit-taking towards the weekend. Monitoring future performance of the U.S. Dollar and any changes in Federal Reserve monetary policy will be crucial.

Gold’s New All-Time High Could Be #Bitcoin Signal🚨 Gold’s New All-Time High Could Be #Bitcoin Signal 🟡
And if history repeats, Bitcoin could be next.
Every time #Gold moves first, Bitcoin usually follows with a major rally. If that happens again, we could see a new Bitcoin ATH in Q2-Q4 of 2025.
Are you ready for the next big move? 🚀
CRYPTOCAP:BTC #BullMarket

GOLD XAUUSDGold is into bullish uptrend where everyone wishes to get boarded and super bullish for coming months. however personally I am not comfortable with this pace of the metal. I had gone wrong multiple time with this bullish up move. I will be more happy to go wrong again.
Bullish up move parallel channel upper edge again may act as profit booking area. 3250 is imp level for bulls.
It's too early to say if profit booking comes after that or it's going to be sideways movement which act as time correction with price staying range bound.

Naturalgas downtrend Movement upto 3.2Symbol Naturalgas
Timeframe 1 hour
Analysis Breakout Below the suport line
can expect a downtrend movement upto 3.2
We hope our analysis is adding value to your trading journey.
Please note: Published ideas are for educational purposes only. Trade at your own risk.
Also, please respect the risk - stop loss (SL) should not be more than 2% of the capital.
DISCLAIMER: We are not SEBI registered. All the ideas uploaded in this channel are solely for educational purposes."

WTI Crude Oil TradeSetup:Demand Zone Reversal & Trendline Brkout📉 Trendline Resistance
🔴🔴🔴 (Multiple rejection points along the descending trendline)
📊 Demand Zone (Support Area)
🟦 Blue Zone (59.08 - 57.90) → Potential Reversal Area
✅ Entry Point: 59.08
🟡 (Marked in yellow) – Ideal buy zone
🎯 Target Point: 63.90
🔵 (Top Resistance Level) – Profit-taking zone
⛔ Stop Loss: 57.90
🟥 (Risk Management Zone) – To prevent big losses
📈 Possible Scenario:
1️⃣ Price drops into 🟦 demand zone
2️⃣ Bounces ⬆️ off support (bullish move 🚀)
3️⃣ Hits 🎯 target (63.90) ✅
⚠️ Alternative Scenario:
If price 📉 breaks below 🟥 stop loss, downtrend may continue.
This trade setup looks good with a 4:1 risk-reward ratio! 🏆

Gold at ATH : Bullish Continuation or False Breakout AheadAs expected gold followed my last post and now trading on ATH
As discussed in last post we have following scenario from here:
Bullish Scenario
If today's candle closes with a strong bullish breakout formation (a solid body with minimal upper wick), this would confirm the breakout validity and suggest continued upward momentum. In this case:
Entry opportunities would arise on potential pullbacks to the breakout level, which should now act as support
The lack of historical resistance above current levels could allow for extended momentum
Volume confirmation would be crucial to validate the strength of this breakout
Bearish Scenario
If price rejects from current levels and forms a bearish candle (particularly if it creates a shooting star, engulfing pattern, or closes back below the breakout level), this could indicate a false breakout. In this case:
A short position could be considered with stops above today's high
Target levels would be the previous consolidation zone
This rejection could lead to a period of consolidation before the next decisive move
"WTI Crude Oil – Bullish Bounce from Demand Zone? "🔵 . Demand Zone:
⬇️ 60.53 – 59.71
This is the buy zone where bulls are likely to step in!
Price is currently testing this area. Watch closely!
🛑 . Stop Loss (Risk Zone):
📉 Below 59.66
If price falls below here, exit the trade – demand has failed.
🎯 . Target Point:
🚀 63.85
This is the take profit zone. A successful bounce could reach this level!
🟠 . EMA (9-period DEMA):
📉 Currently around 60.86
Price is slightly below EMA, showing short-term bearish pressure.
🟢 . Trade Idea Summary:
• Enter near the blue demand zone
• SL below 🔴 59.66
• TP at 🎯 63.85
• R:R ratio looks favorable (low risk, high reward)
Outlook:
As long as price holds above the demand zone, this setup remains bullish 📈
Let’s see if the bulls can push it to that 63.85 target! 🚀💰

Gold's Strong Recovery: Key Levels to Watch in XAU/USDXAU/USD Technical Analysis: Gold Shows Strong Recovery Amid Global Economic Optimism 💰📊
Introduction: Gold (XAU/USD) is currently experiencing a strong recovery, supported by several key factors in the global economic landscape. One notable factor is the 90-day tariff suspension for major countries worldwide, which has created a more positive sentiment among investors. Additionally, U.S. stock markets saw a strong boost as this news was announced. The recent FOMC meeting also highlighted the potential for interest rate cuts later this year, further boosting optimism across financial markets. 📈
Technical Analysis: On the XAU/USD chart, gold is showing a solid recovery from recent lows. The price has broken through key resistance levels and is now approaching new highs. Here are the important resistance and support levels that traders should keep an eye on:
Key Resistance Levels:
3146
3162
3168
Key Support Levels:
3096
3078
3066
3052
Moving Averages (MA):
MA 13 (Orange Line): This short-term moving average is supporting the upward trend and providing BUY entry signals when the price is above MA 13.
MA 34 (Yellow Line): The medium-term MA is positioned above the price, further supporting the bullish trend.
MA 200 (Red Line): The long-term MA is confirming a strong uptrend as the price remains above MA 200, reinforcing the positive outlook for gold.
Trading Plan:
BUY ZONE 📈:
Buy Zone: 3096 - 3094
SL (Stop Loss): 3090
TP (Take Profit): 3100 - 3104 - 3108 - 3112 - 3116 - 3120
SELL ZONE 🔽:
Sell Zone: 3164 - 3166
SL (Stop Loss): 3170
TP (Take Profit): 3160 - 3156 - 3152 - 3148 - 3144 - 3140
Fundamental Analysis: Yesterday was a positive day for gold, with various fundamental factors supporting the short-term and medium-term bullish outlook. The suspension of tariffs for 90 days among major countries has created a positive sentiment, and the possibility of interest rate cuts from the FOMC has strengthened the expectation of gold's recovery. 📈💡
Risk Management Advice: Given the current market momentum, the strategy is to focus on BUY entries near key support levels. However, traders should be cautious when selling, as the bullish trend may continue strongly if the price breaks through key resistance levels. Always apply proper risk management by using stop loss and only trade with capital you can afford to lose.
Conclusion: Gold is currently in a strong recovery cycle, with both fundamental and technical factors supporting the uptrend. Traders should watch for key support and resistance levels to implement their trading strategies effectively. Be prepared for BUY opportunities near support zones and watch the resistance levels for potential sell signals as the market moves forward. 📊📉
What are your thoughts on Gold's movement? Share your analysis and trade ideas in the comments below! 💬👇

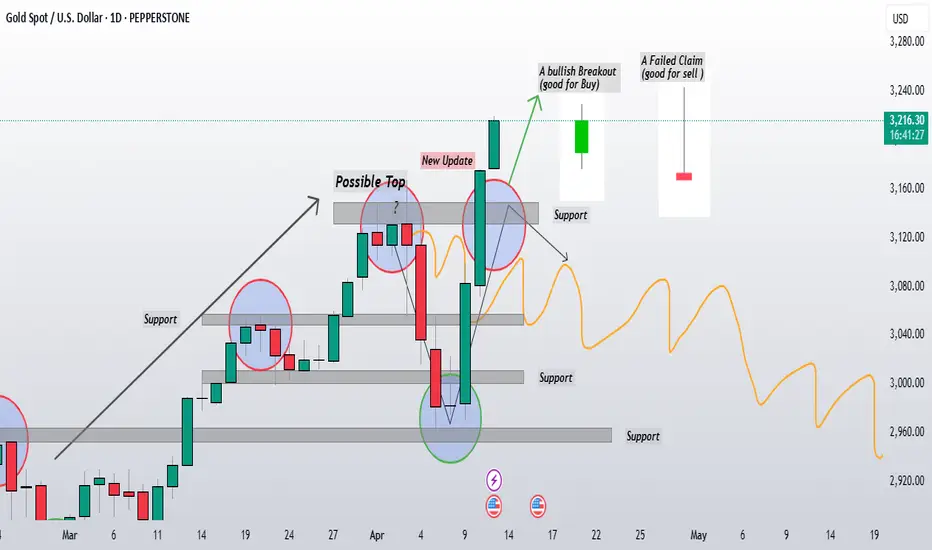
Gold Decisive Moment: Breakout or Reversal at All-Time Highs?In my previous update, I highlighted a critical weekly support zone between 2,950 and 2,960 (Green Circle ), and as expected, gold bounced beautifully from that level.
However, the market surprised me with its speed— we saw a sharp 3% gain in a single day! I had anticipated 1-2 days of consolidation around that support before such a move, but the strength of the support I identified held firm, proving its reliability once again.
Given this sudden shift and the strong buying momentum, I’ve updated my chart to reflect the new possibilities.
Previously, my bias leaned toward a potential double-top formation at the all-time high (ATH) level, around 3,150-68, as marked in the “Previous Expectation” zone. My plan was to look for a confirmed sell setup once we hit that resistance. But with the recent surge, we need to adapt and consider both bullish and bearish scenarios moving forward.
Bullish Case: If we see a strong daily close above the ATH—or a decisive breakout on the 4-hour chart—gold could be move for a continuation to higher levels, potentially targeting the upside projection I’ve marked with the green arrow. This would signal a new leg up, and we’d want to ride that momentum with a buy setup. Keep an eye on volume and price action for confirmation; a clean break with conviction could take us well beyond the current highs.
Bearish Case: On the flip side, if gold fails to sustain above the ATH and shows signs of rejection, the bearish scenario I outlined earlier remains in play. A double-top confirmation at this resistance could lead to a reversal, with price potentially dropping back toward the support zones I’ve marked around 3,000 and lower. We’d need to watch for a failure to hold the highs, possibly with a bearish candlestick pattern or a break below key short-term support on the lower timeframes.
For now, the market has shown its hand with this aggressive buying pressure, but we must remain vigilant. The new area I’ve marked as “New Update” around the current price action suggests we’re at a pivotal moment.

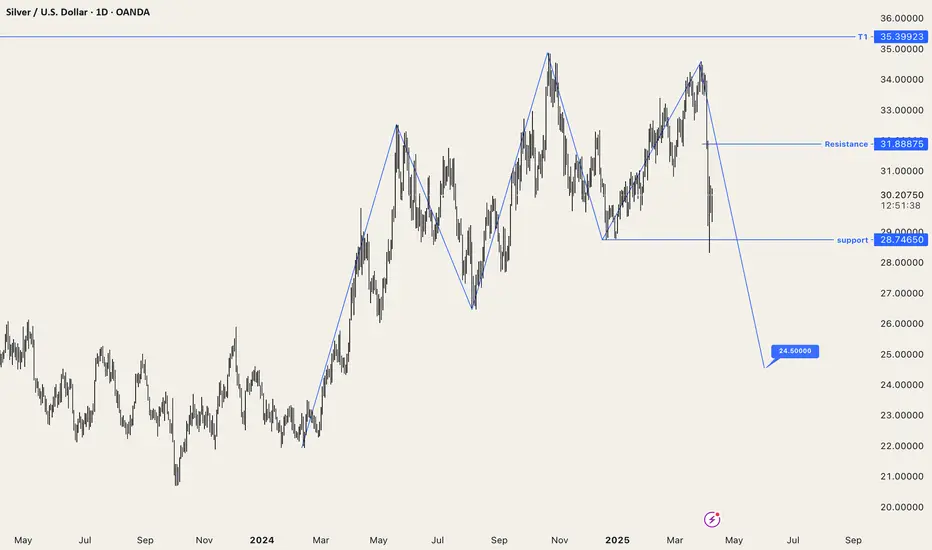
XAG: Silver projected for a fall till 24.50
Bearish invalidation if the price doesn't close, confirms the close below $28.75, and breaks the resistance level of 31.8875.
Right now it's a wait-and-watch scenario. Trade for sell will be active either on rejection of resistance or break-down of support
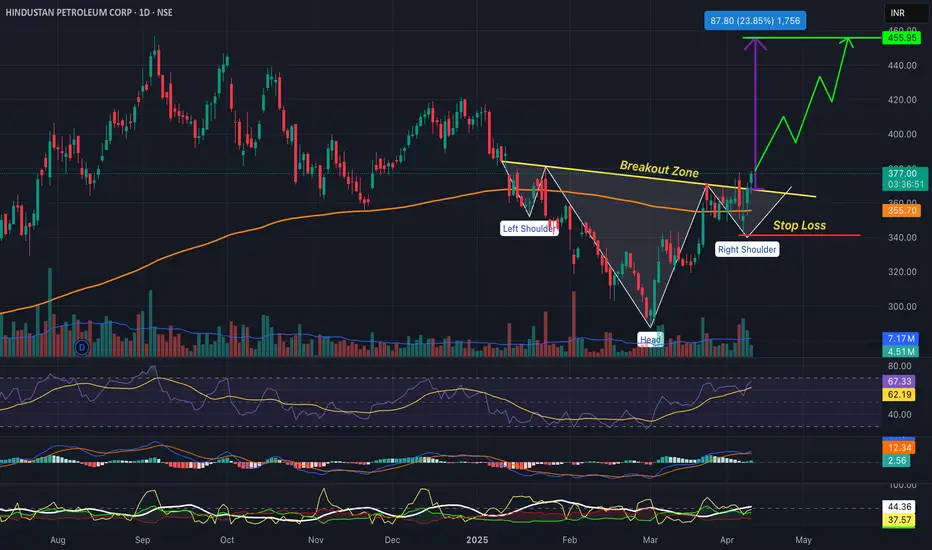
HPCL - Inverted Head and Shoulder A reversal pattern at the bottom.
Inverted H&S pattern.
Breakout has been done.
Breakout zone - 368-375
Support Zone - 345
Pattern Breakout Target Range - 455.
Volumes are low as of now.
Fundamentally Crude is falling which will increase the margins as well.
XAU/USD) Bearish trand analysis Read The ChaptianSMC Trading point update
This chart analysis is for Gold Spot (XAU/USD) on the 1-hour timeframe. Here’s a breakdown of the idea shown:
---
Key Points in the Analysis:
1. Current Price:
XAU/USD is around $2,982.92 at the time of the chart.
2. Trend:
The chart suggests a bearish outlook.
Price has been consistently rejected from the yellow supply zone (around 3,020–3,033).
EMA 200 (blue line) is above the current price, confirming downward momentum.
3. Rejection Zone:
Marked in yellow between 3,020 and 3,033. Labeled as “Reject points”.
Price failed to break above this zone multiple times.
4. Breakout Pattern:
Two descending rectangles highlight bearish continuation patterns.
A bearish flag or wedge is visible, followed by a breakout downward.
5. Target Zone:
Highlighted in yellow between 2,900 and 2,921, with target point at 2,920.615.
Price is expected to move down to this level.
6. RSI (Relative Strength Index):
RSI is declining and shows bearish divergence, supporting downside move.
Currently around 39.19, which is closer to oversold territory but still has room to drop.
Mr SMC Trading point
---
Trade Idea Summary:
Bias: Bearish
Entry Area: Rejection near 3,020–3,033 zone
Target: 2,920.615 (highlighted support zone)
Stop Loss: Could be placed above 3,033 (supply zone or EMA 200)
Confluence Factors:
EMA 200 rejection
Bearish RSI divergence
Repeated supply rejection
Breakout from bear flag structures
Pales support boost 🚀 analysis follow)

XAU/USD) bearish rejected fvg analysis Read The ChaptianSMC Trading point update
This chart analysis of Gold (XAU/USD) on the 2-hour timeframe appears to be a bearish setup based on Smart Money Concepts (SMC). Here's a breakdown
Key Elements:
1. Price Channel Break & CHoCH:
The price was in a rising channel.
A clear Change of Character (CHoCH) occurred after the price broke below the structure, signaling a shift from bullish to bearish.
2. Fair Value Gap (FVG):
There's a bearish Fair Value Gap (FVG) highlighted in the yellow box around the 3,047–3,075 level.
The expectation is that price may retrace into this FVG before continuing downward.
Mr SMC Trading point
3. Target Zone:
A major demand zone or target point is marked around 2,940, indicating a potential bearish move of around -148 points (~4.8%) from the FVG.
4. EMA & RSI:
200 EMA is around 3,047, acting as dynamic resistance now.
RSI is below 40 and trending down, showing bearish momentum with slight bullish divergence, hinting at a short retracement before another drop.
---
Summary of the Idea:
Bias: Bearish
Trade Plan:
Wait for price to retrace into the FVG zone (~3,047–3,075).
Look for bearish confirmation (like bearish engulfing or rejections).
Enter short with a target at 2,940, stop above FVG.
Pales support boost 🚀 analysis follow)
