USOIL - TRADING NEAR IMPORTANT DEMAND ZONE - TREND REVERSAL?Symbol - USOIL
CMP - 66.58
The USOIL has recently experienced a decent correction over the past few weeks, which has provided an opportunity for price consolidation near an important support zone before the potential upward price growth. This correction has allowed the market to stabilize, and the recent price action suggests that the price may show a reversal from the major support zone which has held since March 2023
Geopolitical tensions and OPEC production cuts continue to play a significant role in influencing oil prices, while global economic recovery, particularly in major consuming nations, provides further optimism for sustained demand. These factors are likely to continue supporting oil prices as market participants remain cautious about future supply disruptions. With the recent correction now completed, USOIL appears poised for further upward momentum, especially if these bullish fundamentals continue to hold.
Technically, the key support level to watch is $66.50 - $65.20 If this level is defended by the bulls, the price is likely to push towards the $69.00 - $70.20 range, which represents the next major resistance zone.
Resistance levels: $69.15, $70.20
Support level: $66.00, $65.20
The price has recently tested the $65.20 support zone. A potential false breakdown could occur here, aimed at capturing liquidity before prices resume their upward trajectory. With the correction phase likely behind us, renewed buying interest in USOIL could drive prices higher as the uptrend continues to unfold.
Commodities

GOLD TRADING POINT UPDATE >READ THE CHPTIANBuddy'S dear friend 👋
SMC Trading Signals Update 🗾🗺️ Gold Traders SMC-Trading Point update you on New technical analysis setup for Gold 🪙 Gold Traders list time post signals Hit sucksfully My target point ) Now Gold making choch FVG level) FVG level 2897 + 2906 down 👇 👎 trend 📉 point below 👇 ⬇️ target point 2868- 2859 first. Hit sucksfully FVG level that take entry ☺️ 🥂 good luck 🤞
Key Resistance level 2897 + 2906
Key Support level 2868- 2859
Mr SMC Trading point
Pales support boost 🚀 analysis follow)

Naturalgas Uptrend Movement Expected upto 4.0Symbol Naturalgas
Timeframe 4 Hrs
A
Analysis : Breakout from the W Pattern.. Target expected is T1 = 3.7, T2= 4.0, T3= 4.6
We hope our analysis is adding value to your trading journey.
Please note: Published ideas are for educational purposes only. Trade at your own risk.
Also, please respect the risk - stop loss (SL) should not be more than 2% of the capital.
DISCLAIMER: We are not SEBI registered. All the videos uploaded in this channel are solely for educational purposes."

XAU#22: Gold SW for 3 Days! What's Next?🔥 OANDA:XAUUSD has been SW for the past 3 days of the weekend. Today we will look at the next scenario for FOREXCOM:XAUUSD to look for trading opportunities: 🔥
1️⃣ **Fundamental analysis:**
📊Trump's erratic tariff policy increases uncertainty, boosting demand for safe havens.
🔹USD falls sharply to a 4-month low, making gold more attractive to international investors.
🚀India steps up investment in gold, with jewelers and retail investors using gold options for speculation and hedging.
📌Gold remains a safe haven asset, especially amid concerns about India's economic growth and global instability.
2️⃣ **Technical analysis:**
🔹 **D frame**: 3 consecutive SW days, however, it can be seen that the upward trend of gold has not changed. The SW price zone is also quite high compared to the most recent bottom, indicating an upward prospect for gold
🔹 **H4 frame**: The temporary bullish price structure was broken and there was a strong reaction at the most recent peak area with a previous pinbar.
🔹 **H1 frame**: In the H1 frame, we can see the hesitation more clearly. Although the previous price continuously set higher bottoms, the upward momentum is weakening. If the price breaks through 2905. There is a high possibility that we will see a correction to the lower support zone
3️⃣ **Trading plan:*
⛔The current area is no longer safe to establish a BUY position. We will wait for a clearer opportunity in the lower support zone
✅ The current priority is to look for a SELL position. The expected scenario is that if the price breaks through 2905, we can completely establish a position.
💪 **Wishing you successful trading!**

GOLD chart analysis for Friday 10 March Session 15M TFI've looked the gold chart in every timeframe and figured out some level's and zone to rely on it for this session last closing was at 2909 due to which we've got our nearest support zone of 2907 - 2902 and after that a level of 2996 is the support below it no support for the day range until 2880 and if we talk about resistance zone's and level's 2916 - 2919 is the resistance zone and after that 2927 - 2930 is the next resistance zone after it next level is ATH of resistance , we've to look for reversal and continuation pattern's at the zone's and level's before entering in any trade because in daily TF the formation of Doji candle occur's ,so watchout the pattern's carefully before entering and SL is above or below the zone's according to the trade.
in.tradingview.com

GOLD TRADING POINT UPDATE > READ THE CHAPTIANBuddy'S dear friend 👋
SMC Trading Signals Update 🗾🗺️ Gold Traders SMC-Trading Point update you on New technical analysis setup for Gold 🪙 Gold Traders Gold 3 time frame 🖼️ looking FVG rejected point below 👇 2929+ 29209. Technical patterns). Weekly basis setup. )
Key Resistance level 2929 + 2957
Key Support level 2891 - 2848
2832
Mr SMC Trading point
Pales support boost 🚀 analysis follow)

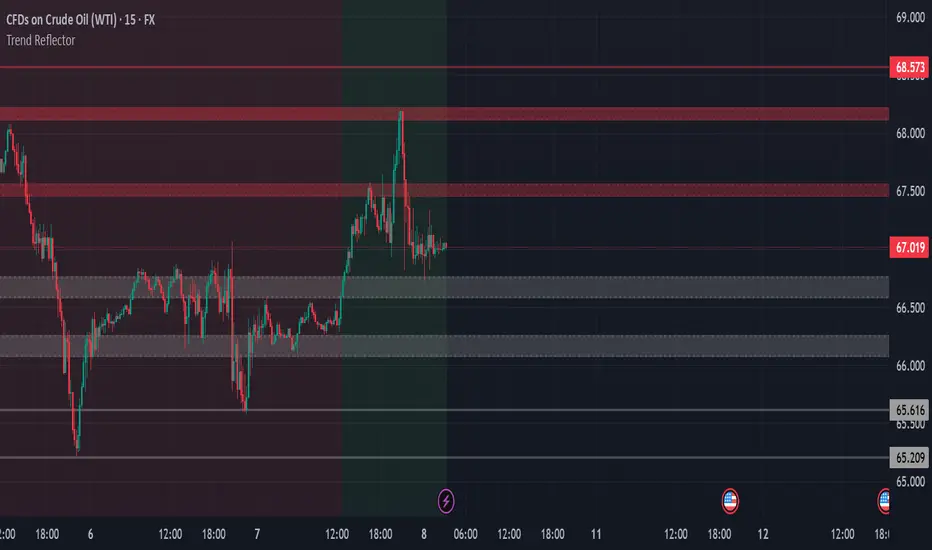
USOIL Trade IDEA for upcoming session of Monday 15M TFOn looking at the chart of USOIL in higher TF's i've figured out some imp and key levels and zones to focus on last session it closed at 67.019 and if we look on price movement then our next resistance zone is 67.465 - 67.560 after that we get the next zone which is 68.100 - 68.215 which is the last session approx high and after this we can get new resistance zone of 68.550 - 68.600 if we talk about support then nearest support is 66.757 - 66.589 and after that we can get new support at 68.250 - 68.085 then next support is 65.616 , while looking at the chart in every TF's i think crude may head for higher price for some session's because it get rejection on weekly and daily TF and it also showed bullish scenario in my self made indicator , i've given all the imp level's wait for resistance breakout and place SL below resistance low ( alternative and safe method is to wait for retesting then enter) if price goes downward's then wait for reversal pattern's then enter and place SL below support low , wait for price to show some reversal or continuation pattern before entering.
in.tradingview.com
XAUUSD 4H Analysis: Rejection at Resistance – Drop to $2,850?📉 XAUUSD (Gold) 4H Analysis – March 5, 2025
Key Levels:
Resistance: Around $2,920 - $2,940 (price is testing this zone)
Support: Around $2,850 - $2,860 (marked as a demand zone)
Market Structure & Projection:
Gold is currently at a resistance level, which has previously acted as a strong supply zone.
The price is showing signs of rejection at resistance, indicating a potential bearish move.
The chart suggests a drop towards the $2,850 support level if price fails to break above resistance.
Indicators & Confluence:
200 EMA (Red Line): Located below the price, showing an overall bullish trend, but short-term correction is possible.
Bearish Structure: The recent push to resistance followed by rejection hints at a potential sell-off.
Liquidity Grab? If price briefly spikes above resistance and then reverses, a deeper drop could be confirmed.
Trading Bias & Strategy:
📉 Bearish Scenario: If rejection at resistance holds, price could head towards $2,850 support.
📈 Bullish Breakout?: If price breaks & closes above resistance with strong volume, upside continuation could be possible.
⚠ Watch for price action at resistance before taking trades. A breakout or rejection confirmation is key.
🔥 What’s Your Take? Bullish or Bearish? Let me know! 🚀📊

XAU/USD Weekly Outlook: Potential Pullback or Breakout?XAU/USD Weekly Chart Analysis 🏆📉📈
1️⃣ Current Price: $2,919.35
2️⃣ Key Observations:
Distribution on H4: Potential sign of a short-term reversal. 📉
Divergence: Suggests weakening momentum at the highs, increasing the probability of a pullback. ⚠️
Multiple Unfilled Mitigation Blocks (MB): Areas of interest where price may retrace for liquidity grabs. 🧐
Fair Volume Ranges: Notable levels around $2,700 - $2,500, where price might stabilize if a correction occurs. 🔄 3️⃣ Potential Scenarios:
If price breaks down from the H4 distribution, expect a retracement toward the nearest MB unfilled levels (~$2,700).
If bulls hold momentum, breaking above current resistance (~$3,000) could push prices into price discovery. 🚀
💡 Conclusion: Watch for price action around the unfilled MBs and fair volume ranges. A correction seems likely unless buyers step in aggressively.
🔥 Trade Wisely & Manage Risk! 🔥

GOLD AWAITS NONFARM – BREAKOUT OR RETRACEMENT?GOLD AWAITS NONFARM DATA ON 07/03 – WILL IT HIT A NEW ATH OR CONTINUE ITS RETRACEMENT?
📌 Market Overview
The global financial markets are on high alert as all eyes turn to the Nonfarm Payrolls (NFP) report – the most anticipated economic data of the month.
🔥 Geopolitical Tensions & Their Impact on Gold & USD (DXY):
US tariff policies against neighboring countries and China continue to fuel uncertainty.
DXY remains highly volatile, directly influencing Gold’s price movements.
Investors worldwide are waiting for NFP results to determine whether Gold will break to new all-time highs (ATH) or undergo another correction.
⚡ Expected Price Volatility:
Currently, Gold is trading sideways within a broad range of 2929 - 2892, holding this structure since the start of the week. Based on previous Nonfarm releases, Gold is expected to move 45 - 50 points today, possibly even 60 points! This presents high-profit potential for traders ready to react to a breakout.
📊 Key Support & Resistance Levels – Watch for the Breakout!
🔺 Key Resistance: 2920 - 2928 - 2943 - 2954
🔻 Key Support: 2892 - 2884 - 2872 - 2859 - 2838
🚀 Today's Game Plan:
Gold is still consolidating sideways, with no clear breakout yet.
Wait for a breakout confirmation, then follow the momentum.
I will update fresh insights right before the Nonfarm release for a more precise strategy.
🎯 Trading Strategy for the Day
🟢 BUY ZONE: 2874 - 2872
❌ SL: 2868
🎯 TP: 2878 - 2882 - 2886 - 2890 - 2895 - 2900
🔴 SELL ZONE: 2952 - 2954
❌ SL: 2958
🎯 TP: 2948 - 2944 - 2940 - 2935 - 2930
📌 Important Reminders
💥 Nonfarm will trigger extreme volatility today – expect strong liquidity grabs!
✔ Stick to TP/SL to protect your capital against unexpected market swings.
✔ Wait for the breakout confirmation before entering trades – avoid FOMO!
✔ Control emotions & manage risk carefully – today’s market could be a game-changer!
📢 Are you ready for today’s market action? Stay updated and execute your trades with precision! 🚀🔥

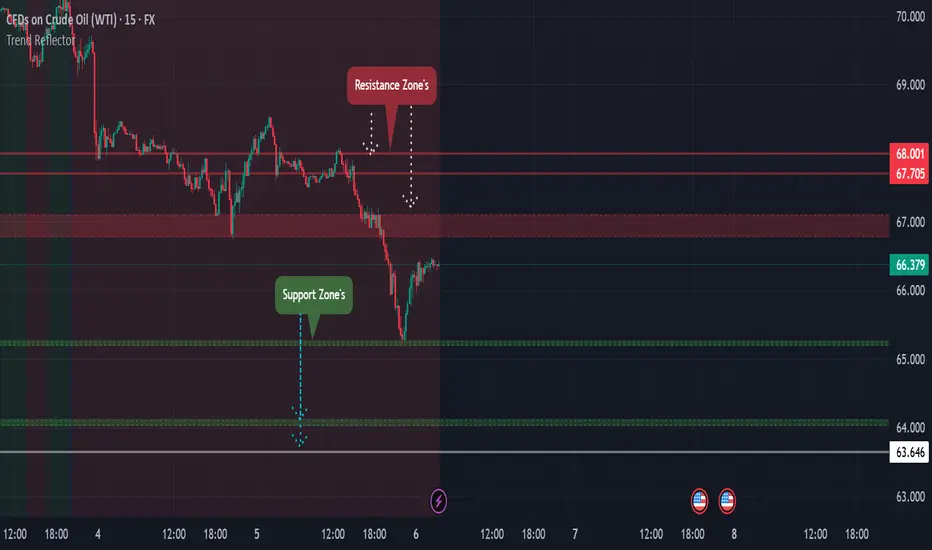
USOIL chart pattern for upcoming session of Thursday 15M TFIn the last session USOIL closed at 66.379 (2.4%) down and made of low of 65.208 , i've looked the chart on every TF and i've figured out some important levels of the crude ,on looking at the closing and price action formed our Near and major resistance zone is 66.795 - 67.090 this is a big zone but major zone and after that we've got the next resistance at 67.705 and the next one is 68.000 -68.105 , while looking at the chart in higher TF now market is going to compress or outburst for alternative scenario we've got some support zone's 65.259 - 65.200 is the level of support zone and it's also almost the low level of last session after that next support we've got on looking at every TF is 64.040 - 64.140 and after that 63.646 is the level which hold's some support , these are the level's which i got while studying the chart until new one is formed so we've to very clear here watch out every zone and level and look how price react's to it i've already told you how to trade in rejection and continuation pattern in our previous idea's ( and yeah sorry for typing mistake of level's and zone's in last USOIL idea published ) and i request every follower to avoid trading in news time ,now let's see how market react's on these levels.
COPPERHello & welcome to this analysis
Copper (MCX) is making a bullish Harmonic Seahorse breakout. A weekly close above 885 would activate it for a potential upside probable target of 1000. Post breakout if it slips below 700 the pattern will have become invalid.
Good risk reward set up currently for accumulation.
Stocks which could gain from increase in copper prices - Hind Copper, Hindalco & Vedanta.
Sectors which could get hammered from increase in copper prices since its a part of their raw material for manufacturing - White goods consumer durables manufactures, Electric cables and wire manufactures & Automobile manufacturers.
All the best

Gold is trading sideways, with a trading range of 2890~2930Gold has maintained a volatile pattern in the past two days, and the long-short game is also quite fierce. The current rise and fall of gold have not continued. It did not continue after piercing 2928 on Wednesday, and it did not continue after piercing 2894 on Thursday. The hourly and four-hour cycles are very obvious, both are horizontal structures, and the price fluctuates repeatedly and goes through a roller coaster situation!
In this case, you cannot blindly follow the trend, it is easy to lose money on both ends, and this trend will be maintained before NFP. The choice of direction depends on the impact of Friday's NFP data. For the daily cycle, the moving average of last week's sharp drop was a dead cross downward, but after the strong rebound this week, it is currently in a horizontal flat state. There is no clear direction after the sharp drop and rise, and it is more based on the shock for the time being!
Today, the US market will release NFP data at the opening, and the market estimate gives a small negative impact on gold and silver. It is Friday again, especially for short-term trading, be careful of the Black Friday market! The shock range is 2890-2930. Note that the market will move out of the direction after the breakthrough.
Gold fell rapidly in the Asian session today, but it still failed to continue today. It still fluctuated during the session. Although the low point has been extended, it seems to be fluctuating and weakening on the market, but in fact it is the market washing. The repeated fluctuations of the bullish trend at high levels are actually a manifestation of seeking breakthroughs! If you want to layout in the later stage, you should first consider buying at a low point when it falls back!
At present, the market high point pressure is very clear. The 2930 line is still an insurmountable pressure in the short term, and the most controversial is the support below, because it is in a state of continuous downward exploration, but from the recent trend, each low point refresh is only a few US dollars of space downward. Gold will not continue in the near future. Obviously, the support level is the low point of the previous wave as a reference! In the case of the general direction is still bullish, only waiting for a fall to buy is to follow the mainstream of the market!
Gold is still fluctuating in a large range in 1 hour. The bulls do not have a completely strong market. The bulls and bears are repeatedly tug-of-war. At present, gold should be careful of the bulls' risk aversion sentiment to ease and start a large adjustment. In the later stage, focus on the support level of 2890 to layout long positions, and focus on the pressure level of 2930 above!
Key points:
First support: 2900, second support: 2892, third support: 2878
First resistance: 2918, second resistance: 2928, third resistance: 2936
Operation ideas:
Buy: 2888-2891, stop: 2880, target 2910-2920;
Sell: 2925-2928, stop: 2936, target 2910-2800;

Gold Technical Outlook: Prepare for Dip Before the RipThe recent price action shows gold has rejected the R1 resistance level at 2,932.06 and appears to be forming a local top.
A correction appears likely, with potential downside targets at:
First support at P (2,882.39)
If broken, a deeper correction to S1 (2,808.47) or low is possible.
After this corrective phase completes, I anticipate a strong bullish resumption. The overall structure remains positive with:
Solid support at the Previous Weekly Low
Longer-term uptrend still intact (visible from early February pattern)
The Current Year Mid level providing fundamental support
Once the correction finds its bottom (likely near S1, we have to wait for confirmation), I expect a renewed push targeting previous highs and potentially establishing new ones above 2960

Gold Faces Strong Resistance – Is a Drop Coming?Hello everyone , i hope you all will be doing good in your life and your trading as well. Let's discuss about Gold (XAU/USD) which is facing strong resistance at the upper boundary of a descending channel on the 1H timeframe, indicating a potential bearish move ahead. After multiple attempts to break above, the price has been rejected, signaling that sellers are stepping in at higher levels. If the price sustains below 2,905, we could see further downside towards 2,880, followed by 2,840, and eventually 2,813. The stop loss for this trade setup is placed at 2,935, above the recent resistance. Volume analysis also confirms selling pressure, adding conviction to the bearish outlook. If the price fails to hold support, this could lead to a deeper correction within the channel. Stay cautious and manage risk accordingly!
Disclaimer: This analysis is for educational purposes only. Please consult a financial advisor before making investment decisions.
If you Found this helpful? Don’t forget to like, share, and drop your thoughts in the comments below.

GOLD chart pattern for upcoming session of Thursday 15M TFi've looked chart in every TF and figured out some level's for the thursday session's , gold closed at 2928 in the last sessioon and nearest resistance is 2930 -2934 and above it the resistance is 2952 - 2953 which is the ATH and nearest support (first) is 2913 - 2910 and below it the next support (second) is 2896 - 2893 and below it the third support zone of 2871 - 2864 , looking at the closing i think between first support and resistance is no trade zone , if price form some reversal and continuation pattern then we've to enter only and should place our place above or below the zone's respective to our trade position ( short or long ) , look for patterns at the zone's , let's see how market react's to these pattern .

GOLD short-term analysis today, trading range 2900~2940Yesterday, gold prices rose first and then fell under the poor US ADP data. After falling below the 2900 mark and reaching a low of 2894, it stopped falling and quickly rose. It reached a high of 2929 and then fell back to around 2915, with long and short positions sweeping back and forth. It is worth noting that the sharp decline of the US dollar index and the sharp rise of silver did not cause further rise in gold. The gold price seems to be following its own independent trend. Today, the support below is in the range of 2900-2905, and the pressure above is around 2940!
From the current market, the daily line rose for 2 consecutive times this week, with an overall increase of more than 60 US dollars, which is enough to reflect the strength of the bulls. In addition to the rise of yesterday's market, the current price is running above the Bollinger upper rail, and the short-term moving average extends upward strongly, forming support at 2895 and 2880 respectively. The daily line should tend to continue the upward trend.
Gold continues to fluctuate widely, and we continue to maintain the idea of oscillation trading unchanged. The main idea is to participate in the layout with the idea of oscillation, participate in the short-term of callback low and long, and pay attention to the long-term selling opportunities near the previous high. Focus on the 2900/2940 range during the day.
From the daily chart, the medium-term trend of the daily chart remains unchanged, and the price is running in the rising channel, but the lower line is too far away from the current price, which is not very meaningful. Yesterday, there was a false break of 2900, and there was another rebound in the late trading. Whether the market can break through the resistance of this short-term trend remains to be seen. After the intraday shock, gold fell back in the US market, and the current lowest is 2894!
After the continuous rise on Monday and Tuesday, the short-term increase was too large, and an adjustment process was needed. The price was also under pressure near the previous opening of 2930, especially in the 4-hour cycle. It is obvious that after the continuous shock, the bulls began to fail, and the retreat is more conducive to the later rise!
From the four-hour chart, gold broke the upward trend line before, and the short-term indicators are overbought, but the overall upward pattern has not changed. Yesterday, the K-line rebounded strongly relying on the support of ma5, the Bollinger Bands opened upward, and the MACD golden cross diverged upward. Gold is currently in a bullish trend. Short-term bullish thinking continues. Pay attention to the support break of the 10-day moving average 2900-2895 below. If this position is not broken, the bullish trend will remain unchanged. If it breaks, it will look to 2880!
However, it is worth noting that yesterday's market did not continue to rush up after hitting the 5-day moving average support, but consolidated at a high level, and the MACD red column continued to decrease, suggesting that the pressure from above is gradually increasing. Therefore, today's short-term operation is bullish but not high-level chasing. Pay attention to the short-term bulls rushing high and then diving down due to insufficient momentum. On the whole, today's short-term operation of gold is recommended to buy on pullbacks as the main strategy, and sell on rebounds as a supplement!
Key points:
First support: 2910, second support: 2902, third support: 2890
First resistance: 2930, second resistance: 2936, third resistance: 2948
Operation ideas:
BUY: 2902-2905, SL: 2894, TP: 2920-2930;
SELL: 2937-2940, SL: 2949, TP: 2920-2930;

GOLD SURGES STRONGLY – IS THE SELL SIDE TAKING CONTROL? Yesterday, Gold surged nearly 50 points, climbing from 288x to 2927.x, hitting the key resistance zone that I had previously noted. Immediately after, Gold made a sharp correction, signaling that the Sell side is regaining control in today’s session.
📌 Looking at the D1 timeframe, Gold still shows strong bullish momentum but has reached a critical continuation zone (IP – Important Price), where it has been reacting since yesterday. Today, we anticipate a potential reversal with strong selling pressure, making early SELL entries a solid strategy.
🚨 Key resistance to watch: 2933 – If the price breaks above this level, the BUY side will regain strength, and the SELL plan will be canceled. I will update a new strategy accordingly.
⏳ Trading strategy for today:
🔹 Focus on SELL opportunities in the Asian & European sessions.
🔹 Wait for confirmation in the U.S. session before adjusting the approach.
⚡️ KEY PRICE LEVELS TODAY
📌 Resistance: 2916 - 2927 - 2933 - 2945 - 2954
📌 Support: 2890 - 2886 - 2880 - 2875 - 2860
💎 TRADE SETUPS FOR TODAY
🔹 BUY ZONE: 2876 - 2874
SL: 2870
TP: 2880 - 2884 - 2888 - 2894 - 2900
🔹SELL SCALP: 2926 - 2928
SL: 2932
TP: 2922 - 2918 - 2914 - 2910 - 2900
🔹SELL ZONE: 2945 - 2947
SL: 2950
TP: 2940 - 2936 - 2932 - 2928 - 2920
🚨 IMPORTANT NOTICE
📊 Today's focus will be on the ADP NONFARM report – This key data will provide insights into the U.S. economy ahead of Friday's Nonfarm Payrolls (NFP).
📢 Traders should be extra cautious and strictly adhere to TP/SL rules to protect their accounts from potential volatility.
💰 Wishing everyone a profitable trading session – GOOD LUCK! 🚀🔥

GOLD MAINTAINS UPSIDE MOMENTUM AFTER ADP NONFARM DATA RELEASE🔺 Market Overview:
Gold continues to maintain its bullish momentum, having reclaimed key resistance levels after the ADP Nonfarm report was released yesterday. Despite recent U.S. economic data and the uncertainty surrounding tariff policies, the USD has weakened following a brief recovery over the weekend.
🔺 Current Outlook for Gold:
Given the economic news and the candle strength on the chart, I’m still looking for BUY opportunities in Gold. During the Asian and European sessions, we can anticipate BUY setups early, as Gold could reach the key resistance zones, offering good SELL scalping opportunities just like we saw yesterday at the 2928 - 2926 zone, which resulted in a 150-pip profit.
📊 Market Range Today:
The price range today may be sideways as we await important Nonfarm data tomorrow. Pay close attention to the support and resistance levels.
🔸 KEY SUPPORT & RESISTANCE LEVELS
🔺 Resistance Levels:
2928 – 2942 – 2954
🔻 Support Levels:
2904 – 2894 – 2886 – 2874
⌛ TRADING ZONE FOR TODAY
🟢 BUY ZONE:
Entry: 2886 - 2884
Stop Loss (SL): 2880
Take Profit (TP): 2890 - 2894 - 2898 - 2905
🔴 SELL SCALP:
Entry: 2942 - 2944
Stop Loss (SL): 2948
Take Profit (TP): 2938 - 2934 - 2930 - 2925 - 2920
🔴 SELL ZONE:
Entry: 2954 - 2956
Stop Loss (SL): 2960
Take Profit (TP): 2950 - 2946 - 2942 - 2938 - 2934 - 2930
📌 Final Thoughts & Trading Tips:
Key Levels: The key levels have been noted above. Pay attention to the critical support and resistance zones.
Stay Focused: Today, the market is likely to be in a sideways range, so be patient and wait for confirmation before executing trades.
Nonfarm Data: Keep an eye on important Nonfarm data tomorrow. This could trigger significant price movements.
💡 Reminder: Always follow your TP/SL levels to ensure safe trading and protect your capital. Trade with caution and stay disciplined!

GOLD chart analysis for Wednesday session 15M TFOn looking at price movement and candlestick pattern on every TF i've figured out some zone's for wednesday session , according to closing price of gold it first resistance zone is 2927-2932 and next major resistance is 2952-2956 and if we talk about support then we've got the nearest support as 2909-2904 and follwing to it next support is 2895-2890 and 3rd support is 2883-2878 , price should come to second support sone and it should work as pullback zone from there price should make a upside move first support can also work as pullback zone but i think it's not strong as 2nd one , we should follow clear and simple approach watch out every zone look for price raction at zone if price make reversal signs at support then go for upside trade and place SL below support if it break's support with continuation pattern then short for next support in case of resistance short if reversal occurs buy if continuation occurs after continuation buy it in retesting for better risk management place sl below resistance.

GOLD UPDATE Our Spot #Gold Range Prediction from 06/03/2025 to 07/03/2025 is as under.
Gold Spot :2890$-2930$
Gold INR : 85000-86450
Our Spot #Silver Range prediction from 06/03/2025 to 07/03/2025 is as under.
Silver Spot: 31.88$-32.44$
Silver INR: 93500-98100
It must be remembered that price of precious metal depends on so many world wide factors like inflation, Fed interest rate, trade barrier, geopolitical tension, demand, supply, bond yield, dollar index , GDP, payroll data, CPI, currency fluctuation, debt ceiling , expected tax & duty changes, other commodity price crude oil etc. etc. and hence there can not be any accurate barometer of predicting precious metal price.
Gold INR has been calculated taking Gold Spot international price and converting the same assuming fixed Indian rupee rate. However, this is not accurate method as change in rupee value to dollar can substantially impact Gold INR price. Pl. note that price of commodity doesn't depend upon performence of company but depend upon performence of world economy, hence it is extremely risky to trade in commodities. Commodities market also become more volatile during contract expiry.
These are not a recommendation for buy or sell. This view is only for educational purpose. You are requested to consult your financial advisor before entering in to any trade.

USOIL or CRUDEOIL Downtrend Movement upto 49SYMBOL USOIL or CRUDEOIL
Timeframe Day chart
Analysis: Breakout from the triangle pattern and we can expect a downtrend movement upto 49
We hope our analysis is adding value to your trading journey.
Please note: Published ideas are for educational purposes only. Trade at your own risk.
Also, please respect the risk - stop loss (SL) should not be more than 2% of the capital.
DISCLAIMER: We are not SEBI registered. All the videos uploaded in this channel are solely for educational purposes."

Gold: Buyers pause above $2,900 amid risk aversion concernsGold is maintaining its bullish momentum for the second consecutive day above $2,900 on Wednesday morning, as buyers take a breather ahead of the crucial ADP employment report in the US. This data could provide fresh insights into the Federal Reserve’s next interest rate move. Meanwhile, risk aversion sentiment fueled by concerns over a trade war may help limit gold’s downside potential.
At the same time, XAU/USD has held above the $2,900 level but retreated slightly from the intraday high of $2,927.91. The daily chart shows that gold has been on an upward trajectory for the second consecutive session, though another strong rally remains uncertain. In the short term, gold appears to be correcting overbought conditions.
Key Levels to Watch
Support levels: $2,894, $2,876
Resistance levels: $2,927, $2,941, $2,956
