Gold : Another if this and then that scenario The current price is near the Daily Open and below the Previous Week High , suggesting a potential rejection zone where supply might dominate.
The recent pullback (as shown by the red arrow) indicates that smart money may be ready for another liquidity grab or correction to test lower demand zones. A bearish reversal from the current level could form, Price is likely to target the Previous Week Low.
After testing lower area as per red arrow, I expect a bounce back up, so I’d watch for a bullish candle—like a hammer or engulfing pattern in lower side and price can recover as per the green arrow (We have to wait for low confirmation )
Commodities

XAU#21: Gold is soaring. Will it break the top and trading plan💎 💎 💎 The "bulls" are back as analyzed in the previous article. The price OANDA:XAUUSD has passed the trendline and there is no sign of stopping. Let's plan the next trading FOREXCOM:XAUUSD : 💎 💎 💎
1️⃣ **Fundamental analysis:**
📊Warning of short-term inflation shock: The market is pricing in the US CPI to remain around 3% for the next 7 months, reflecting a sudden increase in inflation. The 25% tax on imports from Canada and Mexico could increase consumer costs, putting pressure on inflation.
🚀Unstable context: US tariffs, war in Ukraine, inflationary pressure ... are causing concerns about an economic recession. This has pushed the gold price up again in the past 2 days.
2️⃣ **Technical analysis:**
🔹 **D frame**: The bullish price structure is still continuing, however, in my personal opinion, this increase is not sustainable.
🔹 **H4 frame**: The key down zone was broken last week and the price has returned to the resistance zone. The price reaction in this area is currently not positive. The bulls are still dominating as the previous H4 was a long-bodied candle.
🔹 **H1 frame**: The current price structure is bullish and there are no signs of a reversal.
3️⃣ **Trading plan:*
⛔ Although the price is in the resistance zone, the price reaction is weak enough to set up a SELL order. Currently, the fundamental information and short-term price structure are supporting the bulls. However, it should be noted that if the price increases continuously without recovering and breaks the peak once again, we will likely have a correction phase.
✅ BUY positions in the lower area can completely wait for better profits. In addition, when the price finds the support zones below, we can completely wait for the opportunity to establish the next position when the price structure appears in the smaller time frame. Note that
💪 **Wishing you success in achieving profits!**

GOLD TRADING POINT UPDATE >READ THE CHAPTIAN Buddy'S dear friend 👋
SMC Trading Signals Update 🗾🗺️ Gold Traders SMC-Trading Point update you on New technical analysis setup for Gold traders SMC trading point ☝️ list time post signals 🚀 Hit sucksfully My target point 2920 ) Now Gold rejected point below 👇 supply zone 2892- 2875 FVG level up trand My target 🎯 point 2961 long Trade 🤝. First take short trend 📈 And buying it)
Key Resistance level 2915 + 2920 + 2956+ 2961
Key Support level 2892 - 2875
Mr SMC Trading point
Pales support boost 🚀 analysis follow)

WILL THE BULLISH MOMENTUM CONTINUE TODAY?GOLD REVERSING FROM A STRONG DROP – WILL THE BULLISH MOMENTUM CONTINUE TODAY?
Gold experienced a highly volatile session, retracing to fill the GAP and provide liquidity for the lost price data area before rebounding in line with its primary trend. After a sharp drop, BUY momentum gradually returned, closing the daily candle with strong bullish pressure.
Although the ISM Manufacturing PMI data came out positive, it had little impact on the price as market sentiment is currently focused on the new US tariff policies, which could add further pressure on safe-haven assets.
So, will Gold continue its upward momentum today, or is this just a technical correction before further downside? 📉📈 Let's track the key price levels for a well-planned strategy! 🚀
⚡️ KEY PRICE LEVELS TODAY
📌 Resistance: 2892 - 2906 - 2916 - 2930
📌 Support: 2880 - 2872 - 2858 - 2845 - 2835
💎 TRADE SETUP
🔹 BUY ZONE: 2846 - 2844
🎯 TP: 2850 - 2854 - 2858 - 2864 - 2870
⛔️ SL: 2840
🔹 SELL ZONE: 2915 - 2917
🎯 TP: 2910 - 2905 - 2900 - 2896 - 2892
⛔️ SL: 2921
⏳ With no major news releases today, the expected price range is 30 - 35 prices. Stick to TP/SL to protect your account! 🚀💰

USOIL Trade IDEA for upcoming session of Monday While looking at the candlestick pattern's and price movement of USOIL looks like there is no change in Support and Resistance zone's as shown in my last session idea but i'll mention levels again and also show them in chart 70.106 - 70.634 is no trade zone but a zone displayed by orange color 70.500-70.600 is resistance zone this zone is the good resistance zone price fall from this zone in the previous session and surprisingly for the upcoming session of monday it formed tweezer top ( Equal High ) in 15min TF highlighted by circle in chart so price should fall from this level and SL should be above Orange zone and we will follow the target levels as shown in chart as support levels alternative scenario is if our SL is triggered then we will wait for the price to go above 70.634 and closely watch it's price movement if it sustain above it then we will go for upside trade and target should be 71.676-71.976 zone highlighted in the chart .

GOLD chart analysis for Monday session 15M TFGold (XAUUSD) price closed at 2857 level in the last session after studying it in all time frame we've figured out some level's of it 2863 - 2868 is the nearest resistance zone and after that next resistance zone is 2877 - 2882 and 2853 is the nearest support level and after that next support is 2832.59 we will go simple here this time look for reversal or continuos pattern on the zones and level's and make trade placement according to them i'll follow my signal generation and trend direction indicator to place my trade , and here i've told you the levels which should work very well , be focused on candlestick pattern to get the best trade's.

XAUUSD/GOLD WEEKLY PROJECTION 03.03.25A primary reason for gold price falls is a strong US dollar, as gold has an inverse relationship with the dollar, meaning when the dollar strengthens, gold prices tend to decrease; other factors include rising interest rates, which can make alternative investments more attractive to investors, leading to decreased demand for gold, and a stable economic environment that reduces the need for gold as a safe haven asset

GOLD FACES KEY RESISTANCE AFTER LAST WEEK'S STRONG DROP🔥 After reaching ATH early last week, Gold saw a significant correction, dropping to 283x before bouncing back from the strong support zone at 2833 - 2835. By the end of the week, Gold retested this level, surging 20 points and closing the weekly and monthly candle at 2857 – a solid position for the BUY side.
🟢 TODAY’S SESSION – GAP OPEN & CURRENT VIEW
At the Sydney & Tokyo open, Gold continued to benefit from last week’s BUY momentum, creating a 15-point GAP and reaching 2870. So far in the Asian session, it has peaked at 2877.
👉 CURRENT VIEW: Gold is likely to drop back to fill the GAP (low liquidity) around 2854 - 2850 before continuing its upward movement. The price is currently reacting in line with this expectation.
⚡️ KEY LEVELS TO WATCH TODAY
📌 Resistance: 2884 - 2895 - 2900 - 2905
📌 Support: 2856 - 2850 - 2845 - 2835
💎 TRADE SETUPS FOR TODAY
🔹 BUY ZONE: 2835 - 2833
🎯 TP: 2840 - 2844 - 2848 - 2854 - 2860
⛔️ SL: 2830
🔹 SELL ZONE: 2904 - 2906
🎯 TP: 2900 - 2896 - 2892 - 2886 - 2880
⛔️ SL: 2910
📢 IMPORTANT NOTES
📆 Today marks the start of a new week and month, so it's crucial to closely monitor price reactions. Key economic reports like ADP and NFP are scheduled this week, so risk management is essential. Stick to TP/SL levels to protect your account!

Gold Technical Roadmap: From Correction to RecoveryCurrent Price Action
The price has formed a clear downtrend over the recent sessions, breaking below a previous uptrend line (marked in green)
There's notable selling pressure as price has dropped from recent peaks and is showing a bearish momentum(In line with my last post on gold).
Short-Term Outlook (Within Current week):
I am expecting potential bottoming formation may be developing. The recent sell-off appears to be approaching key support levels, with S1 at 2,808.47or S2 at 2758 likely to provide initial support. Watch second curved arrows on the chart an expected bounce from this region.
We have to Consider that oversold conditions might develop soon if the downtrend continues and then we have to watch for bullish reversal patterns near support levels as mentioned above.
Mid-Term Outlook (2-6 weeks)
Initial drop (Ongoing )
Potential bounce to Pivot (2882-2,900) resistance
Possible second test of support (S1 or S2)
After Low ,If successful, a stronger move toward previous week highs (2,960) and potentially R2 (3000)
Overall View is still bullish and we have to wait for confirmation from low to add in current running buy trades as mentioned in previous analysis.

GOLD TRADING POINT UPDATE > READ THE CHAPTIAN Buddy'S dear friend 👋
SMC Trading Signals Update 🗾🗺️ Gold Traders SMC-Trading Point update you on New technical analysis setup for Gold 🪙 Gold Traders Gold weekly Time Frame 🖼️ looking a good time for. Short Trade 😁. Also Goldman Sachs talk and 2025 if gold tast 3000$. Not for now weekly candle 🕯️ close below 👇 ⬇️ 2800 Next target 2538.
Key Resistance level 2900 + 2956
Support level 2800 - 2782 - 2706 - 2538
Mr SMC Trading point
Pales support boost 🚀 analysis follow)

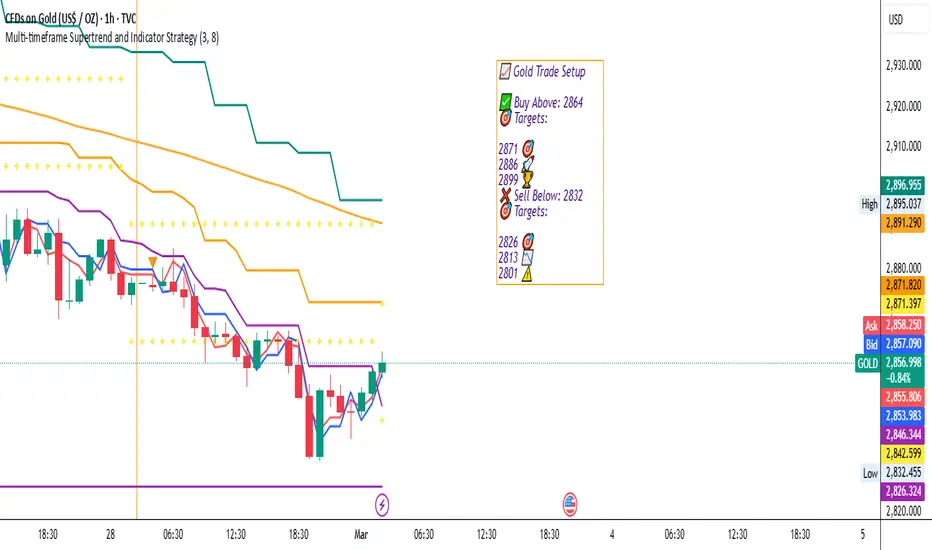
Gold Trading Strategy for 03rd March 2025📈 Gold Trade Setup 📉
💰 Entry Strategy:
🔼 Buy Above: The high of the 1-hour candle that closes above 2864
🎯 Targets: 2871 | 2886 | 2899
🔽 Sell Below: The low of the 15-minute candle that closes below 2832
🎯 Targets: 2826 | 2813 | 2801
📊 Trade Explanation:
Why wait for a close?
A 1-hour candle closing above 2864 confirms bullish strength, reducing false breakouts.
A 15-minute candle closing below 2832 helps identify early bearish momentum.
This method improves accuracy by ensuring price sustains its breakout direction rather than just wicking above or below levels.
Combine with indicators like RSI, MACD, or Moving Averages for added confirmation.
⚠️ Disclaimer:
This trade setup is for educational purposes only and should not be considered financial advice. Trading involves risk, and you should do your own research or consult a financial advisor before making any investment decisions. 🚀📉
XAU#20:Gold plunges sharply,but will the“Bull Market"end easily?
💎 💎 In the previous article, the clear divergence in the H1 frame was confirmed by a correction of Gold. Now we will come up with the next plan: 💎 💎 💎
1️⃣ **Fundamental analysis:**
📊The main reasons for the decline of gold: profit taking by investors, a stronger USD and unsurprising US inflation data, which has curbed expectations of the Fed cutting interest rates.
🔹The Russia-Ukraine war is nearing its end as the final agreements are being negotiated.
🚀If there is a situation of high inflation but a weak economy (stagflation), gold prices may continue to rise sharply.
📌Some experts believe that gold prices are about 15% higher than fair value, but new factors such as central bank gold purchases and strong demand from China can still push prices to continue to rise.
2️⃣ **Technical analysis:**
🔹 **D frame**: 4 consecutive days of decline of about 120 USD, but looking at the overall price structure of gold, it is still stable. This correction with the goal of retesting the support zone below
🔹 **H4 frame**: The price structure has been broken. However, to get down to the support zone below, if there is no unexpected news, we still need a recovery to gain momentum. The pinbar at the end of the 6th session and the subsequent increase are supporting this option.
🔹 **H1 frame**: The price structure is very clear. The recovery at the end of the 6th session is the profit-taking action of the sell position forming a weekly candlestick wick.
3️⃣ **Trading plan:*
⛔ Currently the price structure is still decreasing. We should not trade against the trend at this time. Especially at this time, information about reaching an agreement on the Russia-Ukraine war can appear at any time
✅ Waiting for the price to reach important resistance zones to trade in line with the trend is the top priority. This is also the profit-taking area for the case where we establish a position when the price line confirms a recovery with the price structure.
💪 **Wishing you success in achieving profits!**

USOIL Trade Idea (Zones) for Friday session 28-02-25After studying USOIL at higher TF and watching it's closing price i think 70.106 - 70.634 is No-trade zone for USOIL due to it's complexity at higher timeframe , i've also drawn a zone which can push price to downward direction which is represesnted by orange color in the chart if price sustained above this level then it can go to it's next resistance zone of 76.500 - 76.600 but here SL should be below the zone which is 70.106 and the zone itself is mutual in multiple timeframe so be cautious to trade in this zone and use manage Quantity , and for alternative scenario if price goes below 70.106 and sustained then we can see then 69.150 level because it was the last swing created and below it other levels are also mentioned in the chart , look for reversal and continuation pattern to enter in trade .

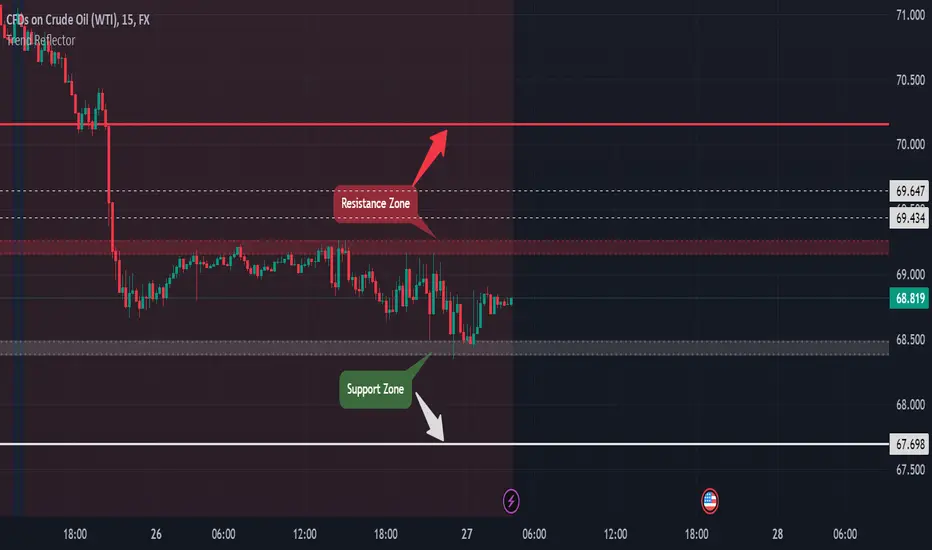
USOIL Trade IDEA for upcoming session's of Thu & FridayClosing of the last session of USOIL occurs at 68.819 and after looking at every timeframe and the price action concludes the support and resistance zone's for the upcoming session's as we look in chart next support zone 68.380 - 68.486 if price goes below this level then wait for minor retesting and short for 67.700 level which is next support this is because in higher TF picture show's downtrend ( but in lower TF retesting occurs ) for alternative scenario's if price goes upward then 69.155-69.270 is the next and strong resistance zone at this place look for reversal pattern this would be the zone from where price drop ( but 69.430-69.630 is minor reversal range shown as dotted lines in the chart which can cause reversal if price surpases the first resistance zone ) if price breaks these zones then take a buy for next resistance zone of 70.000 - 70.100 but it seems price drop of the USOIL for these session's let's see what will happen .
USOIL CHART ANALYSIS FOR 24 FEB 15M TFIn the Last session USOIL falls heavily and in daily TF it made a huge Bearish candle and gave us a daily support and resistance zone and for now for 70.112 - 70.158 is the support zone which is very near to closing of the last session price may take a pullback from this level to 70.950 - 70.170 which is the cruicial zone ( Highlighted as yellow zone in the chart ) from there price may fall again and next support is the 69.100 - 69.160 , if price break the cruicial zone then it may retrace to 71.630 - 71.800 which is the nearest resistance , i'll place my trade according to my indicator setup so look for continuation or reversal pattern to enter in trade .

XAU#19: Gold's rally slows down, what's the reason?OANDA:XAUUSD demand soars but price growth slows down, risk of correction increases. However, let's look at the fundamentals and price structure to plan for FX:XAUUSD next move:
1️⃣ **Fundamental analysis:**
📊 The decline of the USD is an important sign ahead:
🔹European politics and impact on the USD: German elections could strengthen the EUR, putting more pressure on the USD
🔹USD faces downward pressure: The factors that caused the USD to plummet in 2017 (trade policy, global growth, European politics) could recur in 2025, threatening the strength of the greenback.
🔹Trump Tariffs: Lower-than-expected tariffs have limited the USD's gains, but investors remain concerned about upcoming trade policy.
🚀India's gold imports in February are expected to fall 85% year-on-year to a 20-year low as record bullion prices dampened demand. ''
📌 We have seen the first signs of market sentiment that gold prices are already too high. However, in the game of buying and selling, increasing demand while lacking supply is always the driving force for prices to rise further.
2️⃣ **Technical Analysis:**
🔹 **Frame D**: Yesterday was a pinbar that was forecast to be a strong driver for gold's price increase. However, today's price action shows the opposite. The decline is not over yet.
🔹 **H4 Frame**: The price has been SW at the peak for too long without a breakout. Although the price structure is still increasing, the current support area is showing a weak price reaction.
🔹 **H1 Frame**: As you can see the clear divergence on the MACD indicator. It is highly likely that we will have a slight correction to the support area below
3️⃣ **Trading plan:*
⛔ In the current area, we do not have a clear confirmation, whether BUY or SELL at this time is high risk. Currently, we should not FOMO if there is no clear confirmation from the price structure.
✅ Waiting for the price structure to be broken and then looking for a position when the price rebounds is a wise choice at this time. Or we can simply wait for the price reaction when it reaches the support zones below to trade in accordance with the main trend
💪 **Wishing you success in making profits!**

Intraday to BTST trade opportunity in natural gas, it should flyHello, everyone, i have brought an intraday to postional trade in natural gas, i am expecting it should take support in this area, probability is very high that it should take supprot in this area, Today's day low can be our intraday support and the stop loss which i mention below to that is gonna to be a postional stop loss. Targets already mention on chart.
Disclaimer:- This analysis is for educational purposes only. Please trade responsibly and consult a financial advisor before making any decisions.
If you found this analysis helpful, don’t forget to like, follow, and share your thoughts in the comments below! Your support keeps me motivated to share more insights. Let’s grow and learn together—happy trading!

Gold Hot Streak: What’s Next This Week?The price has been climbing steadily, breaking through multiple levels, and it looks like it’s riding an ascending trendline on H4 (that green line sloping upward).
However, around February 11,14 and 21st, there’s a noticeable pullback or consolidation phase, with the price forming a small range before shooting up again. This suggests buyers stepped in at a key support area, pushing the price higher.
As of today, February 24, 2025, gold is looking pretty strong again, but we’re at a critical juncture. The price is sitting just above the daily open at 2940, still trading under PWH which is Immediate resistance,. Here’s what I think could play out this week:
If Bulls Stay in Control: If the price holds above 2940 and breaks R1 (2967.882), we could see a strong move toward 3000 (R2).
If Bears Step In: If the price fails to hold above 2940 and drops below the ascending trendline (around 2940 or under Weekly Pivot P, Watch Price action at Pivot P for this week ), we might see a pullback to S1 (2,891) or even deeper to S2 (2847). The recent overextension after the big move up could attract sellers looking to take profits or short the market.
I was expecting a pullback from Last week, and chances of pullback is still here and gold can re start the bull run within 6-7 Trading day (During this period a consolidation or correction chances are there) Overall gold is still bullish and as discussed in last week posts and I am still holding buy trade on both gold and silver , If Gold pullback and 2900 I will take some percentage of profit from both gold and silver.

GOLD chart analysis for Friday 21 Feb 25 Session 15M TFGold got the closing at the last trading session at 2939.59 it's near Support Zone is 2930 - 2933 price should move to this level to take support then it should go for its previous high which is 2954 and it is the target we should think about if market goes the way i told beacuse it's last day of the week and many people closes positions they're holding , another scenario is if price breaks first support and goes to major support for the day which is 2918.71-2924 level we should wait for clear confirmation without FOMO if want to enter at dip buying beacuse in case this major support breaks then it'll dump to 2900 with ease .

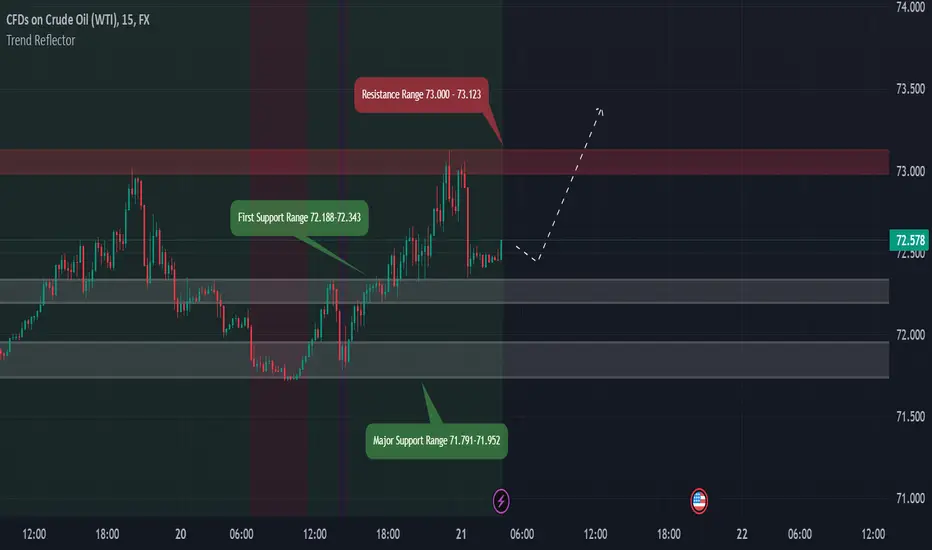
USOIL Chart analysis for Friday 21 Feb 25 Session 15M TFUSOIL last session closing was at 72.578 and made a high of 73.123 after studying it in higher TF i think if price comes downward then it's First Support Range is 72.188-72.343 if this range works as good support then we can see price upward movement from this range of support if it'll not sustain then Major Support Range is 71.791-71.952 it is good support it should sustain the price if it comes towards it in case it breaks then we can see bearish movement for the day , these support levels should work if we take a look in higher TF and our Trend Reflector also indicates bullish sentiment look for reversal price action if price comes to these levels , in case it breaks resistance zone of 73.000- 73.123 then we may get the level of 73.750 which is the next resistance , it's very clear look for bullish entry until major support breaks, it seems bullish for the day.
Gold Chart pattern for upcoming session's 15M TFIn the last session gold made a new High of 2946.97 but in higher TF such as Daily TF it forms Doji candle due to its closing at 2933 level we've to wait for the breakout or breakdown of the Doji high and low to get in trade i've clearly mentioned resistance and support zone's in the chart which can play a good role in future price movement and we also have a minor support zone of 2923-2925 which can cause a change of character and push for new high , right now due to doji formation i'll consider no trade zone till we'll get breakdown or breakout , if we get breakdown of the support then we should go for shorting and if breakout happens we should go for buying .

USOIL Chart Pattern for upcoming session's 15M TFWith accordance to 4H TF USOIL should fall to 71.500 to 71.200 with ease in this session but if we take a look to Daily TF we may see a price upper side when it touches 71.65-71.750 ,i've analysed it bit more it looks like if it goes to 71.500 then we should wait for 71.350 level to break and close below it and then short till 70.600 but in case it takes rejection at level of 71.350 - 71.500 then we can see 73.000 as our next target .

Crudeoil expected uptrend movement upto 74/75.5Symbol CRUDEOIL
Timeframe 1 hour
Analysis Uptrend Movement upto 74/75.5 expected.
Breakout from Triangle pattern, so we can expect a uptrend movement upto 74/75.5
We hope our analysis is adding value to your trading journey.
Please note: Published ideas are for educational purposes only. Trade at your own risk.
Also, please respect the risk - stop loss (SL) should not be more than 2% of the capital.
DISCLAIMER: We are not SEBI registered. All the ideas posted in this channel are solely for educational purposes."
