XAUUSD/GOLD JOLTS Job Openings News Projection 09.12.25Main Idea
Gold is currently ranging between 4,191 – 4,210 zones.
During JOLTS news volatility, price may either break upward or break downward from this zone.
Your plan is a breakout + retest entry with a 1:3 Risk–Reward Ratio.
🟢 Bullish Scenario (Buy Setup)
Conditions to Buy:
Price breaks above 4,210 zone
Retests the same zone and holds as support
Enter after bullish confirmation
Target:
4,250 zone
Stoploss:
Below 4,191 zone
🔴 Bearish Scenario (Sell Setup)
Conditions to Sell:
Price breaks below 4,191 zone
Retests the level as resistance
Enter after bearish confirmation
Target:
4,163 zone
Stoploss:
Above 4,210 zone
🎯 Risk–Reward Ratio: 1:3
Both setups aim for a low-risk and high-reward breakout trade using news momentum.
Commodities

XAUUSD – Brian | H1 Volume ProfileXAUUSD – Brian | H1 Volume Profile: risk of deep decline as market awaits PCE data
Market snapshot
On H1, gold is declining in a rather "clean" structure, continuously creating lower highs and lower lows.
The 4.175 area is currently the nearest support – if breached, the decline could extend another 50–60 points to lower areas.
Price remains below 4.250 USD, as the market awaits PCE data (Fed's preferred inflation measure) to find a clearer direction.
Technical map – Volume Profile & price areas
Important areas today: 4.210 – 4.200 – 4.175 – 4.164 – 4.133
4.210–4.200: upper area, coinciding with the nearest POC/VAH cluster – selling pressure likely when price retraces here.
4.175: short-term support + area with sell-side liquidity; if this area is lost, price could be pulled to a deeper demand cluster.
4.164–4.133: potential Buy zone in a deep decline scenario – Volume Profile shows significant buying occurred around this area previously.
In short: on H1, the trend is down, prioritize selling according to volume; consider buying only when price falls to a lower discount area.
Trading scenario reference
(Not personalized advice – adjust volume & SL according to your account)
Scenario 1 – Sell following the downtrend structure (priority)
Sell area: 4.210–4.200 (POC/VAH + technical retracement area)
Idea: Wait for price to retrace to this area, observe H1/M15 for rejection candles (long upper tail, pin bar, engulfing…) before activating a Sell order.
Suggested take profit areas: TP1: 4.175
TP2: 4.164
TP3: 4.133 (in case of a strong 50–60 point decline)
Scenario 2 – Buy at deep discount area
Buy area: 4.164–4.133
Idea: Only consider buying when price has "dumped" deeply enough into the buy zone, with clear reversal candles on H1.
At that point, this is a technical retracement play, not trying to catch the bottom of a major trend.
Suggested take profit areas:
TP1: return to 4.175
TP2: 4.200
Macroeconomic context – Why is gold still hesitant?
Gold recorded a slight increase on Friday, but remains within the narrow trading range of the week.
Expectations of a dovish Fed continue to pressure the USD, generally supporting gold in the medium term.
However, buyers are waiting for US PCE data before taking larger positions:
If PCE cools significantly → reinforces the story of an early Fed rate cut → gold could easily rebound.
If PCE remains stubborn → market fears a "hawkish rate cut" scenario from the Fed → yields may rise, adding selling pressure on gold.
Risk management
For the Sell scenario, avoid chasing price in the middle of the area – prioritize waiting for a retracement to POC/VAH before entering, with a tight SL above the 4.210–4.215 area.
If participating in the Buy play at 4.164–4.133, consider splitting TP and moving SL to breakeven as soon as TP1 is reached to avoid constant chart monitoring.

Gold 1H – Will 4210 Reject Again or 4166 Ignite the Rally?🟡 XAUUSD – Intraday Smart Money Plan | by Ryan_TitanTrader (09/12)
📈 Market Context
Gold continues to soften under $4,200 as rising US Treasury yields pressure bullion, with markets positioning ahead of the upcoming Federal Reserve rate decision.
According to FXStreet, yields climbing intraday are capping gold’s upside, and sellers remain active below 4200 while participants wait for clarity on the Fed’s forward guidance.
This environment builds a liquidity-sensitive landscape, where institutions may engineer sweeps on both sides before committing to direction.
On H1, price oscillates cleanly between premium supply (4208–4210) and discount demand (4168–4166).
A valid push requires MSS → BOS → displacement from either extreme.
🔎 Technical Framework – Smart Money Structure (1H)
Current Phase: Sideways compression after consecutive CHoCH shifts
Key Idea: Expect liquidity grabs above 4210 or under 4166 before real movement
Liquidity Zones & Triggers
• 🔴 SELL GOLD 4208 – 4210 | SL 4218
• 🟢 BUY GOLD 4168 – 4166 | SL 4158
Institutional Flow Expectation:
sweep → MSS/CHoCH → BOS → displacement → FVG/OB retest → expansion
🎯 Execution Rules (matching your exact zones)
🔴 SELL GOLD 4208 – 4210 | SL 4218
Rules:
✔ Price taps premium zone (4208–4210)
✔ Bearish MSS/CHoCH confirmed on M5–M15
✔ Strong downside BOS + displacement
✔ Enter on FVG fill or refined supply OB retest
Targets:
1. 4185
2. 4175
3. 4168 – 4166
🟢 BUY GOLD 4168 – 4166 | SL 4158
Rules:
✔ Sweep under 4167 to collect sell-side liquidity
✔ Bullish MSS/CHoCH forms from discount
✔ Clean BOS + impulsive displacement upward
✔ Entry via bullish FVG fill or demand OB retest
Targets:
1. 4184
2. 4200
3. 4210
⚠️ Risk Notes
• Rising yields may generate deceptive spikes—avoid entries without BOS + displacement
• Do not chase price inside the compression range
• Keep SLs at structural invalidation, not arbitrary points
• Reduce exposure ahead of Fed-related volatility this week
📍 Summary
Today’s setup revolves around two institutional scenarios:
• A 4210 liquidity sweep triggers bearish structure → downside delivery toward 4166
or
• A 4166 liquidity grab forms bullish MSS → upside expansion back toward 4210
Let structure confirm.
Patience pays the trader—SMC reacts, never predicts. ⚡️
📌 Follow @Ryan_TitanTrader for daily Smart Money breakdowns.

Will GOLD Hold the Key Suppor? Watching for a Push Toward 4195Gold continues to trade within a tight intraday range. The 4180–4175 area is acting as a solid support zone, with buyers consistently stepping in on dips. On the upper side, supply remains active around 4200–4196, keeping price capped for now.
As long as Gold holds above the 4175–4180 support region, there is a reasonable probability of another attempt toward the 4195 level. A clean push above 4196 could open the door for buyers to retest 4200 and potentially higher. However, a breakdown below 4175 would invalidate this short-term bullish bias.
📌 Key Levels
Support: 4180–4175
Resistance / Supply: 4196–4200
Upside Target: 4195+
📈 Bias: Mildly bullish above 4175; neutral-to-bearish if broken.
⛔ Disclaimer: This is not financial advice. Always manage risk and trade based on your own analysis.
Your feedback drives our content and keeps everyone trading smarter. Let’s make those pips together! 🚀
Happy Trading,
– The InvestPro Team

Gold Stuck in Consolidation Ahead of FOMCGold just trading in sideways right now, stuck between 4,175 and 4,200 while everyone waits on tomorrow's FOMC. Current price around 4,194 is basically dead center of this range classic indecision. Nobody wants to make a move until Powell speaks.
Technically, it's pretty straightforward. If we push higher, there's resistance sitting at 4,240 4,255 that's been holding back rallies all week. On the flip side, a break below here targets the 4,100-4,120 support area .
The 25bp cut is basically a done deal. What traders actually care about is what Powell says about next year. Is the Fed done after this, or are more cuts coming? That's the real question, and nobody knows the answer yet.
So we're stuck in this boring chop. Volume's light, moves get faded quickly, and it's just back and forth noise. Honestly, it's the kind of price action that kills your soul if you're trying to trade it. Better to sit tight and wait for the Fed to give us some actual direction. Could rip through 4,240 if Powell's dovish, or dump to 4,100 if he sounds hawkish. Until then, it's just a waiting game.

Gold 1H – Will 4232 Trap Liquidity or 4170 Spark Expansion?🟡 XAUUSD – Intraday Smart Money Plan | by Ryan_TitanTrader (08/12)
📈 Market Context
Gold trades inside politically-driven liquidity as Donald Trump signals that the current method of tariffing through the US Supreme Court is “more direct, less cumbersome, and much faster.”
This introduces fresh uncertainty for USD flows, increasing short-term volatility across commodities.
Expect engineered sweeps on both sides as institutions react to policy-sensitive sentiment shifts.
On H1, price compresses between premium supply (4230–4232) and discount demand (4170–4168).
A confirmed MSS + BOS + displacement is required before any directional leg becomes valid.
🔎 Technical Framework – Smart Money Structure (1H)
Current Phase: Liquidity-rich compression inside a minor bullish channel
Key Idea: Sweeps first, real move later
Liquidity Zones & Triggers
• 🔴 SELL GOLD 4230 – 4232 | SL 4240
• 🟢 BUY GOLD 4172 – 4170 | SL 4162
Bias shifts only via structural break + clean displacement.
Expected Institutional Sequence:
sweep → MSS/CHoCH → BOS → displacement → FVG/OB retest → expansion
🎯 Execution Rules (matching your exact zones)
🔴 SELL GOLD 4230 – 4232 | SL 4240
Rules:
✔ Price taps 4231–4232 → bearish MSS/CHoCH on M5–M15
✔ BOS down + strong displacement candle
✔ Entry on bearish FVG fill / supply OB retest
Targets:
1. 4200
2. 4185
3. 4170
🟢 BUY GOLD 4172 – 4170 | SL 4162
Rules:
✔ Sweep below 4169 → bullish MSS/CHoCH
✔ BOS up + displacement from discount
✔ Entry on FVG fill or refined OB retest
Targets:
1. 4186
2. 4210
3. 4230 – 4232
⚠️ Risk Notes
• Headlines may induce fake sweeps; do not pre-commit without BOS + displacement
• No averaging inside compression
• SLs must sit at structural invalidation
• Reduce risk during tariff-related spikes
📍 Summary
Today’s playbook offers two institutional paths:
• 4231 sweep → bearish MSS → BOS → retest → delivery into 4170
or
• 4169 sweep → bullish MSS → BOS → retest → expansion back toward 4230+
Trade confirmations only.
Let gold show its hand — patience is your edge. ⚡️
📌 Follow @Ryan_TitanTrader for daily Smart Money breakdowns.

XAUUSD: The Bullish Pennant That Could Trigger the Next RallyHello everyone, what is your take on XAUUSD right now?
The 2 hour chart is becoming quite interesting. Price action is shaping a clean bullish pennant, a pattern that often suggests the market is building pressure for its next major move. After completing its corrective pullback, XAUUSD is beginning to show signs that buyers may be preparing to re-enter and push the trend higher again.
If momentum returns, my outlook targets a break above 4265, followed by an extension toward 4430. This zone aligns perfectly with the Fibonacci 1.618 projection, which adds strong confluence to the bullish scenario.
Share your thoughts and your targets in the comments. I would love to hear how you are interpreting this setup.

XAGUSD – Clean Rejection From Discount Zone With Upside Silver reacted perfectly from a refined discount zone after a controlled pullback. The immediate rejection and push back above micro structure levels indicate bullish absorption and renewed momentum.
This reaction aligns with the broader HTF bullish narrative, suggesting price may continue expanding toward upside inefficiencies if structure holds.
Bullish Path:
• Tap into refined discount zone
• Strong rejection wick + recovery
• LTF structure shift confirming accumulation
• Expansion toward next HTF imbalance / liquidity pocket above

XAUUSD – Brian | Volume Profile & Fed WeekXAUUSD – Brian | Volume Profile & Fed Week: prioritize Sell at VAH, Buy only when reaching discount price area
1. Market snapshot
On H1, gold retested last week's peak and then dropped immediately, indicating that buying pressure at high price levels remains cautious – investors are not ready to "chase the price."
The current structure does not clearly show a long-term trend, but in the short term, there are signs of distribution around high price levels, favorable for selling scenarios according to Volume Profile.
Today, Brian prioritizes watching for a Sell after the price fills the FVG and touches the VAH, while also preparing a Buy scenario at a lower area if the market sweeps liquidity strongly.
2. Volume Profile & price structure
The VAH area around 4,233–4,235 coincides with the FVG area above:
This is where large volumes were previously traded, making it easy for profit-taking/sell-off forces to appear.
Below, the sell-side liquidity levels are spread around 4,200 – 4,175 – 4,140, coinciding with the lows of previous sessions.
The area 4,172–4,175 is a good balance zone for the Buy scenario: below it is a cluster of liquidity and just above a broader Buy zone around 4,140 on the chart.
3. Trading plan for this week
Scenario 1 – Sell according to Volume Profile (priority)
Entry Sell: 4,233–4,235 (VAH + FVG)
SL: 4,241
TP1: 4,215
TP2: 4,200
TP3: 4,175
TP4: 4,140
Idea: wait for the price to fill the FVG and touch the VAH, observe the H1/M15 candle reaction. If there is a clear rejection signal (long upper tail, pin bar, engulfing…), activate the Sell order. This is a short-term play, based on volume & liquidity, not a chase sell when the price is in the middle of the zone.
Scenario 2 – Buy when the price reaches the discount area
Entry Buy: 4,172–4,175
SL: 4,165
TP1: 4,195
TP2: 4,220
TP3: 4,245
TP4: 4,290
Idea: if the price is strongly sold off sweeping through the sell-side liquidity areas, the area 4,172–4,175 can become a good demand zone to catch the rebound, especially when a nice candle reaction appears on H1. This is a "catch the rebound" buy position in the context of this Fed week, requiring disciplined SL.
4. Macro context – Why is the market hesitant?
Last Friday, gold jumped to 4,260 USD and then quickly fell to 4,200 USD, mainly due to the sharp rise in US bond yields as the market awaited the Fed meeting.
Although the market still prices in a high probability of the Fed cutting 25 bps, sentiment is divided by the "hawkish rate cut" scenario:
The Fed cuts but maintains a tough tone on inflation → yields are unlikely to fall deeply, gold is easily sold at high levels.
USD maintains its range, US economic data is relatively stable, causing money flows to "not dare to all-in" on gold before the dot-plot and Powell's speech.
Therefore, this week is the Fed's week: the short-term direction of gold will depend heavily on the policy message, especially the expected reduction path for next year.
Follow to receive the earliest articles from Brian

Real-Time XAG/USD Chart Analysis: Bullish Momentum Builds TowardFOREXCOM:XAGUSD
Real-Time XAG/USD Chart Analysis: Bullish Momentum Builds Toward $60
As of December 8, 2025 (Intraday: Early Trading)
Current Price: 58.31 USD (Down ~0.08% from previous close of 58.36; trading range: 57.59–58.74)
Asset: XAG/USD (Silver Spot vs. US Dollar)
Key Context: Silver's consolidating just shy of its all-time high of 59.42 hit earlier this week, with fresh ETF inflows and tightening physical inventories underscoring the uptrend. Amid Fed rate-cut bets and robust industrial demand (solar, AI), the technical setup leans Strong Buy—a pullback could be a gift for longs eyeing new records.
Quick Macro Snapshot
Tailwinds: Weaker USD from softer PCE inflation and labor data, plus record SLV ETF inflows (highest in 10 years). Supply crunch on Shanghai exchanges at multi-year lows, with green tech demand projected to drive deficits. Silver's 2025 YTD gains now at ~83%, outpacing gold's rally.
Headwinds: Overstretched speculative positioning could spark profit-taking; hawkish Fed signals next week might cap upside if yields rebound.
Technical Breakdown
Pulling from daily and 4H charts, the bias is firmly bullish despite minor intraday dips:
Trend & Moving Averages (Strong Buy):
Daily: Price well above rising 200-day EMA (~55.00) and 50-day EMA (~50.00), with all major MAs aligned bullish. 200-hour EMA at 56.30 provides dynamic support.
4H: Golden cross intact on EMAs; buyers defending the ascending channel.
Implication: Uptrend channel from October lows holding; retest of $59+ imminent on volume pickup.
Momentum Indicators (Neutral with Bullish Tilt):
RSI (14): 50.82 (Neutral)—cooled from overbought but no divergence yet, leaving room for extension.
MACD (12,26): Recently slipped negative below zero line (bearish histogram), signaling short-term downside momentum, but line still above signal overall.
Stochastics (9,6): ~65 (Buy territory); not overbought.
CCI (14): Neutral (~0); Williams %R: -45 (Mild buy).
ADX (14): 28 (Moderate trend strength, bullish direction).
Implication: Momentum pausing after the ATH push, but neutral RSI avoids sell signals—watch for bullish crossover.
Volume & Volatility:
ATR (14): ~0.85 (Elevated vs. recent avg., indicating volatility spike post-breakout).
Bull/Bear Power: Bulls dominant (+0.45), with options flow heavy on calls.
Pivot Points & Key Levels (Classic):LevelPriceTypeR359.50ResistanceR259.20ResistanceR159.00ResistancePivot58.15NeutralS157.50SupportS256.50SupportS356.20Support
Support Cluster: 56.20–56.50 (200h EMA + key zone; break below eyes 55.25 weekly support).
Resistance: 59.00–59.35 (recent ATH; clear for $60+ push).
Fibonacci: 61.8% extension from Oct lows targets 60.50.
Weekly Outlook
Broader uptrend: Strong Buy on MAs; Triangle pattern resolving higher, with potential test of 55.25 support before rally to 60.65–68.05. YTD doubling makes $65 realistic if Fed cuts materialize.
Risk: Drop below 56.20 could accelerate to 54–55 (prior resistance-turned-support), but low probability amid deficit forecasts.
Bias: Buy the dip—industrial tailwinds and ETF momentum point to $60 by quarter-end.
Trade Takeaway: Long above 58.15 pivot (stop below 56.50). Target R1 at 59.00 for 1:2 risk/reward. Squad, silver's stealing gold's thunder—$60 next, or Fed-induced pause? What's your play? #XAG #SilverAnalysis #SignalSquad
Why Gold Hits Your SL🌟 Why Gold Hits Your SL 😭💛📈
Gold is one of the most aggressive and volatile assets in the market — and if you’ve ever wondered “Why does gold ALWAYS hit my stop-loss before moving in my direction?”, this post explains the real reason.
Let’s break it down clearly 👇
🔶 1. Gold Loves Liquidity — Not Levels 💦💰
Gold doesn’t move based on your support/resistance lines.
It moves based on liquidity, meaning:
Where traders place stop-losses ❌
Where pending orders sit 🎯
Where large institutions want to fill positions 🏦
Your SL is simply sitting where everyone else puts theirs, which makes it prime liquidity.
🔶 2. XAUUSD Spikes Are Designed to Collect Orders ⚡💥
Gold often creates sudden:
Wicks
Fake breakouts
Quick pumps or dumps
Sharp candle spikes
These moves are NOT random — they’re engineered to:
🔸 Trigger stop-losses
🔸 Activate pending buy/sell orders
🔸 Grab liquidity before the real move
This is why your SL gets hit by $1–$3 before price completely reverses.
🔶 3. Gold Moves Session-by-Session 🕒🌍
Gold behaves differently depending on the time of day:
Asia session → Slow, tight range
London session → First big manipulation
New York session → Volatility explosion + real direction
Most SL hunts take place when London opens or when NY session begins ⚠️🔥
🔶 4. Clean Highs & Lows = SL Magnets 🧲📌
Gold LOVES attacking:
Previous day’s high/low
Asian range high/low
London session extremes
Double tops & bottoms
Round numbers (like 4000 / 4050 / 4100)
These areas hold thousands of stop-losses.
So before gold takes a real direction — it sweeps them first. 🏹😈
🔶 5. The Classic Gold Pattern: Trap → Reversal → Expansion 🔁🚀
Most XAUUSD moves follow this sequence:
1️⃣ Sweep liquidity 😭
2️⃣ Fake breakout 😈
3️⃣ Sharp rejection 👋
4️⃣ Real trend begins 🚀
If you’ve ever seen price:
Break a level
Wick hard
Then reverse the entire move
That’s gold performing a liquidity grab.
🔶 6. How To Avoid Getting Stopped Out ✔️
Here’s what actually helps:
🌟 A. Don’t put SL exactly at obvious levels
Move it beyond common liquidity zones.
🌟 B. Wait for the sweep before entering
Let gold perform the trap first.
🌟 C. Trade reaction — not prediction
Look for re-entry after the wick forms.
🌟 D. Use sessions to your advantage
Avoid placing SL right before London/NY opens.
🌟 Final Words
Gold isn’t hunting you —
it’s hunting liquidity.
Your job is simple:
👉 Stop placing stops where everyone else does
👉 Let gold sweep liquidity first
👉 Then catch the real move
Trade smarter, not tighter. 💛⚡

Gold 1H – Will 4242 Displace or 4170 Unlock the Next Leg?🟡 XAUUSD – Intraday Smart Money Plan | by Ryan_TitanTrader (04/12)
📈 Market Context
Gold squeezes into engineered liquidity as Donald Trump signals policy authorization for ultra-compact car production in the U.S., adding risk-on volatility to USD narratives. Markets may front-run sentiment shifts into commodities like gold. Expect fast bilateral sweeps before institutions reveal intent.
On H1, structure toggles between premium supply at 4242–4244 and discount demand at 4170–4168. The next directional leg requires MSS + BOS + displacement confluence.
🔎 Technical Framework – Smart Money Structure (1H)
Current Phase = liquidity-rich compression at H1 extremes
Liquidity Zones & Key Triggers
• 🔴 SELL GOLD 4242 – 4244 | SL 4252
• 🟢 BUY GOLD 4170 – 4168 | SL 4160
Bias invalidation only via structure break + displacement validation.
Expected Sequence = Sweep → MSS/CHoCH → BOS → Displacement → Retest → Expansion
🎯 Execution Rules (unchanged methodology, matching your zones)
🔴 SELL GOLD 4242 – 4244 | SL 4252
Rules:
✔ Zone tap 4243 → bearish MSS/CHoCH (M5–M15)
✔ Clean bearish BOS down + candle displacement
✔ Entry on FVG fill or OB retest after displacement
Targets:
1. 4200 – 4190
2. 4182 – 4176
3. 4170 – 4168
🟢 BUY GOLD 4170 – 4168 | SL 4160
Rules:
✔ Sweep under 4169 → bullish MSS/CHoCH + BOS up
✔ Displacement candle away from discount
✔ Wick rejection into FVG fill / OB retest confirm
Targets:
1. 4186
2. 4210
3. 4242+
⚠️ Risk Notes
• Both sweeps = traps until BOS + Displacement confirms intent
• No averaging inside compression
• SL = structural invalidation only
• Reduce size during headline-driven spikes
📍 Summary
Two institutional paths today:
• 4243 sweep → bearish MSS/BOS → retest → delivery into 4170
or
• 4169 sweep → bullish MSS/BOS → retest → expansion into 4242+
Trade the structure. Let price narrate the intent. Patience = edge. 🚀
📌 Follow @Ryan_TitanTrader for daily Smart Money breakdowns.

XAUUSD – Brian | Volume Profile & TrendlineXAUUSD – Brian | Volume Profile & Trendline: prioritize Sell, wait for a “good deal” in the liquidity zone
1. Market snapshot
On H1, gold is touching the trendline just as yesterday's scenario – this is an area where strong price reactions may occur.
The current structure shows that the price is gradually distributing below the trendline, with no clear signal that buyers have regained control.
In the short term, Brian prioritizes the Sell scenario, utilizing the POC – VAH – FVG areas of the Volume Profile to find entry points.
2. Volume Profile – Key price areas to note
Short-term POC/VAH area around 3,488–3,492 (according to his chart):
This is an area where dense trading occurred, the profile “bulges” out, indicating strong market interest.
When the price returns to this area, a reaction is expected – suitable for entering orders in the current priority direction.
Sell-side liquidity below: If gold cannot hold the POC/VAH area and is pushed down, the liquidity area below will become a reasonable target for the next downward move.
Gold is likely to fluctuate sideways on Friday to close the weekly candle below the trendline, then consider a clearer break at the start of next week.
3. Trading scenario for next week
Scenario 1 – Prioritize Sell at the Volume Profile area
Main mindset: When the price returns to the POC/VAH areas above, prioritize finding short signals instead of chasing buys.
Watch for clear candle reactions (long upper tail, pin bar, engulfing…) at the thick profile area.
Target: Gradually close towards lower liquidity areas (sell-side liquidity) below.
Depending on price behavior, the target can be expanded if selling pressure intensifies at the start of the week.
Scenario 2 – Break trendline & buy the retracement
If gold decisively breaks the downtrend line, closes above, and maintains the new structure:
Then, the strategy will shift to buying the retracement at the trendline itself (now acting as support).
The POC/VAL area below will then become a reasonable “buy zone” to follow the new upward trend.
In summary: before a clear break occurs, Brian still prioritizes selling at high liquidity areas, rather than rushing to catch the bottom.
4. Fundamental context – Large capital still supports gold
Central banks are increasing gold purchases:
In October, global central banks net purchased +53 tons of gold, the highest level since 11/2022.
This figure increased by +194% compared to July, marking the third consecutive month of increased purchasing speed.
This indicates: Short-term selling pressure may appear around the trendline/resistance, but long-term capital flow still favors gold.
Any deep declines later may still attract buying power from large institutions.
5. Risk management suggestions
Maintain the mindset: Sell is the current priority scenario, not the only option – if the structure changes, be ready to switch to buy.
Do not overlook the nearest liquidity/swing low area to place SL – avoid dragging SL too far due to emotions.

Gold Market Flow Points Toward Higher LevelsGold Market Flow Points Toward Higher Levels
Gold continues to display a controlled upward trajectory characterized by steady accumulation and orderly price expansion. The recent sessions show a consistent pattern of demand absorption, where each corrective phase is met with renewed buyer engagement, preventing deeper retracements. This suggests that the market remains comfortably positioned within a bullish environment, supported by ongoing interest from medium-term participants.
Price flow has transitioned away from the aggressive liquidation seen earlier in the month and is now driven by a more balanced rotation between buyers and short-term profit-takers. Despite this rotation, the dominant pressure remains upward, as visible through the repeated failure of sellers to extend declines. Momentum flows indicate that buyers are gradually reclaiming lost ground after every corrective cycle, signaling stable confidence in higher valuations.
Market behavior also reflects a pattern where liquidity beneath short-term swing points is routinely harvested before upward expansion resumes. This action shows that deeper market participants continue to optimize entry points by collecting orders during brief moments of weakness. Once these orders are filled, price rapidly rotates back upward, revealing that underlying demand remains unshaken.
Current positioning suggests that Gold is in a preparation phase for another expansion leg. Price is stabilizing in a compression zone where volatility temporarily narrows before a directional drive. Historically, such compression within an established upward environment often precedes continuation, especially when buyers demonstrate willingness to defend even shallow pullbacks.

Gold 1H – 4262 Sweep Drop or 4188 Hold the Floor?🟡 XAUUSD – Intraday Smart Money Plan | by Ryan_TitanTrader (03/12)
📈 Market Context
Gold is trading into policy-driven liquidity engineering as former White House adviser Kevin Hassett gains renewed spotlight after public commentary from former U.S. President Donald Trump referencing potential Federal Reserve leadership influence. Expect sharp liquidity sweeps both sides before institutions commit.
Technically, H1 price coils between premium and discount extremes, and the next leg unlocks only after MSS (CHoCH) + BOS + displacement validation.
🔎 Technical Framework – Smart Money Structure (1H)
Current phase = liquidity-rich compression at H1 extremes
Liquidity zones & key triggers
• 🔴 SELL GOLD 4265 – 4267 | SL 4275
Institutional idea: sweep above premium → bearish MSS + valid BOS down → FVG/OB retest → delivery into discount.
• 🟢 BUY GOLD 4186 – 4184 | SL 4176
Institutional idea: sweep below discount → bullish MSS + BOS up → FVG/OB retest → demand expansion.
• 🟡 Equilibrium / Chop: no trading unless structure proves intent.
Expected sequence = Sweep → MSS/CHoCH → BOS → Displacement → Retest → Expansion
🎯 Execution Rules (unchanged methodology, matching your zones)
🔴 SELL GOLD 4265 – 4267 | SL 4275
Rules:
✔ Price taps 4266 zone → bearish MSS/CHoCH (M5–M15)
✔ Confirm clean bearish BOS down with displacement
✔ Enter on FVG fill or OB retest after displacement
Targets:
1. 4245 – 4240
2. 4225 – 4215
3. 4186 – 4184
🟢 BUY GOLD 4186 – 4184 | SL 4176
Rules:
✔ Price sweeps 4185 → bullish MSS/CHoCH + BOS up
✔ Confirm displacement away from discount
✔ Enter on wick rejection + FVG fill or OB retest confirmation
Targets:
1. 4215
2. 4240
3. 4265+
⚠️ Risk Notes
• Both sweeps = traps until BOS + displacement proves intent.
• No averaging inside compression.
• SL = structure invalidation only.
• Reduce lot size during volatility spikes from headline risk.
📍 Summary
Two institutional routes today:
• 4266 sweep → bearish MSS/BOS → retest → delivery into 4185
or
• 4185 sweep → bullish MSS/BOS → retest → expansion into new 4266+
Trade the structure. Let price narrate intent. Patience = edge.
📌 Follow @Ryan_TitanTrader for daily Smart Money breakdowns.

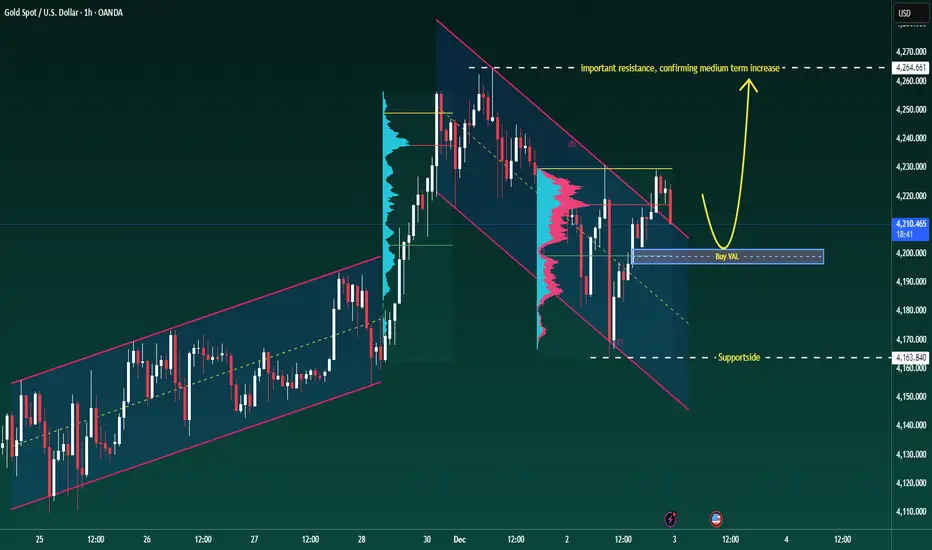
XAUUSD–Volume Profile buy scenario around 4,200, target 4,265+XAUUSD–Volume Profile buy scenario around 4,200, target 4,265+
Brian – Prioritize buying with the trend, use VAL to position entry
Market snapshot
At the end of the US session yesterday, gold had a strong increase and then stabilized, currently moving sideways around 4,216 on H1.
The structure is still an uptrend, the current decline is mainly a technical correction within the value area.
On the chart, the 4,264–4,265 area is marked as important resistance, where if broken, the medium-term uptrend could be unleashed more strongly.
Volume Profile & key price areas
The VAL (Value Area Low) of the Volume Profile is currently around 4,200 – this is an area where the market has previously accepted a large volume of trades, suitable for trend-following buys.
A deeper support area is around 4,164 (Supportsides on the chart), where buyers have previously intervened very clearly.
Above: 4,265 – confirmed resistance, if broken will strengthen the scenario of gold heading to higher price areas, matching the "super cycle 5,000 USD" story in the long term.
Trading plan for next week (according to H1 & Volume Profile)
Priority scenario – Buy at VAL with the trend
Buying area: around 4,200 (VAL of Volume Profile).
Can flexibly range 4,198–4,203 depending on spread and market conditions.
Idea: wait for the price to pull back to the VAL area, observe H1 candle reactions (long lower tail, rejection candles...) before entering the order.
Immediate targets:
TP1: area 4,240–4,245
TP2: 4,265 – important resistance marked as "important resistance, confirming medium term increase".
If the price closes clearly above 4,265 and successfully retests, consider holding part of the position or finding additional entry points, according to the scenario of expanding to higher areas in the new cycle.
Defensive scenario – Deep support
If the 4,200 area does not hold, the 4,164 area will be the next support to watch.
Closing H1/D1 below 4,164 will be a signal to reduce short-term expectations and wait for a new structure instead of trying to "buy every dip".
Fundamental context – Reasons gold is still supported
Gold is heading for its best growth year since 1979, with an increase of over 60% in 2025 – this is the context of a true bull market, not just a recovery wave.
YTD performance of XAU outperforms BTC, showing that large capital flows prioritize stability and gold's safe haven role.
Current supporting factors: US bond yields cooling, USD weakening.
Geopolitical tensions escalating, Russia–US negotiations have not brought clear breakthroughs.
The market prices in nearly a 90% chance of the Fed cutting rates at the next meeting, making non-yielding assets like gold more attractive.
Follow Brian to share the Gold scenario together
Gold H1 – Will 4278–4280 Trigger a Drop Into 4170 Today?🟡 XAUUSD – Intraday Smart Money Plan | by Ryan_TitanTrader (01/12)
📈 Market Context
Gold continues its impressive rally as markets price in a potential rate cut by the Federal Reserve (Fed) in December. Spot gold recently surged past $4,230/oz — hitting a multi-week high — as the US Dollar Index (DXY) weakened.
The backdrop is increasingly dovish: fading USD strength, soft U.S. macro data, and dovish comments from Fed officials have fueled speculative buying in gold.
Technically, gold remains elevated, hovering inside a rising channel — similar to what’s shown on your chart. Price compression following strong displacement suggests a consolidation before the next institutional move.
🔎 Technical Framework – Smart Money Structure (H1)
Current state = Accumulation / Distribution within rising channel
Liquidity zones & key triggers
• Premium liquidity zone (sell-opportunity): ~ 4278–4280 (near upper channel resistance) — aligns with your SELL zone.
• Discount liquidity zone (buy-origin / re-entry zone): ~ 4172–4170 (near lower channel support / trendline) — aligns with your BUY zone.
• Equilibrium / chop zone: mid-channel / recent consolidation zone — avoid trading blindly here unless structure breaks.
Expected Smart Money sequence
Sweep → CHoCH/MSS → BOS → Displacement → Retest (FVG/OB) → Expansion
Given the macro tailwinds (weak USD, rate-cut odds), gold remains primed for a directional move once structure confirms.
🎯 Trade Plans for Today
🔴 SELL GOLD 4278 – 4280 | SL 4288
• Thesis: A liquidity sweep at channel top / premium zone followed by engineered bearish displacement — capturing liquidity before a reversal.
• Entry rules (must wait for confirmation):
• Price touches 4280 zone
• Bearish CHoCH / MSS + BOS down on M5–M15
• Entry ideally on FVG fill or after order-block retest post-BOS
• Targets:
1. 4245 – 4240 area (first reaction)
2. 4225 – 4215 (mid-channel retest)
3. 4175 – 4172 (lower channel + buy zone)
🟢 BUY GOLD 4172 – 4170 | SL 4162
• Thesis: Discount-origin tap near lower channel support / trendline — smart money likely to accumulate for next leg up, especially amid dovish Fed sentiment.
• Entry rules (must wait for confirmation):
• Price dips into 4170 zone
• Bullish CHoCH / MSS + BOS up on M5–M15
• Strong bullish wick + FVG fill or OB retest confirmation
• Targets:
1. 4225 – 4230 (first reaction / mid-channel)
2. 4255 – 4265 (upper mid-channel)
3. 4278 – 4280+ (premium liquidity retest)
⚠️ Risk Management & Notes
• Avoid trading inside the mid-channel chop zone without structural confirmation — no “blind” entries.
• Do not treat sweeps (top or bottom) as trend entries — these are often traps.
• Use tight SL (structure invalidation), avoid averaging in consolidation.
• Given potential volatility from macro headlines or a USD bounce, consider reducing lot size.
Summary
Gold is currently riding macro tailwinds — weak USD + Fed rate-cut odds — but from a technical perspective, it’s compressed inside a rising channel. The day’s price action may be a classic Smart Money liquidity hunt: either a sweep at 4278–4280 leading to a sharp drop toward 4170, or a retracement to 4170 that sets up a fresh bull leg.
Only trade after structural confirmation (CHoCH / BOS + retest) — avoid “trend-hop” entries.
📍 Follow @Ryan_TitanTrader for daily Smart Money updates.

Gold 1H – Can 4265 Breakout or Trap Into 4185?🟡 XAUUSD – Intraday Smart Money Plan | by Ryan_TitanTrader (02/12)
📈 Market Context
Gold continues its impressive rally as markets price in a potential rate cut by the Federal Reserve in December. Spot gold recently surged — reflecting multi-week highs — as the US Dollar Index (DXY) weakened. The backdrop is increasingly dovish: fading USD strength and rate-cut odds have kept gold bid.
From a technical perspective, price sits compressed at the channel top, signaling liquidity plays before the next institutional leg. Macro tone from Powell’s opening remarks on ForexFactory adds volatility fuel.
🔎 Technical Framework – Smart Money Structure (H1)
Current state = Accumulation / Distribution within rising channel
Liquidity zones & key triggers
• Premium liquidity zone (sell-opportunity): ~4265–4267 (upper-edge pool of liquidity)
• Discount liquidity zone (buy-origin / re-entry zone): ~4186–4184 (demand liquidity near prior displacement base)
• Equilibrium / chop zone: mid-channel compression → no blind trading unless structure validates direction
Expected Smart Money sequence
Sweep → CHoCH/MSS → BOS → Displacement → FVG/OB Retest → Expansion
Gold remains primed for a directional move only after structure confirms intent.
🎯 Trade Plans for Today
🔴 SELL GOLD 4265 – 4267 | SL 4275
• Thesis: Liquidity sweep above equal highs at premium edge, followed by engineered bearish BOS confirming institutional selling intent.
• Entry rules (must wait for confirmation):
✔ Price pokes 4266 zone → bearish CHoCH/MSS + BOS down (M5–M15)
✔ Entry on FVG fill or OB retest after BOS validation
• Targets:
1. 4245 – 4240 (first reaction)
2. 4225 – 4215 (channel EQ retest)
3. 4186 – 4184 (full delivery into discount)
🟢 BUY GOLD 4186 – 4184 | SL 4176
• Thesis: Discount liquidity tap at institutional base, buy absorption after sweep + bullish BOS signaling new intraday demand.
• Entry rules (must wait for confirmation):
✔ Price sweeps 4185 → bullish CHoCH/MSS + BOS up (M5–M15)
✔ Entry on rejection wick + FVG fill or OB retest confirmation
• Targets:
4. 4215
5. 4240
6. 4265+
⚠️ Risk Management & Notes
• Avoid trading inside mid-range without CHoCH/BOS validation — sweeps are traps until proven by MSS + BOS.
• Use SL for structure invalidation only — no averaging in compression.
• Reduce lot size during Powell’s delivery window; macro impulses can run both sides of liquidity fast.
📍 Summary
Gold is coiling at highs for liquidity. Either Powell triggers a 4266 sweep → bearish BOS → delivery, or price hunts 4185 discount → bullish BOS → continuation.
Trade the structure, not the narrative — wait for CHoCH & BOS + retest to unlock expansion.
📌 Follow @Ryan_TitanTrader for daily Smart Money updates.

XAUUSD (Gold Spot) – Daily & H4 Update | 03 Dec 2025Yesterday’s session delivered exactly the kind of two-way volatility we often see when a strong trend starts to lose momentum. Gold opened with early selling pressure, dropped sharply, and filled the bullish Fair Value Gap (between roughly 4170–4200 before finding buyers. The 4200 psychological round number held firm as dynamic support, and more importantly, yesterday’s daily candle closed comfortably above it, a clear sign that bulls are still defending this zone aggressively for now.However, the broader context remains cautionary. As highlighted yesterday, we printed a very narrow Central Pivot Range positioned near the top of the recent range. Price ultimately closed below this CPR, which is typically a bearish development and suggests the aggressive bullish momentum we saw through November is fading, at least in the short term.Current Technical Structure
Immediate resistance cluster sits at 4245-50. A convincing H4 close above 4230 (Fib level for recent drop) would be the first meaningful sign of renewed bullish strength.
The real confirmation of trend continuation comes only with a decisive break and daily close above 4245–4250 (R1 and the recent range high). Until that happens, the path of least resistance leans lower within this ascending channel.
Key Levels to Watch TodayBullish scenario Hold above 4230 → potential retest of 4250–60
H4 close > 4230 → opens 4245–4250 and possibly 4280 (R2)
Daily close > 4245 → resumes the broader uptrend targeting 4300+
Bearish scenario Failure to sustain today’s CPR (4198–4203) on an intraday basis increases downside risk
Break and close below 4198–4200 → high-probability move toward Previous Day Low ~4165
Loss of 4165 exposes S2 ~4130 and potentially the lower levels
Summary & Bias As long as 4200 hold, the structural uptrend remains valid . That said, the narrow-top CPR, repeated failure at 4245–4250, and yesterday’s close below CPR all point to waning momentum. base case for the next 24–48 hours is continued range-bound/two-way action between 4165–4250 unless we get a clear daily close outside of this zone. A sustained break below 4198–4200 would shift near-term bias to bearish with 4165 and 4130 as logical downside targets. Conversely, bulls need to reclaim and hold 4230+ quickly to keep the November uptrend alive.

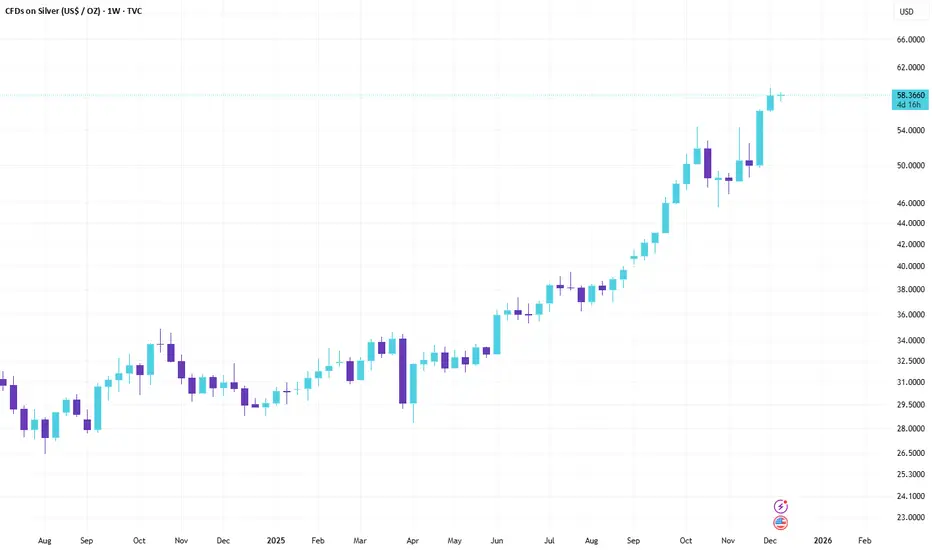
Silver - CorrectionSeveral signals indicate that a correction is possible around the 60k level (slightly below or above). There’s also an interesting setup in gold, but more on that later in the next chart/idea.”

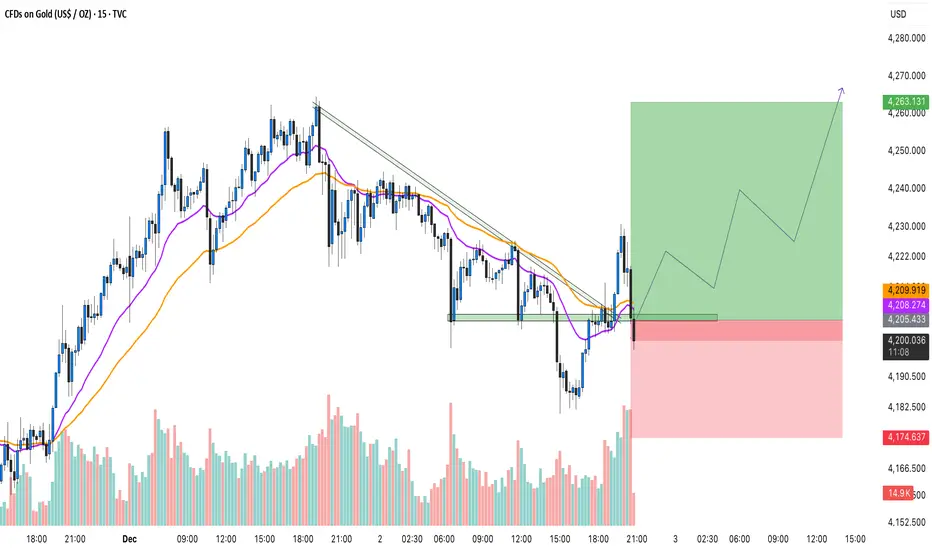
Gold Breaks Trendline – Bulls Back in Control!Hello Everyone let's analyse Gold as it has broken above its falling trendline resistance, signaling a possible shift from short-term weakness to bullish momentum. After several attempts, the price finally managed to close above the trendline with increasing volume, showing that buyers are stepping in again.
Currently, Gold is retesting the previous resistance turned support zone around $4200–$4205. As long as price holds above this level, the structure remains positive, and the next upside targets could be seen toward $4260–$4270.
Short-term traders can look for confirmation candles near support before entering. A clean retest followed by bullish continuation can offer a good risk–reward setup. On the other hand, if the price breaks back below $4190, momentum could slow down again.
Disclaimer: This analysis is for educational purposes only and should not be taken as financial advice. Please do your own research or consult your financial advisor before investing.
Analysis By @TraderRahulPal | More analysis & educational content on my profile.
If you found this helpful, don’t forget to like and follow for regular updates.
Gold Faces Critical Resistance: Will Bulls Break Through or FadeGold is currently trading around 4,217, , as bulls continue to struggle with a persistent resistance zone that has proven difficult to crack. .
The $4,240-4,250 level has emerged as a significant ceiling for gold price, repeatedly rejecting bullish advances over recent sessions. Multiple attempts by buyers to establish a foothold above this area have been met with aggressive selling pressure, creating major resistance for the current rally.
The repeated failures at this level suggest strong conviction from bears defending this zone.
Today's Central Pivot Range (CPR) formation presents a narrow range, which historically signals an imminent volatility expansion.
A narrow CPR often acts as a coiled spring the tighter the compression, the more explosive the eventual breakout. This technical setup demands heightened attention to risk management and position sizing.
Key Technical Levels to Watch
The ascending trendline (black diagonal) provides dynamic support
Bullish Order Block: $4,170-4,200 zone
Bullish Case:
A convincing breakout and close above 4,250 would invalidate the recent resistance and likely trigger stops from short sellers, potentially fueling a rapid move toward the R2 level at $4,290. The key word here is "sustain" we need to see buyers hold gains above resistance, not just spike through momentarily.
Bearish/Consolidation Case:
Failure to breach 4,250 could lead to profit-taking and a drift back toward the $4,200 level. A break below the ascending trendline would be a more significant warning sign, potentially opening the door to a test of the $4,170-4,200 order block. Loss of this support zone could accelerate selling toward $4,150.
Breakout traders: Wait for a decisive close above $4,250 with strong volume before entering long positions, targeting $4,275-4,300
Range traders: Look for mean reversion plays within the $4,200-4,240 range
Trend followers: Watch for trendline support holds for continuation long entries

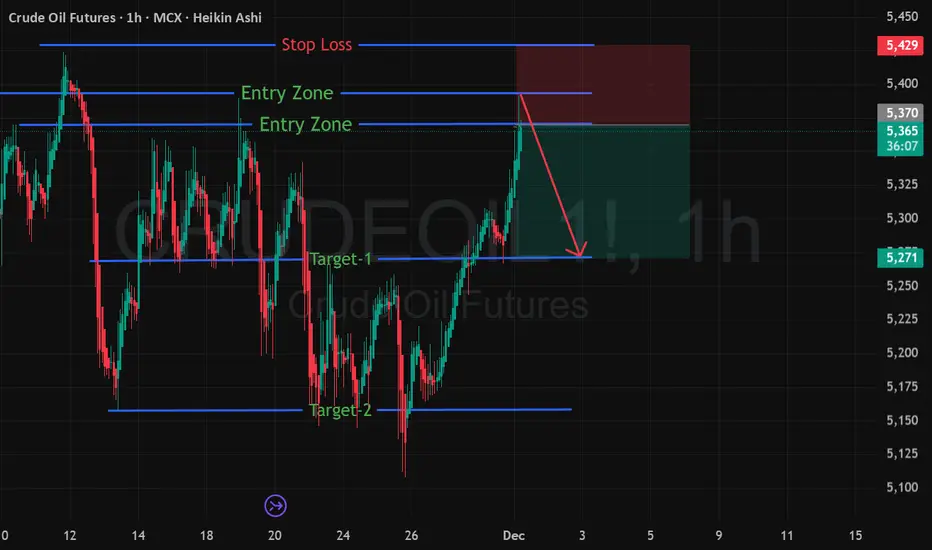
MCX CRUDE OIL (DEC-25) — Bullish Trend Setup IdentifiedA fresh Bullish Trend Entry Zone has been detected on MCX Crude Oil DEC-25, indicating a potential upside continuation from the demand zone.
📈 Trade Setup
🟢 Entry Range: 5370 – 5390
🔴 Stop Loss: 5430
🎯 Target 1: 5270
🎯 Target 2: 5170
📊 Chart Explanation
Crude Oil has recently shown strong accumulation behavior near the lower demand band. Price is now entering a bullish reversal range, supported by:
Prior demand zone retest
Higher-low structure
Increasing bullish momentum
Buyers absorbing supply near 5370–5390
This setup indicates a possible swing move towards the 5270 and 5170 zones.
⚠️ Risk Management
Keep SL strictly at 5430
Position sizing is crucial as volatility remains high
This analysis is for educational purposes—trade with discipline
📌 Summary
Crude Oil DEC-25 is showing a clean bullish continuation structure. If price sustains above the entry zone, we may see a strong move toward the mentioned targets.