XAUUSD – Reading the Market’s Secret IntentionsH1 Outlook – 24 November 2025
🌐 MARKET CONTEXT
Gold enters the new week with a controlled, slow-paced volatility environment, as the market continues to balance between inflation expectations, shifting USD flows, and cautious positioning ahead of major U.S. data.
Recently, price has shown repeated rejection from premium zones, forming a mild bearish intraday bias across the H1 structure. The market is still operating inside a liquidity-rich environment where institutions are engineering both upside and downside sweeps before choosing a clear direction.
Recent Drivers
USD holds moderate strength after last week’s hawkish Fed commentary
Market remains in “wait-and-watch” mode ahead of mid-week data
No strong risk-off sentiment → gold lacks solid fundamental support
Session Expectations
London: Early liquidity sweeps above premium levels expected
New York: Higher probability of real trend expansion
Bias: Mild bearish unless deep discount zones trigger CHoCH on H1
Price is currently mid-range → only extreme liquidity areas provide safe, high-probability setups.
📉 TECHNICAL ANALYSIS (SMC + LIQUIDITY)
Market Structure
H1 structure forming: Lower Highs → Lower Lows
Equilibrium zone: 4070–4090
Strong inducement layers above 4146 and 4071
Liquidity Map
Buy-side Liquidity (BSL): Above 4146, 4071
Sell-side Liquidity (SSL): Below 4030 and 3994
Market forming engineered wicks at both ends → ideal for SMC traders
Imbalance Zones
Bearish FVG: 4146–4148 → prime area for premium sells
Minor Imbalance: 4068–4071 → intraday scalp reversal potential
Discount Imbalances: 4032 and 3996 → clean reaction zones for buys
🔑 KEY PRICE ZONES
(Clear explanations linked directly to your entries)
4148–4146 ▶️ Premium Sell Zone – High Manipulation Area
Unmitigated supply zone + major BSL buildup.
Smart money usually induces breakout buyers here before reversing sharply.
4068–4071 ▶️ Secondary Premium Pool – Scalp Rejection
A mini-liquidity pocket above equilibrium.
Perfect for quick stop-hunt sweeps during London session.
4032–4030 ▶️ Discount Reaction Zone – Strong Scalping Demand
A small OB + SSL cluster.
Expect fast, technical bounces with low drawdown.
3996–3994 ▶️ Deep Discount Zone – High-Value Reversal
Highly reactive zone where institutions accumulate long positions.
A strong candidate for structural shifts if tapped.
⚙️ TRADE SETUPS (SMC-Driven Execution)
✔️ SELL SETUP 1 – Premium Rejection
Entry: 4148–4146
Stoploss: 4154
TP1: 4135
TP2: 4120
TP3: 4090
Logic: Sweep of BSL + FVG fill → high confidence bearish rejection.
✔️ SELL SETUP 2 – Intraday Scalp Sell
Entry: 4068–4071
Stoploss: 4077
TP1: 4055
TP2: 4043
TP3: 4032
Logic: Engineered liquidity sweep above mid-range → fast downside move.
✔️ BUY SETUP 1 – Scalping Rebound
Entry: 4032–4030
Stoploss: 4024
TP1: 4048
TP2: 4068
Logic: SSL sweep → immediate bounce expected from discount zone.
✔️ BUY SETUP 2 – Deep Discount Buy
Entry: 3996–3994
Stoploss: 3988
TP1: 4010
TP2: 4035
TP3: 4068
Logic: A strong institutional accumulation area → ideal for reversal setups.
🧠 SESSION PLAN & NOTES
Do not trade inside the mid-range
Stick strictly to liquidity extremes for precision entries
Expect London fake-outs → wait for confirmation
NY session more likely to deliver the real move
Use M5/M15 CHoCH + displacement for entry confirmation
🏁 CONCLUSION
XAUUSD is currently holding a mild bearish structure on H1, with premium zones at 4146 and 4071 offering the best sell opportunities.
Discount areas at 4030 and 3994 remain the highest-probability zones for intraday reversals or continuation buys.
Trade with patience. Let the liquidity traps form—then strike with precision.
Commodities

Brian – Gold Money Flow Map for the US Session TodayBrian – Gold Money Flow Map for the US Session Today
Technical analysis – trendline, FVG, and two clear scenarios
On H4, gold is still maintaining a medium-term uptrend line drawn from the end of October. The decline in the Asian session this morning was not strong enough to break the structure; the price touched the trendline and then bounced up, indicating that the sellers have not yet "crushed" this support area.
Current structure: The price is accumulating around the 4,050–4,080 area in a sideways candle cluster, lying on the uptrend line and above the 4,000 support.
Above, the 4,120–4,170 area is an FVG + important supply zone; higher is a larger FVG around 4,280–4,330 – if "filled," it is a potential area for a strong profit-taking move.
Below, the 4,000 mark is a key support; losing this mark, the price could quickly slide to the 3,884 area – marked on the chart as the level confirming a medium-term downtrend if breached.
Until 4,000 is broken, I consider this an accumulation area with a high possibility of "fake breaks" on both sides – so prioritize trading according to the trendline, not guessing tops and bottoms in the noise area.
Key levels
Resistance / sell zone: 4,100–4,110: buy confirmation zone, if rejected will become short-term supply
4,170–4,173: FVG / supply, medium-term short zone
4,280–4,330: large FVG above
Support: 4,048–4,050: trendline + intraday breakout zone
4,022–4,005: next support if the price slides off 4,040
4,000: psychological and structural support
3,884: final support; breaking down will confirm a medium-term downtrend
Trade scenarios (for reference, not investment advice)
1. Sell break intraday – follow the trend if the trendline breaks
Entry: sell when the price breaks the short trend at 4,048–4,050
SL: 4,056
TP: 4,040 → 4,022 → 4,005
Idea: if the price breaks below the current accumulation cluster and short trendline, I want to follow the initial selling force, targeting the adjacent support area 4,022–4,005. When the order goes right, SL can be moved to BE around 4,040.
2. Sell “premium” – short at the upper FVG zone
Entry: 4,170–4,173
SL: 4,178
TP: 4,160 → 4,145 → 4,122 → 4,100
This is a price zone I consider "beautiful" for medium-term trading if the market gives a deep retracement. FVG + H4 resistance converge; if the price is strongly rejected here, the TPs are successively the lower demand zone and the current range bottom.
3. Buy only after clean breakout – do not rush to catch the bottom
I am only interested in buy orders when the market structure truly confirms:
Trigger: H1/H2 candle closes clearly above 4,100
Entry: buy right around 4,100 after breakout
SL: 4,092
TP: medium-term towards the 4,145 → 4,170 → 4,230+ depending on momentum
This scenario considers 4,100 as the "exit door" from the current accumulation area. If this area holds as new support, buyers will have a clearer advantage and the money flow could push the price up to gradually fill the upper FVGs.

Gold Trading Strategy for 500 Pips!Hey traders,
As we roll into a brand-new week, gold is showing some impressive stability. XAUUSD is hanging right around the 4,050-dollar mark, and despite the quiet price action, there’s a lot happening beneath the surface that’s worth paying attention to.
The market right now is in “wait-and-see” mode as everyone watches the Federal Reserve’s next moves. Over the past few days, expectations have started to shift—more traders believe the Fed may slowly pivot toward a softer stance and potentially move closer to cutting rates by the end of the year. Because of that, bond yields have been drifting lower, the dollar is losing some of its strength, and demand for safe-haven assets like gold is starting to rise again. All of these elements together create a strong backdrop for potential upside in the short term.
On the technical side, XAUUSD is tightening inside a clean triangle structure, and for those who follow price action closely, you know what that usually means: the market is building pressure. When price consolidates this way, it often sets the stage for a strong breakout. If buyers can push through the upper boundary of this triangle, the next logical target sits up near the 4,500-dollar zone — right in line with the momentum we saw during the last bullish move.
How about you? What’s your take on this setup? Are you leaning toward another leg up, or do you think the market is prepping for a pullback first?
Wishing you a great week of trading—focused, confident, and full of solid opportunities.

Gold Stuck Between 4050-4100. Now What?Gold price is currently trading in classic range-bound behavior on the daily timeframe, with price action consolidating between the 4050-4100 area (On closing basis ) as marked by the rectangle on the chart.
Based on the current technical setup, I'm anticipating continued consolidation for approximately 6-7 weeks from this point. However, this isn't likely to be a simple sideways move the consolidation is expected to carry a bearish undertone, meaning we may see more pressure toward the lower end of the range during this period.
after mid-January, conditions appear favorable for a fresh buying rally to develop. This consolidation phase may simply be the market gathering momentum for the next leg higher, allowing for profit-taking and position adjustments before the next bullish impulse.
While range trading can be tempting during consolidation phases,., buying on dips remains the more favorable approach.

Gold Reaches Exhaustion Zone — Sell Momentum LoadingGold Reaches Exhaustion Zone — Sell Momentum Loading
Gold is showing signs of upside exhaustion, with price repeatedly failing to gain momentum as it approaches the mid-range premium zone near the 4,245 area. The recent structure reflects a market transitioning from short-term recovery into renewed weakness, with each bullish attempt losing strength faster than the previous one.
Order flow remains dominated by distribution behaviour, and the chart signals a potential liquidity sweep followed by a bearish continuation. The projected rejection zone suggests that buyers are running into an area of heavy supply, where institutional activity has previously triggered aggressive downside extensions. Volume distribution across the range also highlights diminishing demand at higher prices, reinforcing the likelihood of a downward rotation.
As the market continues to respect its broader range ceiling, the probability increases for price to revisit deeper value regions. With momentum fading and the current leg showing hesitation, gold is positioned for a potential sell-side move toward lower mean-reversion levels.

Gold Nonfarm: Buy OB 4030, Target Break 4111🔍 Market Context – November 20, 2025
Gold initially dropped nearly 70 pips at the start of the day but quickly rebounded sharply from the 4030–4032 zone, demonstrating strong buying pressure and a refusal to decline further.
The market structure on the H1–H2 timeframe is forming a classic, well-defined Inverse Head & Shoulders pattern—a quintessential bullish reversal pattern—signaling a potential upward expansion if the neckline is successfully broken.
📅 Key News Events Today:
🇺🇸 Non-Farm Payrolls (NFP)
📉 US Unemployment Rate
🏛 FOMC Meeting Minutes
🗣 Speeches by Trump, Barkin, Williams
🧾 Initial Jobless Claims
⚠️ These events could trigger sharp volatility and will determine the confirmation or rejection of the reversal pattern.
📊 Technical Analysis
🛒 BUY SETUP – Primary Priority
✅ Entry: 4030 – 4032
🛡 Stop Loss (SL): 4027
🎯 Take Profit (TP):
TP1: 4039
TP2: 4047
TP3: 4059
💡 Rationale: Price bounced strongly at the OB + SSS zone. This is a crucial technical support area and the base of the Inverse H&S pattern. The objective is to break the neckline to trigger the uptrend.
🔻 SELL SETUP – Short-Term Strategy
📍 Entry: 4093 – 4095
🛡 SL: 4098
🎯 TP:
TP1: 4088
TP2: 4077
TP3: 4060
TP4: 4033
💡 Rationale: This strategy is only applicable if the price forms a false breakout of the BSL zone and reverses. This is an ideal entry point for quick scalping if the market reacts negatively to the news.
🔑 Key Price Zones
Buy Zone (OB + SSS): 4030 – 4032
→ Strong demand zone, the base of the Inverse Head & Shoulders pattern, confirming the reversal signal if held.
Breakout Neckline Zone: 4101 – 4111
→ The neckline of the Inverse H&S pattern. Breaking this zone will open up opportunities for a sharp rise.
Final Resistance Zone: 4133 – 4140
→ The final target if the breakout is successful and the bullish pattern is confirmed.
✅ Strategy Conclusion
🎯 Main Strategy: Priority is to BUY in the OB zone 4030–4032.
🩸 SELL is only for short-term scalping if there is a signal of rejection at the BSL zone.
🕓 Caution: Be careful entering trades near the Nonfarm news release time—wait for price action to confirm the direction.

Gold is stuck in a wide range, ready for a decisive break.Good evening traders, Brian here with a fresh look at gold on the 2-hour chart.
Price is compressing in a broad sideways range, building energy for the next leg – the break from this structure will set the tone for the coming sessions.
Fundamental analysis
The core driver remains the Fed’s December decision. The market is effectively split on whether we see a cut or a delay:
A camp of institutions argues that rising unemployment and softer data could still justify a 25-basis-point cut in December, keeping pressure on the dollar and supporting gold on dips.
Others point out that the Fed is short of clean, up-to-date data and may prefer to wait until next year before committing to an easing cycle.
As a result, pricing for a December cut is roughly “fifty–fifty” and highly sensitive to the next run of labour-market and activity data.
In short: the macro backdrop is undecided, so intraday direction will be driven mainly by levels and liquidity until the next data catalyst hits.
Technical analysis
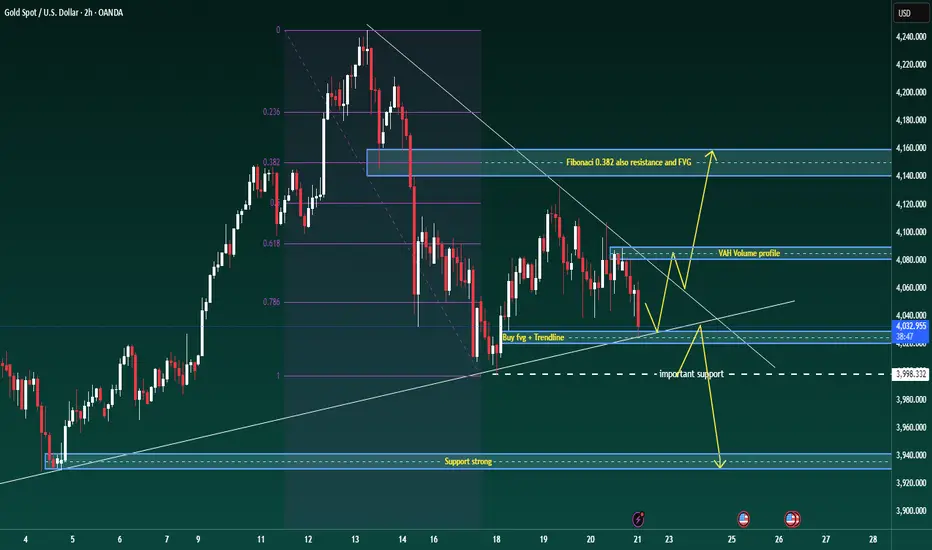
On the H2 chart, gold is in a broad consolidation after the recent sell-off:
Price is trading inside a descending structure, repeatedly respecting the short-term trendline from the recent high.
The Fibonacci retracement of the latest impulse shows the 0.382 level lining up with a prior fair-value gap and horizontal resistance – this forms a key rejection zone overhead.
Below price, there is a confluence of support where the rising trendline meets a small bullish FVG around 4027–4029, followed by a more important horizontal support band near 3998.
The volume profile highlights a Value Area High (VAH) around 4075–4080, which is likely to act as a reaction zone if price rotates back into it.
Until we break convincingly out of this structure, I treat it as a large accumulation range with a slight downside bias: sellers are still defending lower highs, but buyers are stepping in aggressively at trendline support.
Key levels
Resistance zones:
4080–4085 (VAH / short-term supply)
4135–4145 (Fibonacci 0.382 + FVG + structural resistance)
Support zones:
4027–4029 (trendline + FVG confluence buy area)
3995–4000 (important horizontal support)
3940 region (deeper support if the range finally breaks down)
Trade scenarios
1. Primary long – buy the trendline/FVG confluence
Entry: 4027–4029
Stop: 4023
Targets: 4035 – 4050 – 4068 – 4080
Idea: look for price to react at the rising trendline where it overlaps with the small FVG. A clean rejection candle or shift in intraday order flow from that zone sets up a rotation back towards the VAH and potentially the upper boundary of the range.
2. Break-and-retest short – if the trendline fails
Trigger: clear H1/H2 close below the rising trendline and the 4027 area
Plan: wait for price to retest the underside of the broken trendline / prior support
Entry: on rejection of that retest
Initial targets: 4000, then 3940 if momentum accelerates
This scenario treats any breakdown as a structural shift, using the retest as a lower-risk point to join the move rather than chasing the first leg.
3. Intraday scalp zones
These are discretionary, short-term opportunities for active traders:
Reaction sells: around 4085, and higher up if we spike into the 4135–4145 resistance band. Look for exhaustion or rejection patterns back into the range (potential targets 4060 then 4033).
Reaction buys: into 3998–4000 if we see a liquidity sweep below the current range, with tight stops and quick profit-taking back towards the mid-range.
Gold at a Crossroads: Up or Down?If we zoom in and carefully observe how the GOLD price is moving, it becomes immediately clear:
The market has just shown a very strong upward impulse, but now something interesting is happening. The price is tightening and forming a small, narrow triangle, which indicates that the market is accumulating energy. In these situations, there are usually two possible directions, but given the clearly bullish context, I feel that a breakout to the upside is much more likely.
What do you think? Do you agree with me?
Leave your thoughts in the comments. And trust me, being part of the TradingView community will help you improve every day as a trader.
Of course, this is not financial advice, just my personal view on the chart.

Gold H1 – Is This Just a Range or a Break Incoming?🟡 XAUUSD – Intraday Smart Money Plan | by Ryan_TitanTrader (21/11)
📈 Market Context
Gold continues to trade inside a compressed intraday range as markets react to the latest discussion on whether the Federal Reserve is likely to cut interest rates anytime soon.
According to new reports, policymakers remain cautious, and early rate-cut expectations are fading as inflation progress slows.
This shift pushes USD stronger, increases Treasury yields, and temporarily weakens gold’s bullish momentum.
Key takeaways from the news:
• Fed officials note that inflation is “still not where it needs to be,” reducing the probability of early rate cuts.
• Markets have scaled back expectations for a Q1 cut, keeping USD supported.
• Higher yields → tighter financial conditions → gold struggles to break premium levels.
• Institutions are likely engineering liquidity grabs on both sides before committing to a new directional move.
Price is currently sitting near the 4030–4045 zone, right above discount liquidity, waiting for a catalyst to break out of the short-term compression.
🔎 Technical Analysis (1H / SMC Structure)
• Market Structure:
Gold has completed a clear CHoCH + short-term bearish sequence and is now compressing into the discount zone around 4030.
• Premium Sell Zone (4H Supply):
4128–4130 aligns with unmitigated supply + buy-side liquidity resting above internal highs.
• Discount Buy Zone:
4030–4028 sits inside the last clean demand zone where a previous sweep occurred.
• Liquidity Map:
→ Buy-side liquidity: above 4128–4135
→ Sell-side liquidity: below 4028–4020
Institutions are likely to sweep one side before delivering direction.
🔴 Sell Setup (Premium Reaction Zone)
• Entry: 4128 – 4130
• Stop-Loss: 4140
• Take-Profit:
→ 4080 (minor imbalance fill)
→ 4045 (range EQ)
→ 4030–4028 (discount demand retest)
📌 Execution rule: Wait for liquidity sweep into the zone + bearish CHoCH on M5–M15 before entering.
🟢 Buy Setup (Discount Reaction Zone)
• Entry: 4030 – 4028
• Stop-Loss: 4020
• Take-Profit:
→ 4060 (short-term reaction level)
→ 4095 (inefficiency fill)
→ 4120 (premium retest)
📌 Valid only if price sweeps the 4030–4028 pocket and shows bullish displacement from discount.
⚠️ Risk Management Notes
• USD strength may spike unexpectedly as rate-cut bets fade — reduce position size during volatility.
• Avoid trading inside the 4045–4085 chop zone unless a clean structure break forms.
• Manage trades aggressively once liquidity levels are taken.
• Expect engineered manipulation during low-volume Asian hours.
📝 Summary
Gold is compressing inside a narrow intraday range as markets reassess the likelihood of Fed rate cuts.
SMC structure suggests a two-sided liquidity sweep before a decisive move:
• Sell Zone: 4128–4130 (premium supply)
• Buy Zone: 4030–4028 (discount demand)
Expect classic accumulation → sweep → displacement patterns until macro conditions create a new trend.
📍 Follow @Ryan_TitanTrader for more Smart Money updates.

XAUUSD – Where Smart Money Strikes Today🌐 MARKET CONTEXT
Gold enters today’s session after a period of controlled volatility, with price repeatedly reacting around key liquidity pockets but failing to produce a clean breakout. The M30 structure remains bearish, with price rejecting premium levels and forming consistent lower highs.
Recent Drivers
USD stays firm as markets maintain expectations of a slightly hawkish Federal Reserve
Traders await upcoming mid-week data → low conviction, cautious positioning
Overall sentiment remains neutral — no strong safe-haven pressures
Session Outlook
London Session: Likely to engineer early sweeps into premium supply zones
New York Session: Higher chance of real directional expansion
Bias: Bearish intraday until discount zones trigger a CHoCH (shift of character)
Price is currently inside mid-range, so the safest setups remain at extremes where liquidity is concentrated.
📉 TECHNICAL ANALYSIS (SMC + LIQUIDITY)
Market Structure
M30 Trend: Lower High → Lower Low sequence
Equilibrium zone: 4068–4085
Inducement layers resting above 4147 and 4081
Liquidity Levels
BSL: Above 4147 & 4081
SSL: Below 4033 & deep liquidity at 3993
Market continues printing engineered wicks, trapping impulsive traders
Imbalances
Bearish FVG: 4147–4148 → perfect for premium scalp sells
Minor imbalance: 4081
Discount inefficiencies near 4033 and 3993 → ideal buy setups
🔑 KEY PRICE ZONES (Strong Logic + Clear Explanation)
4148–4147 ▶️ Premium Liquidity Trap – High-Quality Sell Zone
This area holds an unmitigated bearish order block combined with buy-side liquidity.
Smart Money typically uses this zone to trap breakout buyers before reversing sharply.
4079–4081 ▶️ Secondary Premium Sweep Zone – Fast Rejection Expected
A mini liquidity pool just above equilibrium, designed for early-session stop hunts.
Often triggers sharp intraday reversals.
4035–4033 ▶️ Discount Reaction Zone – Clean Scalping Demand
This zone holds micro-demand + SSL resting below.
Expect low-drawdown reactions ideal for quick intraday buys.
3995–3993 ▶️ Deep Discount Liquidity Pool – High-Probability Reversal Base
A rich accumulation of Sell-Side Liquidity combined with HTF discount structure.
Strong reversal potential if price reaches this level.
⚙️ TRADE SETUPS (High-Precision SMC Execution)
✔️ SELL SETUP 1 – Premium Rejection Sell
Entry: 4148–4147
Stoploss: 4126
TP1: 4135
TP2: 4120
TP3: 4085
Logic: BSL sweep + bearish imbalance fill → sharp sell-off expected.
✔️ SELL SETUP 2 – Mid-Range Liquidity Sweep
Entry: 4079–4081
Stoploss: 4087
TP1: 4065
TP2: 4048
TP3: 4033
Logic: Quick liquidity hunt above equilibrium followed by displacement.
✔️ BUY SETUP 1 – Intraday Scalping Rebound
Entry: 4035–4033
Stoploss: 4027
TP1: 4048
TP2: 4070
Logic: SSL sweep → micro CHoCH → ideal for fast bullish reaction.
✔️ BUY SETUP 2 – Deep Discount Reversal
Entry: 3995–3993
Stoploss: 3987
TP1: 4010
TP2: 4040
TP3: 4070
Logic: Major discount zone + liquidity buildup → strong reversal potential.
🧠 NOTES / SESSION PLAN
Avoid mid-range trading — only trade at liquidity extremities
Expect London fake-outs; real movement likely in NY
Always wait for M5/M15 confirmation (CHoCH + BOS)
Avoid buying in premium areas; avoid selling in deep discount zones
Follow strict risk management — volatility may spike unexpectedly
🏁 CONCLUSION
Gold continues to hold a bearish intraday structure, favouring premium sell setups at 4147 and 4081.
Discount zones at 4033 and 3993 offer high-probability buy reactions and possible deeper reversals.
Trade with patience. Execute only at liquidity extremes.
Let Smart Money show its trap — then strike with precision.

Gold XAUUSD – Fresh Resistance Tested Twice, Bears Eye 4057 PullGold gave us a clean reaction today, rejecting the 4107–4110 supply zone not once, but twice. That double tap reinforced a fresh resistance band at 4087–4095, where sellers stepped back in with intention.
As long as 4012 holds on the upside, this resistance zone remains my short-term line in the sand. Any push back into 4087–4095 may attract renewed selling pressure, keeping the door open for a move toward 4057, with momentum potentially extending lower if sellers stay in control.
I’ll be watching how price behaves on each revisit—structure remains king.
Your feedback drives our content and keeps everyone trading smarter. Let’s make those pips together! 🚀
Happy Trading,
– The InvestPro Team

The Gold Bullish Setup You Can't Miss!OANDA:XAUUSD The price is clearly approaching a critical support zone, one that has previously triggered positive reactions in the market. This zone also aligns closely with the psychological level of $4,000, which tends to capture the market’s full attention.
Given the current momentum, there’s a strong possibility that buyers will step in and push prices higher. A confirmation, such as a solid rejection pattern, a bullish engulfing candle, or a long lower shadow, would significantly increase the likelihood of a rebound. If my analysis proves accurate, and buyers regain control, we could see the price rise to around $4,070.
However, if the price breaks below this key support, it would negate the bullish outlook and could lead to further declines.
Please note, this is not financial advice!

XAUUSD – Battle Zones of the Day🌐 MARKET CONTEXT
Gold enters today’s session after a period of compressed volatility, where price tapped both buy-side and sell-side liquidity several times without forming a decisive trend. On the M30 chart, the intraday structure remains bearish, with price consistently rejecting premium levels and forming lower highs.
Recent Catalysts:
USD holds mild strength following a slightly hawkish tone from the Federal Reserve
Market is awaiting mid-week economic releases → leading to a cautious sentiment
Risk appetite remains neutral with no strong safe-haven flows
Session Expectations:
London Session: Likely to generate early liquidity sweeps towards premium zones
New York Session: Higher probability of seeing genuine directional expansion
Bias: Bearish intraday unless price reaches discount zones and forms a CHoCH
Price is currently trading within mid-range levels, making the extreme liquidity zones the safest points for execution.
📉 TECHNICAL ANALYSIS (SMC + LIQUIDITY STRUCTURE)
Market Structure
M30 structure: Lower Highs → Lower Lows
Equilibrium zone: 4075–4085
Inducement layers accumulating above 4147 and 4070
Liquidity
BSL: Above 4147 & 4070
SSL: Below 4033 and the deeper pocket at 3993
Market forming engineered liquidity wicks on both sides
Imbalance Zones
Bearish FVG: 4147–4148 → strong scalp sell zone
Minor imbalance: 4070–4071
Discount imbalances: 4033 and 3993 support buy setups
🔑 KEY PRICE ZONES (Clear & Attractive Explanations)
4148–4147 → Premium Liquidity Trap – Ideal Scalp Sell
A premium zone combining an unmitigated bearish order block and BSL inducement.
This area often triggers breakout buyers before institutions reverse the move.
4071–4070 → Secondary Premium Liquidity – Fast Rejection Zone
A small liquidity pool above equilibrium designed to sweep early highs before price turns bearish again.
4035–4033 → Discount Reaction Zone – Scalping Demand
A micro order block aligned with a cluster of sell-side liquidity.
Provides clean, low-drawdown intraday rebounds.
3995–3993 → Deep Discount Liquidity Pool – High-Value Reversal Zone
A major liquidity pocket aligned with higher-timeframe discounts.
If price reaches here, a strong reversal is highly probable.
⚙️ TRADE SETUPS (SMC-Driven, High Precision)
✔️ SELL SETUP 1 – Premium Scalp
Entry: 4148–4147
Stop-loss: 4126
Targets: 4135 → 4120 → 4085
Logic: BSL sweep + FVG fill leading to strong bearish rejection.
✔️ SELL SETUP 2 – Mid-Range Liquidity Sweep
Entry: 4071–4070
Stop-loss: 4077
Targets: 4058 → 4043 → 4033
Logic: Sweep of mini BSL followed by downward displacement.
✔️ BUY SETUP 1 – Intraday Rebound
Entry: 4035–4033
Stop-loss: 4027
Targets: 4048 → 4070
Logic: SSL sweep with potential for a micro CHoCH → clean bounce setup.
✔️ BUY SETUP 2 – Deep Discount Reversal
Entry: 3995–3993
Stop-loss: 3987
Targets: 4010 → 4040 → 4070
Logic: Strong higher-timeframe discount zone → excellent reversal potential.
🧠 NOTES / SESSION PLAN
Avoid trading in mid-range areas — only execute at the extreme liquidity zones
Expect fake movements during London open
New York session likely provides the main trend direction
Wait for M5/M15 confirmation signals (CHoCH + BOS)
Avoid buying around premium levels to stay clear of liquidity traps
🏁 CONCLUSION
XAUUSD continues to hold a bearish intraday structure, favouring premium-zone sell opportunities at 4147 and 4070.
Discount-zone levels at 4033 and 3993 remain high-probability areas for intraday bounces or deeper reversals.
Trade only at liquidity extremes.
Be patient.
Let the market form the trap — and then strike with precision.

Gold H1 – Sideway or Preparing for a Bigger Break?🟡 XAUUSD – Intraday Smart Money Plan | by Ryan_TitanTrader (20/11)
📈 Market Context
Gold continues to move inside a tight consolidation as markets digest fresh headlines:
Treasury markets just erased hopes for a December rate cut and now even a January cut is doubtful, following hawkish tones revealed in the latest Fed minutes.
This shift reinforces USD strength in the short term and pressures gold’s bullish momentum, keeping price trapped between well-defined liquidity zones.
Key implications from the news:
• The 6-month Treasury yield jumped back to 3.83%, aligning with hawkish expectations.
• Rate-cut bets evaporating → USD stays firm, limiting gold’s upside.
• Institutions are engineering both-side liquidity sweeps ahead of upcoming Fed speakers.
• Gold is currently hovering around ~$4,070 inside a neutral zone where no clean premium/discount imbalance exists.
Until the market receives fresh macro catalysts, price is likely to sweep liquidity at the edges of the range before choosing direction.
🔎 Technical Analysis (1H / SMC Structure)
• Structure: Price remains inside a short-term sideways distribution after the recent CHoCH + BOS sequence.
• Premium Sell Zone: 4145–4147, aligning with unmitigated supply + buy-side liquidity resting above recent highs.
• Discount Buy Zone: 4004–4002, sitting inside last clean demand with previous sell-side sweep.
• Liquidity Map:
→ Buy-side liquidity: above 4145–4150 (equal-high cluster).
→ Sell-side liquidity: below 4004–3997, where earlier long positions were cleared.
🔴 Sell Setup (Premium Reaction Zone)
• Entry: 4145 – 4147
• Stop-Loss: 4155
• Take-Profit:
→ 4085 (minor imbalance)
→ 4045 (range midpoint)
→ 4004 – 4002 (discount demand)
📌 Execution rule: Wait for liquidity sweep into zone + bearish CHoCH M5–M15 before entering.
🟢 Buy Setup (Discount Reaction Zone)
• Entry: 4004 – 4002
• Stop-Loss: 3997
• Take-Profit:
→ 4040 (short-term range high)
→ 4075 (inefficiency fill)
→ 4140 (premium retest)
📌 Valid only if price sweeps the 4000–3997 liquidity pocket and shows strong bullish displacement.
⚠️ Risk Management Notes
• Expect increased volatility as markets reposition after the sharp decline in rate-cut expectations.
• Avoid trading inside the 4030–4080 chop zone unless a clear structure break occurs.
• Reduce risk size during sudden USD spikes caused by Treasury-yield moves.
• Trail stops progressively as each liquidity level is taken.
📝 Summary
Gold is currently stuck in a clean intraday range as hawkish Fed minutes remove hopes for early rate cuts, pushing USD up and holding gold below premium supply.
SMC structure favors liquidity-sweep setups at both edges:
• Sell Zone: 4145–4147 (premium supply)
• Buy Zone: 4004–4002 (discount accumulation)
Expect classic manipulation → reaction → continuation patterns until the market resolves the new macro pressure.
📍 Follow @Ryan_TitanTrader for more Smart Money updates.

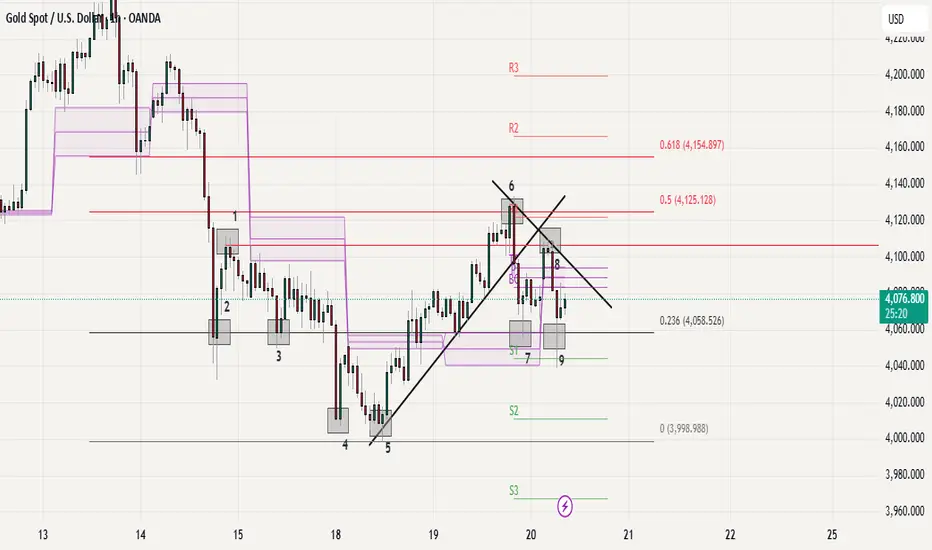
Gold Current Price Action Structure Looking weak under 6 and 8||
Support at 7 and 9, more correction under these POI.//
to go bullish need to claim /breakout on 6//
major support / Demand at 4 and 5//
Overall sentiments as per structure is correction /bearish for short term .
Cup and Handle Detected: A Bullish Outlook for XAUUSDOANDA:XAUUSD is forming a very clear Cup and Handle pattern. Price previously dropped toward the 4000 region, rounded out, and then climbed back toward 4080, completing the cup structure. At the moment, the market is making a mild pullback and shaping a tight and well controlled handle.
If price can break this resistance with strong momentum, the next target I expect is around 4150. Until a confirmed breakout appears, patience remains essential. No breakout means no trade.
This is a classic bullish formation, and market expectations are gradually strengthening.

XAUUSD: Likely continuation following pullbackXAUUSD has surged into a strong uptrend, and I predict that this momentum will continue, with a potential target around 4,150, as shown on my chart.
The current price level may be a critical turning point. Here, the price could find support and continue to rise, or if it breaks below, we might see an extension of the downward trend.
If I had to choose a direction, I would lean towards more upside, but the final decision should be based on price action to determine the next move.
However, if the price breaks decisively below the trendline, it would invalidate the bullish scenario, indicating that the uptrend could pause or even reverse in the short term.
These are just my personal views based on chart analysis, not financial advice. Always verify your setups and manage your risk carefully.

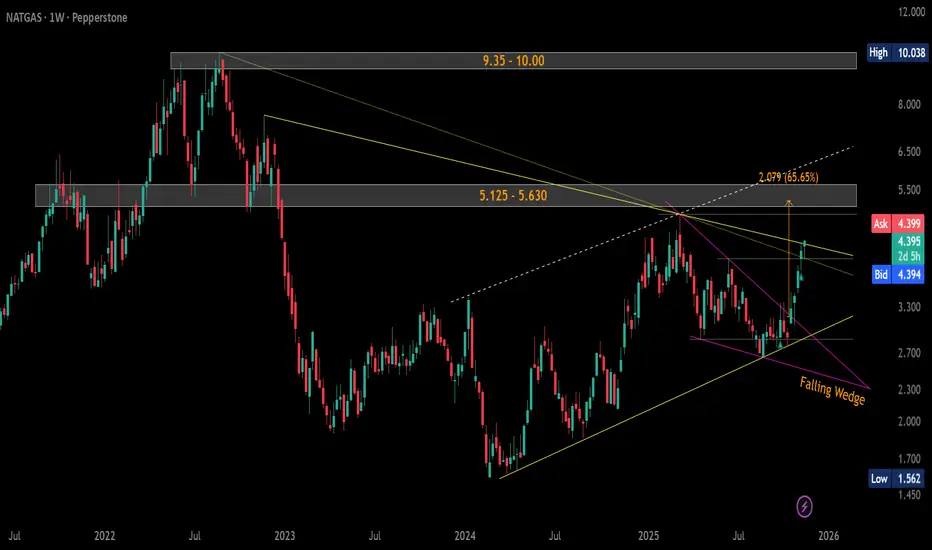
#NaturalGas ($NG) Weekly Update — Trading at Breakout ZoneCMP: $4.400
+54% from suggested levels and +58% from lows. 🚀
Price trading in the key resistance zone $4.339–4.417.
WCB > $4.417 = Symmetrical Triangle breakout → Falling Wedge target: $5.246 🎯
🛡 Supports: $4.067 / $3.803 / $3.625–$3.572
🚧 Major Resistances:
• ST: $5.125–$5.630
• LT: $9.35–$10.00
Tight structure… breakout looks close. 🔥
#NG VANTAGE:NG #NaturalGas #Commodities #PriceAction #SymmetricalTriangle #FallingWedge #ChartPatterns #Breakout
📌 #Disclaimer: This analysis is shared for educational purposes only. It is not a buy/sell recommendation. Please do your own research before making any trading decisions.
Gold 30-Min Chart: Sellers Active Near Resistance!Gold is once again testing its falling resistance trendline, which has already rejected the price several times in recent sessions. Each time the price touches this trendline, selling pressure increases, showing how strong this resistance zone is.
Currently, the price is near $4070–$4080, where short-term traders should stay alert. If the price fails to break above this resistance, a pullback toward the $4000–$3980 support zone looks likely. This area has previously acted as a strong demand zone, where buyers may re-enter.
However, if Gold breaks and sustains above this trendline resistance, we could see a fresh upside momentum building up toward $4115–$4135 levels. For now, the structure looks weak near resistance, and traders should wait for a clear breakout or rejection confirmation before taking any position.
Disclaimer: This analysis is for educational purposes only and should not be taken as financial advice. Please do your own research or consult your financial advisor before investing.
Analysis By @TraderRahulPal | More analysis & educational content on my profile.
If you found this helpful, don’t forget to like and follow for regular updates.

GOLD H1 – Trump’s Fed Comments Shake Market Sentiment🟡 XAUUSD – Intraday Smart Money Plan | by Ryan_TitanTrader (19/11)
📈 Market Context
Gold is trading in a tight corrective structure as markets react to breaking headlines that Donald Trump is considering removing Fed Chair Jerome Powell.
This news injects uncertainty into Fed policy expectations, causing short-term volatility in USD and positioning gold at a critical decision zone.
• Trump’s comments increase speculation about a potential policy shift, which may temporarily weaken USD sentiment.
• However, gold remains capped below the premium supply zone as institutional flows continue to engineer liquidity sweeps.
• Price is hovering near $4,080 ahead of key Fed-related discussions, keeping both sides of liquidity active.
Institutional order flow suggests controlled accumulation at the discount range while premium regions remain defended by sellers.
🔎 Technical Analysis (1H / SMC Structure)
• Structure: Price is forming a short-term distribution pattern after multiple BOS events from the 4150 breakdown.
• Premium Sell Zone: 4109–4111, aligning with unmitigated supply and internal liquidity pockets.
• Discount Buy Zone: 4009–4007, sitting inside a clean demand block + previous sell-side sweep.
• Liquidity:
→ Buy-side liquidity sits above 4111, where equal-high clusters form.
→ Sell-side liquidity rests between 4007–4000, where earlier long positions were cleared.
🔴 Sell Setup (Premium Reaction Zone)
• Entry: 4109 – 4111
• Stop-Loss: 4119
• Take-Profit:
→ 4055 (minor inefficiency)
→ 4028 (BOS retest)
→ 4009–4007 (discount demand)
📌 Execute only after a liquidity sweep into the zone + bearish CHOCH on M5–M15.
🟢 Buy Setup (Discount Reaction Zone)
• Entry: 4009 – 4007
• Stop-Loss: 4000
• Take-Profit:
→ 4040 (short-term range high)
→ 4075 (inefficiency rebound)
→ 4105/4110 (premium retest)
📌 Valid if price sweeps 4007 and shows bullish displacement.
⚠️ Risk Management Notes
• Expect volatility as traders react to Trump’s comments on Fed leadership.
• Avoid trading in the 4030–4080 chop zone without a clear structural break.
• Reduce position size during impulsive spikes around USD sentiment shifts.
• Trail stops once price clears each liquidity pocket.
📝 Summary
Gold is being influenced heavily by uncertainty around Trump’s remarks about replacing Fed Chair Powell. Liquidity is building at both extremes, offering clean opportunities at the edges of the range.
• Sell Zone: 4109–4111 (premium supply)
• Buy Zone: 4009–4007 (discount accumulation)
Expect a manipulation → reaction → continuation pattern as institutions play both sides of the current structure.
📍 Follow @Ryan_TitanTrader for more Smart Money updates.
🎁 Gifts in BIO for traders who follow daily plans.

XAUUSD | Bulls Hold Control Above 4070 - Eyes on 4090–4100 ZoneGold (XAUUSD) continues to show strong bullish structure, and price action above the 4070 key support reinforces buyers’ dominance.
If price sustains above this level, the next upside liquidity area sits at 4090–4100 , a zone where previous reactions have occurred.
Bullish Scenario:
Holding above 4070 keeps momentum pointed toward 4082 and then the 4090 zone.
The bullish outlook remains valid as long as price stays above 4059, which currently acts as intraday invalidation.
What I’m Watching:
A clean intraday consolidation above 4070
Momentum strength into 4082
Whether buyers can break into the 4090–4100 resistance pocket
This setup highlights how the market could behave, not financial advice—just educational analysis.
📌 Disclaimer:
This analysis is for educational purposes only and is not financial advice. Always manage risk and follow your trading plan.
Your feedback drives our content and keeps everyone trading smarter. Let’s make those pips together! 🚀
Happy Trading,
– The InvestPro Team

GOLD H1 – Hawkish Fed Pressure Ahead of Key NFP Data🟡 XAUUSD – Intraday Smart Money Plan | by Ryan_TitanTrader (18/11)
📈 Market Context
Gold is trading inside a bearish corrective channel as markets react to hawkish Federal Reserve commentary and positioning ahead of this week’s U.S. NFP data.
• Fed officials signaled a stronger stance against premature rate cuts, keeping USD supported and limiting gold’s upside.
• Price continues to hover near $4,080, reflecting uncertainty as traders balance Fed tone with upcoming labour-market reports.
Institutional order flow shows controlled downside pressure, with engineered liquidity sweeps forming around both channel extremes.
🔎 Technical Analysis (1H / SMC Structure)
• Structure: Price remains inside a Bearish Correction Channel, creating consecutive BOS points, confirming distribution.
• Premium Sell Zone: 4107–4105 aligns with a previous mitigation block + internal liquidity.
• Discount Buy Zone: 3983–3985 sits at the lower boundary of the channel + liquidity sweep zone.
• Liquidity:
→ Buy-side liquidity above 4107 (clean equal-high pocket).
→ Sell-side liquidity resting around 3985–3976, where prior long positions were removed.
🔴 Sell Setup (Premium Reaction Zone)
• Entry: 4,107 – 4,105
• Stop-Loss: 4,117
• Take-Profit Targets:
→ 4,060 (minor imbalance fill)
→ 4,030 (BOS retest)
→ 3,985 (discount zone)
📌 Execute only after a liquidity sweep into the zone + bearish BOS on M5–M15.
🟢 Buy Setup (Discount Reaction Zone)
• Entry: 3,983 – 3,985
• Stop-Loss: 3,976
• Take-Profit Targets:
→ 4,030 (short-term structure high)
→ 4,060 (inefficiency midpoint)
→ 4,105 (premium retest)
📌 Valid if price taps channel low + shows bullish displacement.
⚠️ Risk Management Notes
• Expect volatility as markets digest hawkish Fed remarks before NFP.
• Avoid entering trades inside the 4020–4070 chop region without clear BOS.
• Reduce position size during news hours.
• Trail stops once price clears each liquidity pocket.
📝 Summary
Gold remains pressured by Fed rhetoric, but liquidity is building at both extremes.
• Sell Zone: 4107–4105 (premium mitigation area)
• Buy Zone: 3983–3985 (discount liquidity sweep)
Price is likely to form a manipulation → reaction → continuation pattern within the channel.
📍 Follow @Ryan_TitanTrader for more Smart Money updates ⚡
🎁 More insights & gifts on my TradingView profile.

Pressured Below 4050$ as Bears Target the 4,000$ Liquidity BreakGold continues to trade under heavy selling pressure, staying capped beneath 4,050$ and hovering just above the major liquidity floor at 4,000$.
With fading expectations for a December Fed cut and cautious global sentiment, buyers remain defensive while sellers maintain structural control.
📊 Technical Outlook (H1)
Price remains inside a tight 4,053$ → 4,000$ distribution zone, with the descending trendline keeping gold suppressed.
The POC around 4,053$ is acting as a firm ceiling; every retest so far has been rejected.
Fibonacci projections from the last drop highlight two major downside liquidity zones:
3,945$ → first liquidity cluster
3,876$ → deeper extension and key demand
Current structure resembles a bear flag, hinting that the market may be preparing for another downside expansion.
🎯 Key Scenarios
1️⃣ Bearish Breakdown (Primary Scenario)
If gold loses 4,000$, expect momentum to accelerate into:
3,945$
3,876$
This remains the most probable path while price holds below 4,053$.
2️⃣ Liquidity Sweep → Short-Covering Bounce
If price sweeps 3,945$ and forms bullish rejection wicks:
A relief bounce could develop back toward 4,000$,
Then 4,053$ (POC)
And possibly 4,098$ if buyers gain traction.
Still a corrective move unless bulls reclaim the upper structure.
❌ Invalidation (Bearish Bias Weakens)
H4 acceptance above 4,098$
→ would shift the narrative and force a reassessment of trend direction.
⚜️ MMFLOW TRADING Insight
Gold is still trading below value and below the trendline — this is not a bullish environment yet.
The market must either break 4,000$ or reclaim 4,053$–4,098$ before any stronger directional conviction returns.
“Let the market show its hand. In a downtrend, weak rallies are opportunities — not reversals.”
