Commodity Trading: Energy, Metals & Agricultural MarketsCommodity trading involves buying and selling physical goods or their derivative contracts with the objective of profit, hedging risk, or portfolio diversification. Unlike equities (which represent ownership in companies), commodities are tangible assets such as crude oil, gold, wheat, or natural gas. These markets play a critical role in the global economy because commodities are essential inputs for energy production, manufacturing, construction, and food security.
Commodity trading is broadly divided into three major categories:
Energy Commodities
Metal Commodities
Agricultural (Agri) Commodities
Each category has unique drivers, risks, and trading characteristics.
1. Energy Commodity Trading
Energy commodities are among the most actively traded commodities globally. They are highly sensitive to geopolitical events, economic growth, and supply disruptions.
Major Energy Commodities
Crude Oil (WTI & Brent)
Natural Gas
Heating Oil
Gasoline
Coal (limited exchange trading)
Key Market Drivers
Supply & Demand Balance
OPEC+ production decisions
US shale oil output
Refinery capacity
Geopolitical Factors
Middle East tensions
Russia–Ukraine conflict
Sanctions and trade restrictions
Economic Growth
Strong economies increase fuel demand
Recessions reduce consumption
Seasonality
Natural gas demand rises in winter
Gasoline demand peaks during summer travel
Inventory Data
Weekly reports like EIA crude oil inventories
Trading Characteristics
High volatility
Strong trend-following behavior
Heavy participation by institutions, hedge funds, and governments
Prices often react sharply to news and data releases
Trading Instruments
Futures contracts (most common)
Options on futures
Commodity ETFs
CFDs (in some markets)
Energy trading is popular among short-term traders due to sharp intraday movements, but it also attracts hedgers like airlines and oil producers.
2. Metal Commodity Trading
Metals are divided into Precious Metals and Base (Industrial) Metals, each serving different economic purposes.
A. Precious Metals Trading
Major Precious Metals
Gold
Silver
Platinum
Palladium
Key Drivers
Inflation & Interest Rates
Gold performs well during high inflation
Rising interest rates often pressure prices
Currency Movements
Strong US Dollar usually weakens precious metals
Safe-Haven Demand
Economic crises, wars, or market crashes boost demand
Central Bank Buying
Especially important for gold
Trading Characteristics
Gold is relatively less volatile than energy
Silver is more volatile due to industrial usage
Strong correlation with macroeconomic indicators
Gold is often used as a hedge against inflation and currency risk, making it popular with long-term investors as well as traders.
B. Base (Industrial) Metals Trading
Major Base Metals
Copper
Aluminium
Zinc
Nickel
Lead
Key Drivers
Industrial & Infrastructure Demand
Construction
Manufacturing
Electric vehicles and renewable energy
Economic Growth Indicators
GDP growth
PMI data
Supply Constraints
Mining disruptions
Environmental regulations
China’s Demand
China is the largest consumer of base metals
Trading Characteristics
Strongly cyclical
Move with global economic cycles
Copper is often called “Dr. Copper” because it signals economic health
Base metals are ideal for traders who closely follow macro and industrial trends.
3. Agricultural (Agri) Commodity Trading
Agricultural commodities represent soft commodities derived from farming and livestock. These markets are deeply influenced by natural and seasonal factors.
Major Agricultural Commodities
Grains: Wheat, Corn, Rice
Oilseeds: Soybean, Mustard
Softs: Sugar, Coffee, Cotton
Livestock: Live Cattle, Lean Hogs
Key Market Drivers
Weather Conditions
Rainfall, droughts, floods
El Niño and La Niña effects
Crop Reports
USDA acreage and yield reports
Sowing and harvesting data
Seasonality
Planting and harvest cycles
Government Policies
Minimum Support Prices (MSP)
Export/import restrictions
Global Demand
Population growth
Biofuel usage (corn → ethanol)
Trading Characteristics
Often range-bound, except during supply shocks
Highly seasonal
Can experience sudden spikes due to weather news
Agri trading is popular among farmers and food companies for hedging, as well as speculators who understand seasonal cycles.
Commodity Trading Instruments & Markets
Common Trading Instruments
Futures Contracts (primary instrument)
Options on Futures
Spot Markets
ETFs / ETNs
Commodity Mutual Funds
Indian Commodity Exchanges
MCX (Multi Commodity Exchange) – Energy & Metals
NCDEX – Agricultural commodities
Global Commodity Exchanges
CME Group (USA)
LME (London Metal Exchange)
ICE Exchange
Risk Management in Commodity Trading
Commodity markets are volatile, so risk management is critical:
Use stop-loss orders
Proper position sizing
Avoid over-leveraging
Understand contract specifications (lot size, expiry)
Be aware of rollover risks
Professional traders focus more on capital protection than profit chasing.
Advantages of Commodity Trading
Portfolio diversification
Inflation hedge
High liquidity (especially energy & metals)
Opportunities in both rising and falling markets
Risks Involved
High volatility
Leverage risk
Sudden policy or weather-driven shocks
Global geopolitical uncertainty
Conclusion
Commodity trading in Energy, Metals, and Agricultural markets offers diverse opportunities for traders, investors, and hedgers. Energy commodities provide high volatility and strong trends, metals reflect macroeconomic and industrial health, while agricultural commodities are driven by seasonality and weather. Successful commodity trading requires a solid understanding of fundamental drivers, technical analysis, and strict risk management.
When approached with discipline and knowledge, commodities can be a powerful addition to any trading or investment strategy.
Commoditytrading

Introduction to Agricultural Commodities and SoftsAgricultural commodities are raw materials derived from farming and livestock, forming a critical part of global trade and the commodities market. These commodities are primarily categorized into two groups: hard commodities and soft commodities. While hard commodities include natural resources like metals and energy products, soft commodities refer to agricultural products that are grown rather than mined. These include crops like wheat, corn, soybeans, coffee, sugar, cotton, cocoa, and livestock products such as cattle and hogs.
Soft commodities are essential to the global economy because they are fundamental to human consumption, industrial production, and trade. They are also highly sensitive to factors like weather patterns, seasonal changes, geopolitical events, and technological advancements in agriculture. The trading of these commodities forms a critical part of global commodity markets, with futures contracts, options, and spot trading helping farmers, traders, and investors hedge risks or speculate on price movements.
Classification of Agricultural Commodities
Agricultural commodities can be broadly classified into the following categories:
Grains and Cereals:
These are staple foods consumed globally and include wheat, rice, corn, barley, and oats. Grains are essential for food security and are also used in the production of animal feed, biofuels, and processed food products.
Oilseeds and Legumes:
Soybeans, canola, sunflower seeds, and peanuts are major oilseed crops. They are primarily used for producing vegetable oils and animal feed, as well as for industrial purposes. Legumes like lentils and chickpeas are also traded commodities due to their high nutritional value.
Softs:
Soft commodities refer to crops that are typically grown in tropical or subtropical regions and are not staple grains. These include coffee, cocoa, sugar, cotton, tea, and orange juice. Soft commodities are highly influenced by climatic conditions and are often grown in regions susceptible to political and economic volatility, which can lead to price fluctuations in international markets.
Livestock:
While not “soft” in the classical sense, livestock commodities such as live cattle, feeder cattle, and lean hogs are integral parts of agricultural commodity trading. Prices in livestock markets are influenced by feed costs, disease outbreaks, weather conditions, and consumer demand for meat products.
Key Soft Commodities
Coffee:
Coffee is one of the most widely traded soft commodities globally. Major producers include Brazil, Vietnam, Colombia, and Ethiopia. Coffee prices are influenced by weather patterns, crop diseases (such as coffee leaf rust), labor availability, and global demand. Coffee futures are primarily traded on the Intercontinental Exchange (ICE).
Sugar:
Sugar is produced from sugarcane and sugar beets. Leading producers include Brazil, India, Thailand, and the European Union. Sugar prices fluctuate due to weather conditions, production levels, government policies, and ethanol demand (as sugarcane is also used in ethanol production).
Cocoa:
Cocoa beans are the primary ingredient in chocolate production. West African countries, particularly Ivory Coast and Ghana, dominate cocoa production. Political stability, climate changes, and disease outbreaks in these regions can have a significant impact on global cocoa prices.
Cotton:
Cotton is a key raw material for the textile industry. Major cotton-producing countries include the United States, India, China, and Brazil. Cotton prices are affected by weather conditions, global demand for textiles, and changes in synthetic fiber usage.
Orange Juice:
Primarily produced in Brazil and the United States (Florida), orange juice is traded in futures markets. Weather events such as frost or hurricanes significantly impact the production and price of orange juice.
Tea:
Tea is grown mainly in India, China, Kenya, and Sri Lanka. Prices are influenced by seasonal harvests, global consumption trends, and labor availability in plantations.
Factors Affecting Agricultural Commodities and Softs
Weather and Climate:
Agricultural commodities are extremely sensitive to weather conditions. Droughts, floods, unseasonal rains, and hurricanes can drastically reduce crop yields, leading to price volatility. For example, a drought in Brazil can sharply increase coffee and sugar prices globally.
Supply and Demand:
Basic economics drives commodity prices. An oversupply of crops reduces prices, while a shortage increases them. Factors such as population growth, dietary changes, and biofuel demand can shift demand patterns significantly.
Geopolitical and Economic Events:
Trade policies, tariffs, and sanctions affect commodity prices. For instance, export restrictions by a major producing country can create supply shortages and increase global prices.
Currency Fluctuations:
Since most agricultural commodities are traded internationally in U.S. dollars, changes in currency exchange rates can influence prices. A weaker dollar generally makes commodities cheaper for foreign buyers, potentially boosting demand.
Technological Advancements:
Improvements in farming techniques, irrigation, seed quality, and pest control can increase yields and stabilize prices. Conversely, delays in adopting new technologies may reduce productivity and raise prices.
Speculation and Market Sentiment:
Traders and investors in futures markets play a role in price determination. Speculative buying or selling can amplify price movements, sometimes disconnected from physical supply-demand fundamentals.
Trading and Investment in Agricultural Commodities
Agricultural commodities are actively traded in both physical and financial markets. The physical market involves actual buying and selling of the raw product, while the financial market deals with derivatives like futures and options. Futures contracts are standardized agreements to buy or sell a commodity at a predetermined price on a future date.
Soft commodities are widely traded on global exchanges such as:
ICE (Intercontinental Exchange) – Coffee, cocoa, sugar, and cotton futures.
CME Group – Soybeans, corn, wheat, and livestock futures.
Investors use agricultural commodities for hedging (protecting against price risk) and speculation (profit from price movements). For example, a sugar producer may sell futures contracts to lock in prices, while a trader may buy them anticipating a price rise due to supply concerns.
Economic and Social Importance
Agricultural commodities, especially softs, have immense economic and social significance:
Global Trade:
Soft commodities like coffee, cocoa, and sugar are major export products for developing countries. Their trade generates foreign exchange earnings and supports rural employment.
Food Security:
Cereals and oilseeds are critical for feeding the global population. Price stability in these commodities ensures access to affordable food.
Industrial Use:
Cotton feeds the textile industry, sugar is used in food processing and ethanol production, and soybeans contribute to oils and animal feed.
Inflation Indicator:
Agricultural commodity prices often influence food inflation. Sharp increases in soft commodities can directly impact consumer prices, particularly in developing nations.
Challenges in the Agricultural Commodity Market
Volatility:
Agricultural commodities are inherently volatile due to their sensitivity to unpredictable factors like weather, disease, and geopolitical tensions.
Storage and Transportation:
Unlike metals or oil, agricultural products can be perishable, requiring proper storage and logistics. Inefficiencies can lead to spoilage and losses.
Environmental Concerns:
Intensive farming practices may lead to soil degradation, water scarcity, and deforestation, affecting long-term sustainability.
Policy Dependence:
Government subsidies, import/export restrictions, and trade agreements heavily influence market dynamics, often creating artificial price distortions.
Conclusion
Agricultural commodities and softs form a cornerstone of global trade and economic activity. They are critical for food security, industrial production, and rural livelihoods. Soft commodities like coffee, cocoa, sugar, and cotton, while highly lucrative, are highly sensitive to environmental, economic, and political factors, making them volatile but attractive for traders and investors. Understanding the complex interplay of supply, demand, climate, and market dynamics is essential for anyone participating in these markets.
The ongoing globalization of trade, coupled with advances in agricultural technology and increased investment in commodity markets, continues to shape the future of agricultural commodities. As population growth and changing consumption patterns drive demand, soft commodities will remain a pivotal element of the global economy and financial markets.

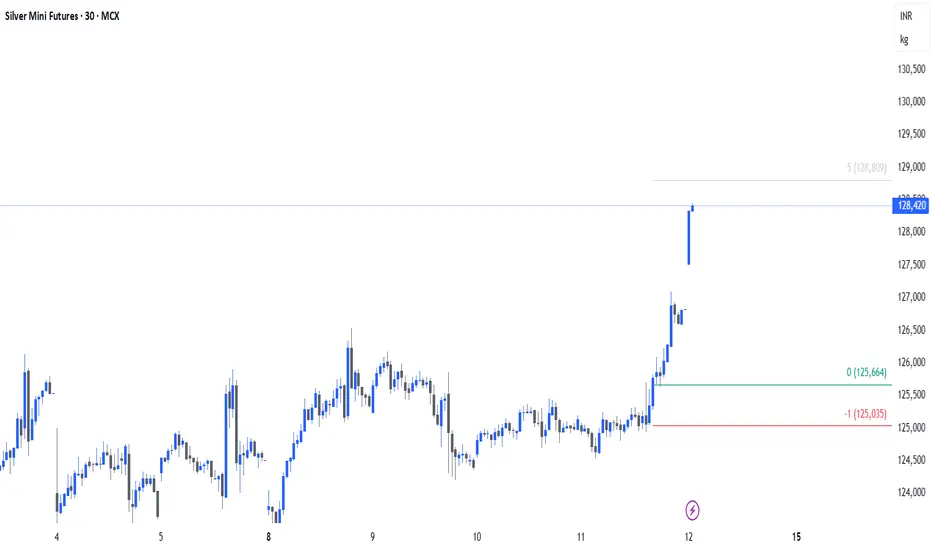
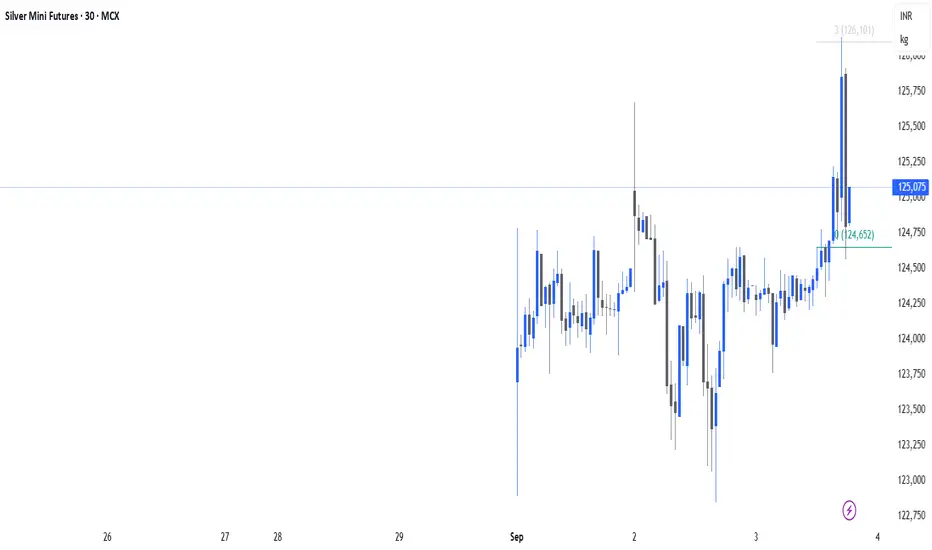
SILVER Triangle BreakoutSilver has given a breakout after forming a triangle pattern on 1h & 4h timeframe. Silver is also trading above 200 EMA on both the timeframes.

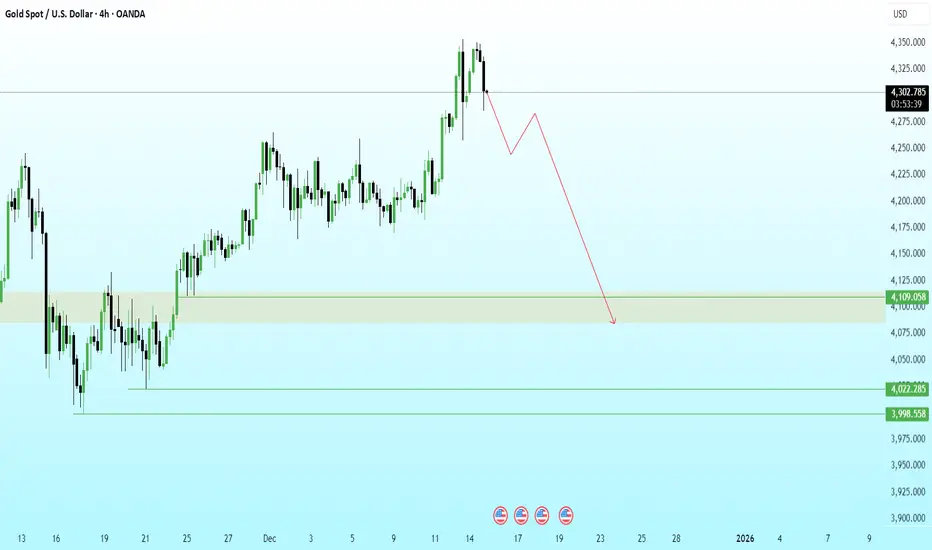
GOLD 4H | Liquidity Harvest Done… Now the Slide BeginsPrice engineered liquidity above the previous swing high and immediately delivered a sharp rejection, confirming a buy-side liquidity grab and the start of distribution.
Structure has now shifted bearish with a clear BOS from the premium zone. I’m expecting a mitigation leg before continuation lower.
The draw on liquidity sits inside the 4100–4080 demand imbalance, which aligns with unmitigated bullish orders from the prior accumulation phase.
If 4100 fails to hold on mitigation, the next liquidity pools rest at:
4022 (clean sell-side pocket)
3998 (final downside liquidity target)
GOLD → Structural Rebalance Before Next Bullish LegGOLD → Structural Rebalance Before Next Bullish Leg
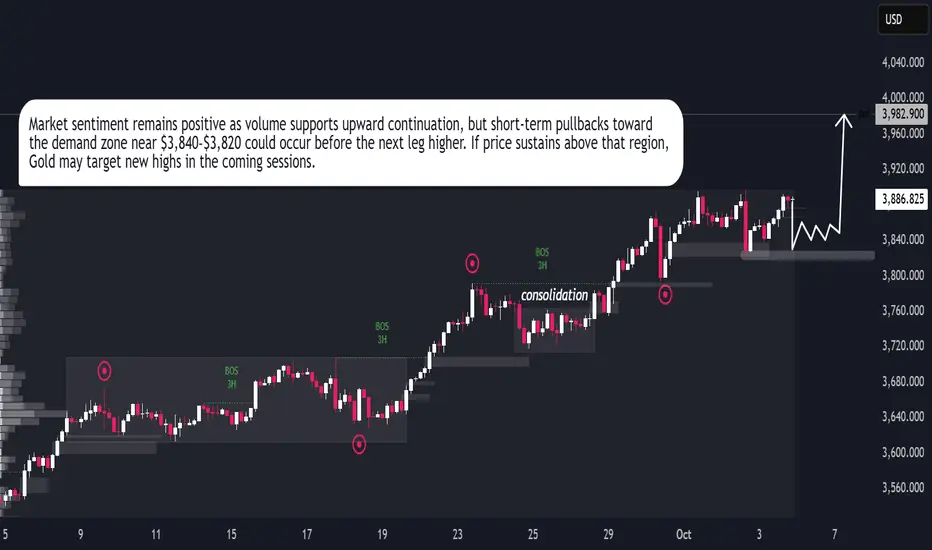
Gold remains in a strong bullish structure, showing consistent higher highs and steady momentum after each correction. The market has been consolidating above the $3,800 zone, where buyers continue to absorb liquidity and prevent deeper declines. This zone acts as a solid base for potential upward expansion. Current market behavior indicates controlled accumulation, suggesting that institutional buyers are maintaining dominance. If gold holds above $3,840–$3,820, the next bullish leg may target the $3,960–$4,000 region. A short-term retracement could occur, but overall momentum favors continuation. The price structure and volume behavior both support further upside, reflecting strong buyer control and stable sentiment in the market.
Gold Market Outlook – Bullish Trend Building MomentumGold continues to follow a structured bullish cycle, where each consolidation phase has been followed by a breakout and expansion. Market behavior shows liquidity being collected in sideway ranges, then released to fuel upward momentum.
At the current stage, price is trading around $3,870, showing signs of a potential short-term pullback to gather liquidity from the mid-zone. Once this corrective move stabilizes, the chart suggests a renewed bullish impulse with a projected upside target toward the $3,965 level.
This pattern highlights that the market remains in a controlled bullish phase, where temporary retracements are acting as setups for continuation rather than reversal. The underlying flow still favors higher levels as long as buyers maintain activity after corrections.

XAUUSD Forecast – Gold Price Action and Market InsightsXAUUSD Forecast – Gold Price Action and Market Insights
Gold is showing signs of stabilization after recent fluctuations, with price consolidating around the mid-range levels. The chart highlights repeated sequences of structural breaks and shifts, indicating that liquidity has been actively swept on both the buy and sell side.
The latest market move shows a controlled decline, followed by an attempt to absorb selling pressure. Current positioning suggests the possibility of a short-term liquidity grab to the downside, which could fuel a stronger recovery leg in the sessions ahead.
The projected outlook favors a scenario where buyers regain momentum, aiming to retest the upper price zones. If this momentum develops, the market may establish a renewed upward leg in alignment with the broader bullish cycle observed across higher timeframes.
From a macro perspective, gold continues to be supported by demand for safe-haven assets amid ongoing global financial uncertainty and shifting monetary policies. This backdrop enhances the probability of gold sustaining its mid-term bullish trajectory despite temporary corrective phases.

Gold Breaking Limits – Trend Speaks for ItselfGold Breaking Limits – Trend Speaks for Itself
Gold Market Outlook
Gold continues to demonstrate a well-structured bullish cycle, characterized by steady momentum and clean trend development. The market has transitioned from a prolonged consolidation phase into a sustained directional move, where each breakout is validated by controlled retracements. This reflects strong participation and confidence from larger players.
The sequence of market shifts and break-of-structure signals highlight how short-term pullbacks are consistently absorbed, turning into fuel for further expansion. Price action is orderly, with no signs of erratic volatility, showing that buyers remain in control and liquidity is being managed efficiently.
Overall, gold is moving in line with the broader macro sentiment. The rhythm of accumulation, expansion, and continuation suggests that the current cycle has not yet exhausted its potential. While interim pauses are expected, the structural integrity of the trend continues to favor upside development over the medium term.

Gold – Reversals to TrendsOur system thrives on dual strength — catching reversals at the turn and riding the trend that follows.
MCX:GOLDM1! has been the perfect example.
Precision entries on reversals, disciplined trailing on momentum.
This edge has delivered multiple double-digit “R” trades.
Risk stays small, reward compounds big.
That’s the power of rules executed with patience.

Silver – Riding the WaveMCX:SILVERMIC1! is trending strong, and we are already surfing at 5R.
Our system’s strength lies in catching mean reversals early and riding the momentum that follows.
Disciplined risk, precise trailing, no second-guessing.
This approach has delivered consistent double-digit “R” trades in the past.
Now, the trend is in motion — and we stay with it as long as it runs.
$MCX:GOLDTENU2025 – Back in the GamePrevious trade closed at a stellar 29R.
Now re-entered MCX:GOLDTENU2025 with fresh momentum.
Risk controlled, structure intact.
No predictions, just rule following.
Stops in place, trend will decide.
Let’s see how this one unfolds.
XAU/USD – Market awaits JOLTS, Gold holds safe-haven role⚓️ Captain Vincent – XAU/USD: US–Venezuela tensions push Gold as safe haven
1. Market News 🌍
US Secretary of State Marco Rubio confirmed that the US military attacked a drug ship departing from Venezuela, as Washington steps up pressure on the Maduro government.
Earlier, Trump offered a $50 million bounty to force Venezuela’s President out of power, while deploying military forces near the Caribbean coast.
👉 These moves raise fears of a potential regional conflict, making Gold the top safe-haven asset. The strong rally this morning reflects safe-haven flows returning to GOLD.
📌 Tonight’s focus (3/9 – 21:00): JOLTS Job Openings report – a key gauge of US labour market health.
If the data comes weaker than expected → USD may face more pressure → Gold could accelerate higher.
2. Technical Analysis ⚙️
On the H1 chart, Gold has formed multiple BOS (Break of Structure), showing the bullish trend remains in control.
Buy Zone 3,478 – 3,480: Aligns with a major Order Block, strong support for pullback entries.
Sell Zone 3,577 – 3,579: Near fib extension 1.618, potential resistance where profit-taking may appear.
Key Support – Resistance zones:
Support: 3,528 – 3,507
Resistance: 3,562 – 3,585
3. Trade Scenarios 📌
🔺 BUY Zone (Priority)
Entry: 3,478 – 3,480
SL: 3,470
TP: 3,483 → 3,486 → 3,489 → 349x → 35xx
🔻 SELL Zone (Resistance)
Entry: 3,577 – 3,579
SL: 3,586
TP: 3,573 → 3,570 → 3,567 → 3,560 → 35xx
4. Conclusion ⚓
Gold continues to benefit from US–Venezuela geopolitical tensions, while maintaining a bullish structure with consecutive BOS signals.
In the short term, traders may:
Look to BUY around 3,478 – 3,480 to follow the main trend.
Watch for short-term SELL at 3,577 – 3,579 if price retests strong resistance.
👉 With geopolitical risks rising and US economic data (JOLTS) due tonight, Gold remains the No.1 safe-haven asset.

FED dovish, Gold stays bullish; SELL only for scalps⚓️ Captain Vincent – Gold Plan XAU/USD
1. Market Wave 🌍
The probability of a FED rate cut in September surged to 96.6% (vs 90.4% earlier) after the JOLTS report showed weakening job prospects.
Several FED officials, from Kashkari to Bostic, shifted dovish. Only Musallim maintained a hawkish stance with a scenario of just one cut.
👉 Result: Capital flows returned to Gold as the No.1 safe haven, pushing prices strongly higher overnight.
📌 Key data today (04/09 – US time):
ADP Nonfarm (7:15)
Jobless Claims (7:30)
ISM Services PMI (9:00)
➡️ This trio of data will be crucial catalysts for GOLD volatility.
2. Technical Analysis ⚙️
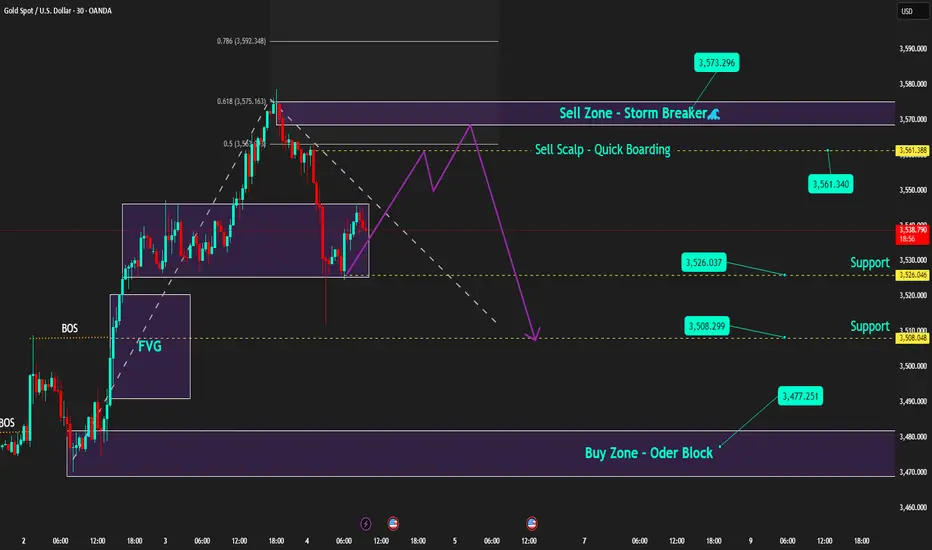
On M30/H1, Gold continues to form bullish BOS, keeping the main trend upward.
Golden Harbor 🏝️ (Buy Zone 3,477 – 3,479): Old Order Block, strong support if price pulls back.
Quick Boarding 🚤 (Sell Scalp 3,561 – 3,563): Only for short-term scalps.
Storm Breaker 🌊 (Sell Zone 3,573 – 3,575): Aligned with Fibo 0.618–0.786, strong resistance with potential selling pressure.
Captain’s Shield 🛡️ (Support): 3,526 – 3,515 – 3,508
3. Captain Vincent’s Map – Trade Scenarios 🪙
🔺 Golden Harbor 🏝️ (BUY – Priority)
Entry: 3,477 – 3,479
SL: 3,470
TP: 3,480 → 3,483 → 3,486 → 3,491 → 349x → 35xx
🚤 Quick Boarding (SELL Scalp – Short Ride)
Entry: 3,561 – 3,563
SL: 3,569
TP: 3,558 → 3,555 → 3,552 → 354x
🌊 Storm Breaker (SELL Zone – Strong Resistance)
Entry: 3,573 – 3,575
SL: 3,581
TP: 3,570 → 3,565 → 3,560 → 3,555 → 35xx
4. Captain’s Note ⚓
"The golden sail is filled with wind as the FED turns dovish. Golden Harbor 🏝️ (3477) remains the safe haven to align with the bullish trend. SELLs are just Quick Boarding 🚤 scalps at Storm Breaker 🌊 , not long voyages."
Gold consolidates as new alliances emerge | Captain Vincent 1. News Wave 🌍
At the two-day summit in Shanghai, Prime Minister Modi and President Xi Jinping announced that India and China will become development partners rather than competitors.
The meeting also included Russia and four Central Asian nations, aiming to form a Southern Hemisphere bloc to counterbalance the US and the West.
👉 This signals a shift in geopolitical power, heightening concerns of global polarization → Gold continues to hold its safe-haven position.
2. Technical Analysis ⚙️
On the H2 chart, Gold has formed a Higher High after the recent strong breakout.
Storm Breaker 🌊 (Sell Zone 3511 – 3518): Strong resistance, potential for supply if price retests.
Golden Harbor 🏝️ (Buy Zone 3450 – 3448): Confluence with FVG + Fibonacci 0.5/0.618, a key support for pullback entries.
Main Trend: Gold likely to move sideways between 3450 – 3510 before choosing a major direction.
3. Captain Vincent’s Map – Trade Scenarios 🪙
🔻 Storm Breaker 🌊 (SELL Reaction)
Entry: 3511 – 3508
SL: 3518
TP: 3505 → 3500 → 3497 → 349x → 348x
🏝️ Golden Harbor (BUY Zone – Strong Support)
Entry: 3450 – 3448
SL: 3440
TP: 3453 → 3456 → 3459 → 3462 → 346x
4. Captain’s Note ⚓
"Political news continues to stir the golden sea 🌊. Bears are waiting at Storm Breaker 3511, but the safe harbor remains Golden Harbor 3450 – 3448. In such unpredictable waters, prioritise short-term sells to flow with safe-haven demand, rather than recklessly facing the storm."

Natural gas - Matches the exact moves, posted on 24th AugNatural gas - Matches the exact moves, posted on 24th. August
Points gained- 229.5 to 264.8 = 35.3 points
1 Point = ₹1000 (35.3*1000= ₹35300.0)
Holding it, next is 300 & 320 target🎯
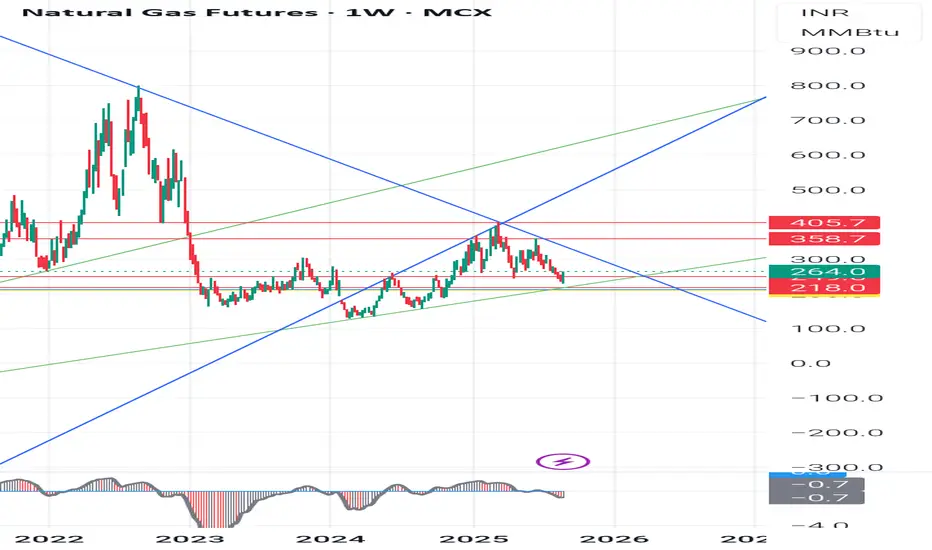
Natural Gas Futures (INR) Weekly Chart pattern analysisNatural Gas Futures (INR) Weekly Chart pattern analysis.
For the students, We will include chart structure, patterns, demand-supply zones, and precise support/resistance levels based on what is seen on the charts :
- Chart OverviewTimeframe: Weekly (1W)Current Price: 244.7 (down -5.30%)Price is near an important ascending trendline support (green line) after a strong correction from recent highs. Structure shows earlier breakout above descending trendline (blue) followed by a retest and rejection.
🧭 1. Trend Analysis- Long-Term Trend:From 2022 highs (900+), Natural Gas was in a sharp downtrend (blue descending trendline).Downtrend broke in late 2023, initiating a mid-term uptrend within an ascending channel.
Short-Term Trend:Since the 405.7 high (early 2025), prices are in a correction phase.Price now testing demand zone near 244-212.
📈 2. Chart Patterns,Ascending Channel: Price has been moving between parallel green lines since late 2023.Breakdown Risk: Price is testing the lower channel line; breakdown could trigger more downside.Head & Shoulders Possibility: The highs around 405-358 resemble a left shoulder-head-right shoulder formation, with neckline near 249-244. A confirmed break below could accelerate selling.
Supply Zone Rejection: Strong selling emerged from 358-405, marking it as a supply zone.
3. Key Technical Levels: Rejection Level: High Significance 405.7
-Major Supply 2025 high, strong rejection point 358.7
Secondary Supplying- Recent swing high before sell-off
249.6-244.7
- Current Zone - Channel support & neckline zone
218.0 - Demand Zone Past consolidation & buying interest
212.0 - Strong Support Historical demand zone floor
209.9
- Critical Support
If broken, opens path to 180-160⚖ 4. Demand & Supply ZonesDemand Zones:218-212 (weekly accumulation area)180-160 (last major base before rally)
Supply Zones:358-405 (heavy selling area)280-300 (minor supply if bounce occurs)
5. Possible ScenariosScenario
1 Support Holds:If 244-212 holds, expect a bounce towards 280 and 300.A close above 300 could re-test 358.
Scenario
2 - Breakdown:A close below 212 could lead to a quick drop towards 180-160.
👉 Disclaimer:
This is for educational purposes only, not trading advice. Futures & commodities are highly volatile; manage risk and consult a registered financial advisor.
#naturalgas #technicallevels #chartpatternabalysis #commoditytrading
Gold Plan 18/08 – Captain VincentBackground
For the past two days, Gold has repeatedly tested the 3332 – 3334 zone and slipped down to 3323, showing that buyers at this level are losing strength.
The broader trend still leans bullish, but the market is heavily influenced by geopolitics and news events:
📰 US–Russia preparing for a new round of Ukraine talks (15 Aug, Alaska).
🌐 Trump’s tariff stance remains unclear, adding volatility to Gold.
💵 Fed is likely to cut 25bps in September, keeping Gold in “defensive but ready to break out” mode.
➡ With this backdrop, today’s plan requires flexibility: Buy with trend, Sell scalp at key resistances.
1. Buy Scalp – Quick Boarding 🚤
Entry: 3324 – 3326
SL: 3320
TP: 3328 → 3332 → 3336 → 33xx
Note: Only suitable for quick scalps, avoid holding longer.
2. Main Buy Zone – Safe Harbor ⚓
Entry: 3313 – 3311
SL: 3304
TP: 3314 → 3319 → 3325 → 3330
Meaning: This is the main launchpad for buyers if price corrects deeper.
3. Sell Scalp Zone – Storm Breaker 🌊
Entry: 3366 – 3377
SL: 3383
TP: 3362 → 3355 → 33xx
Meaning: Short-term resistance, ideal for quick reaction sells.
4. Main Sell Zone – Watchtower ⛩
Entry: 3396 – 3394
SL: 3402
TP: 3390 → 3385 → 3380 → 33xx
Meaning: Strong resistance zone, highly likely to trigger a bearish reaction.
If broken, Gold may extend further into 34xx.
Today’s Scenarios
If price dips to 3324 – 3326 → Quick Buy Scalp.
If price drops deeper → Prefer to Buy at Safe Harbor (3313 – 3311).
If price rises to 3366 – 3377 → Short-term Sell Scalp.
If price tests 3396 – 3394 → Stronger Sell, this is the main resistance.
Captain’s Note:
"The Gold ship still sails North ⚓ today, but each time it hits Storm Breaker 🌊 or Watchtower ⛩, the sails will drop for a quick strike before retreating. Waves from Trump–Putin headlines and the Fed’s next move may stir up rough seas. Remember, mates: better to miss one trade than let the waves sink the ship." 🏴☠️

Gold Plan 13/08 – Captain VincentGold Plan 13/08 – Captain Vincent ⚓
News Background
📊 Gold is holding steady near $3,350/oz after the US July CPI release.
Headline CPI : 2.7% (below forecast of 2.8%) 📉
Core CPI: 3.1% (up from 2.9%) 📈
➡ This cools down inflation fears from tariffs and increases the probability of a 25 bps Fed rate cut in September , which is bullish for Gold.
Key factors to watch:
💼 Market awaiting more data: PPI, jobless claims, retail sales.
🔍 Tariff drama: Trump says no tariffs, but US Customs just listed 1kg & 100oz gold bars under taxable imports.
🌐 US extends the trade truce with China for another 90 days.
🕊 US–Russia talks on Ukraine scheduled for 15 Aug in Alaska.
News conclusion:
Lower-than-expected CPI + higher Fed cut chances = Gold remains positive.
But tariff and geopolitical risks must be tracked closely.
Yesterday’s Action (12/08)
Gold tapped the Buy Scalp – Quick Boarding 🚤 zone and bounced ~290 pips .
However, it failed to break decisively above the zone and moved sideways around support.
Technical Plan – 13/08
1. Sell Scalp – Quick Boarding Reverse ⚓
Entry: 3,374 – 3,376
SL: 3,382
TP: 3,368 → 3,362 → 3,355 → 3,3xx
Reason: Short-term resistance, suitable for quick sell scalps when price retests higher.
2. Sell Zone – Storm Breaker 🌊
Entry: 3,405 – 3,406
SL: 3,411
TP: 3,395 → 3,385 → 3,375 → 3,365
Reason: Major resistance zone aligned with previous highs and trend channel.
Scenarios:
Price likely to rise from current sideways range to test either Sell Scalp or Storm Breaker.
Priority: Sell if reversal signals (pin bar, engulfing) appear on M15/H1 at these zones.
If price breaks above Storm Breaker and holds above 3,411 → cancel sell plan, wait for new structure.
Captain’s Note:
"The CPI wave has anchored the Gold ship near 3,350. Today, the crew is ready to set sail towards Sell Scalp and Storm Breaker, waiting for the winds to shift for a profitable turn." ⚓🌊

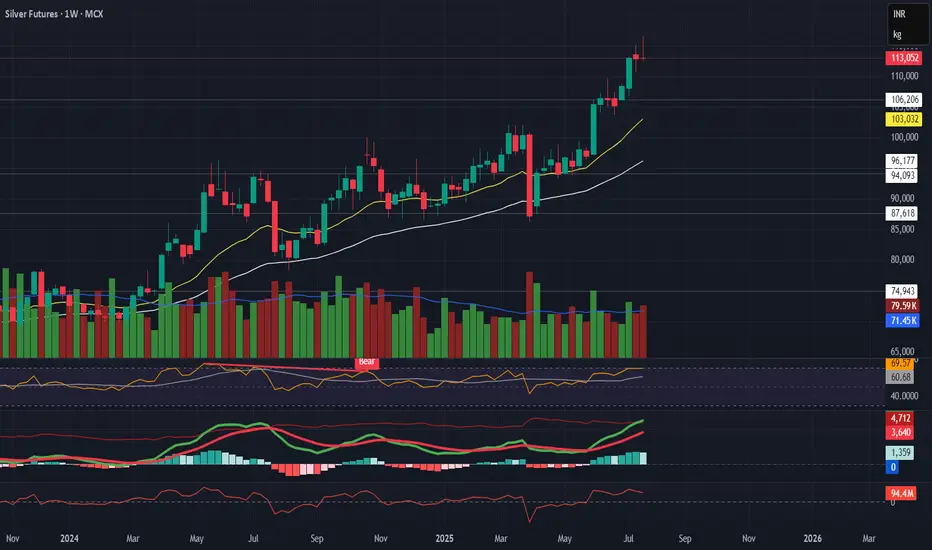
Silver Futures – Bearish Reversal in Progress
Silver Futures – Bearish Reversal in Progress
Description:
Silver is showing a strong technical reversal across timeframes. Short-term correction looks likely.
Technical Setup:
Daily:
Evening Star + Bearish Engulfing
Flattening EMAs
Volume and MACD confirming momentum slowdown
Weekly:
Gravestone + Southern Doji near resistance
RSI close to overbought
EMA slope still up, but weakening signs visible
Macro View:
No major bearish macro trigger — Fed dovish, USD stable, inflation low.
→ This is likely a technical pullback, not a fundamental reversal.
Trade Plan:
🔻 Breakdown Level: ₹114,560
🎯 Targets: ₹107K → ₹101K → ₹93K
🛑 SL: ₹116,000+
Caution: No position without breakdown confirmation.
Big Move Ahead? Copper Futures Breakout Trade Setup!Hello everyone i hope you all will be doing good in your life and your trading as well. Today i have brought a Copper Futures (MCX, 1D) trading idea, earlier it has broken out of a Symmetrical Triangle Pattern , and given signal of a strong bullish move . after the breakout copper has given good move and finally trading above the all near term resitance zone like NECKLINE , Buyers are stepping in aggressively. If the price holds above the 895-880 zone, we could see a rally towards 913, 937, and even 986 in the coming sessions. But remember, risk management is key! A strict stop loss at 858 will help protect against any unexpected reversals. The structure looks solid, momentum is building up—now let’s see if the bulls take charge!
Disclaimer: This analysis is for educational purposes only. Please consult a financial advisor before making investment decisions.
If you Found this helpful? Don’t forget to like, share, and drop your thoughts in the comments below.

Silver Commodity - Breakout in Day TimeFrameSince September, silver futures have been consolidating, indicating a period of price stability and indecision among traders. As of today, January 30, 2025, the market has experienced a breakout from the established trendline, signaling a potential shift in momentum. This breakout could suggest renewed buying interest and the possibility of upward price movement, making it an opportune time for traders to reassess their positions and strategies in light of this development.

Commodity Analysis: Silver – Potential Short-Term UpsideHello, Traders! 👋
Silver is shaping up for an interesting move:
📈 Technical Overview:
🔹 Higher low formed on the weekly chart, suggesting potential accumulation.
🔹 My ILTF indicator has already signaled a BUY, but the price remains sideways for now.
🔹 A breakout above 92,000 could trigger a short-term upmove toward the all-time high (ATH).
💡 Current Plan:
I’m not holding any position currently but closely watching for momentum on the daily chart. If a breakout occurs, I may consider initiating a pilot position to capture the move.
⚠️ Disclaimer:
🔹 I am not a SEBI-registered advisor.
🔹 This analysis reflects my personal views and is not a recommendation to buy or sell.
🔹 Shared purely for learning purposes—please conduct your own research or consult a professional before trading.
Keep an eye on Silver—things might get shiny soon! 💡

Silver is ready FlySilver formed w pattren it seems bullish can show new life time high in commin days
