Concor

Concor BuyIn this current market, Concor seems to be the goos trade in the coming days.
Fib retracement 50% support playing good Support for the stock DOJI formation at the bottom can be a reversal signal.
Don't be in hurry to trade SL can be 652 on closing Basis
Targets can be 700 and 730 for swing.
Buy Aug month contract for a good move.
Just like Wipro, good returns are expected from the stock Grandfather, Father, and son strategy.
If you have not seen This strategy watch my Wipro IDEA shared on Tradin View Results can furious.
Buy on dip here on the stock.

CONCOR Trading Levels for 14-07-2021 to 16-07-2021NSE:CONCOR
Do not trade in "No Trading Zone". Better to take safe trade.
Need strong Breakout or breakdown candle to trade in either of side.
All the best.


CONCORConcor has given parellel channel breakout along with all good setups
can go long at current levels, All key levels are mentioned in chart along with stoploss and targets.
Key Levels
Bollinger Band
Dmi Adx
RSI BUY
MACD
Disclaimer
I am not sebi registered analyst
My studies are for educational purpose only
Consult your financial advisor before trading or investing

Concor - Minimum 700 can be seen with SL below 500/-Concor looks in Wave 3 which should take it higher targets of 700+ after which it may retrace to Wave 4 and then again may rise to Wave 5


CONCOR @ WEEKLY BREAK OUTContainer corporation is at weekly Breakout good for Delivery with stop loss 695

Short Buy Trade in Concor- Multi year breakout Analysis :
Breakout on Monthly timeframe
Multiyear breakout
Good Volumes
Buy Concor with the target of 710, 720, 730
SL below 680
If you are looking for long term the stock is expected to touch 900-100 levels within 6-12 months

Concor - for mid / long termTRADE PLAN for Mid / Long Term :
(6 months to 30 months)
Buy 25% at 680, 50% when comes down to 600 zone, balance 25% inbetween 610/670
Weak below 520 (day close basis)
Probable level is 1035
BASIS :
Inside bar breakout on Monthly
MultiYear breakout (since 2014) supply zone on monthly
Volume spurt on weekly candles
Bullish structure
Supported by Funsamentals

CONCOR TARGET 704 at .786 levels soon seeing CONCOR at 700!! .786 levels acc to fib levels
already crossed .382 and .50 levels at 615 and 641 levels....
now at 668 and ready to cross 700!!!

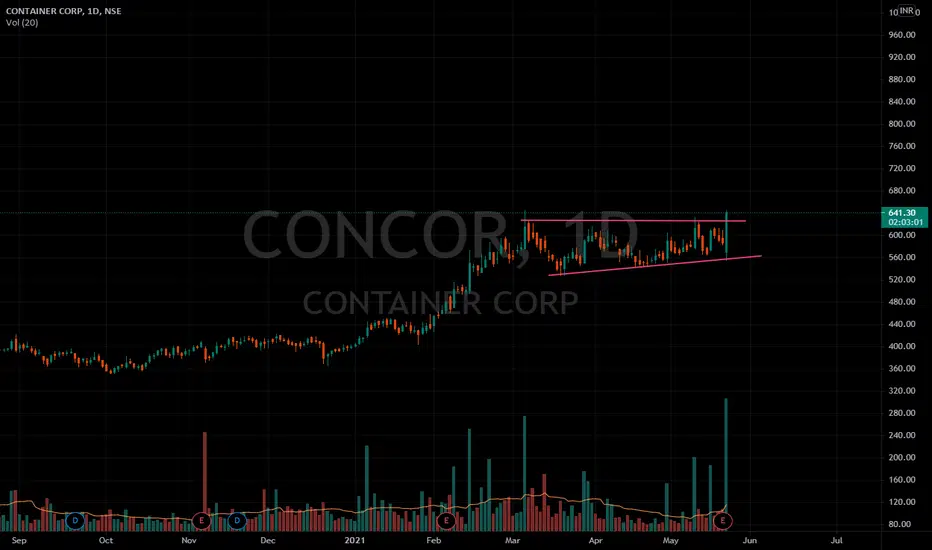
Trendline breakout long positional call in # CONCORNSE:CONCOR
Trendline breakout long positional call in CONCOR . may take entry above the triangle pattern.

CONCOR Analysis- Buy For 10%CONCOR
Buy- Above 645
SL - 630
Target- 660 675 692 715
Duration- 10-15 DAYS
Note:- I am not SEBI registered . All Views and trade setups are my personal view and my personal trade setup.
Do follow us
Like Us
Share with fellow traders
Also check the below related ideas for other stocks.

Strength in CONCOR! NSE:CONCOR came up with good quarterly results and the market seems to reward the same.
The key levels are marked in the chart.

CONCOR Daily Time Frame AnalysisWelcome your valuable comments on this script
For Short Term Can Buy at Current Cpm
With Stop Loss 560 that is recent Swing Low
For Long Term wait for All Time High Breakout
All Time High Resistance 666
Share Will Strong Bullish Above 730
for Target 1000 to 1100
I am not a SEBI registered adviser. All the information provided by me are for educational/informational purposes only. Never invest more then 2 % Capital In Single trade. Trade on your own Risk and analysis

CONCOR Positional setup | #LetsMakeMoneyTogethersymmetrical triangle breakout .... buy on a retracement at the closing lvls .... a good move can take place tomorrow :) or in near days ....
Hold the winner if gives good moves ...

Concor breaked out of penantConcor looking good on charts
Breaked out of the penant
610-615 looks good buy zone
DISCLAIMER
( Educational Purpose )
All investments involve risk.
Please Do your analysis before initiating Any trade
Good luck !

Short term target for CONCOR as per chartas per chart first targets are 663,702, 711
enter on breakout only


CONCOR - Multi timeframe + Fibo+ Stage Formation + flagGave a break out from stage formation.
The Indicator Used:
PANEL 1:
1) Daily Lines Plots Daily 20 (BLACK) & 50 EMA (GREY), BLUE (200 DAILY EMA ) On Lower Time Frame Charts.
2) Valuation band
KEYS: Red Faded Cloud: Over Valuation.
Grey Faded Cloud: Proper Valuation.
Green Faded Cloud: Under Valuation.
PANEL 2:
1) TE-REKAB - Proprietary Indicator
KEYS:
PB: Pullback
Blue Candle: Selling Divergence
Yellow Candle: Buying Divergence
If you like the analysis, do leave a like and follow for more such content coming up.
The analysis is my POV , hope you got bucks in your pocket to consult a financial advisor before investing :P :)
HAPPY TRADING!!!

Concor - Triangle patternPrice forming a triangle pattern and it is presently moving from the support level. Wait for the break !

Moving in Descending ChannelA descending channel is drawn by connecting the lower highs and lower lows of a security's price with parallel trendlines to show a downward trend.
