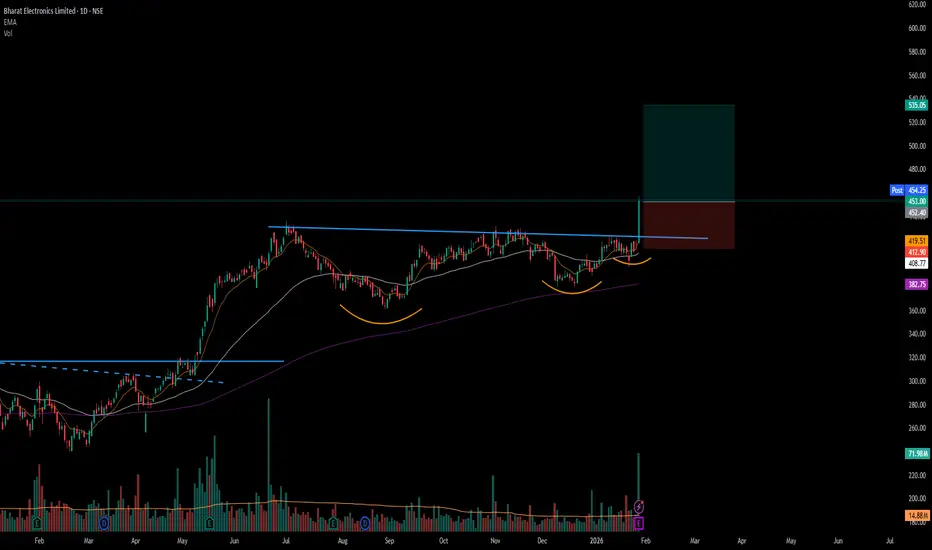
#BEL - VCP BreakOut in Daily Time Frame Script: BEL
Key highlights: 💡⚡
📈 VCP BreakOut in Daily Time Frame
📈 Volume spike during Breakout
📈 Base BreakOut
📈 RS Line making 52WH
📈 MACD Crossover
⚠️ Important: Market conditions are BAD, Avoid entering any Trade. Protect Capital Always
⚠️ Important: Always Exit the trade before any Event.
⚠️ Important: Always maintain your Risk:Reward Ratio as 1:2, with this RR, you only need a 33% win rate to Breakeven.
✅ Boost and Follow to never miss a new idea!✅
Disclaimer: I am not SEBI Registered Advisor. My posts are purely for training and educational purposes. Not a BUY or SELL recommendation.
Eat🍜 Sleep😴 TradingView📈 Repeat 🔁
Happy learning with MMT. Cheers!🥂
Consolidation
Types of Breakout in the Markets ( Monthly Time Frame )In this video I will showcase different type of Breakouts you can see in the markets, mostly Horizontal types and Trendline Types but even inside them which ones are best to follow
I have used charts older than 3 months to showcase this information

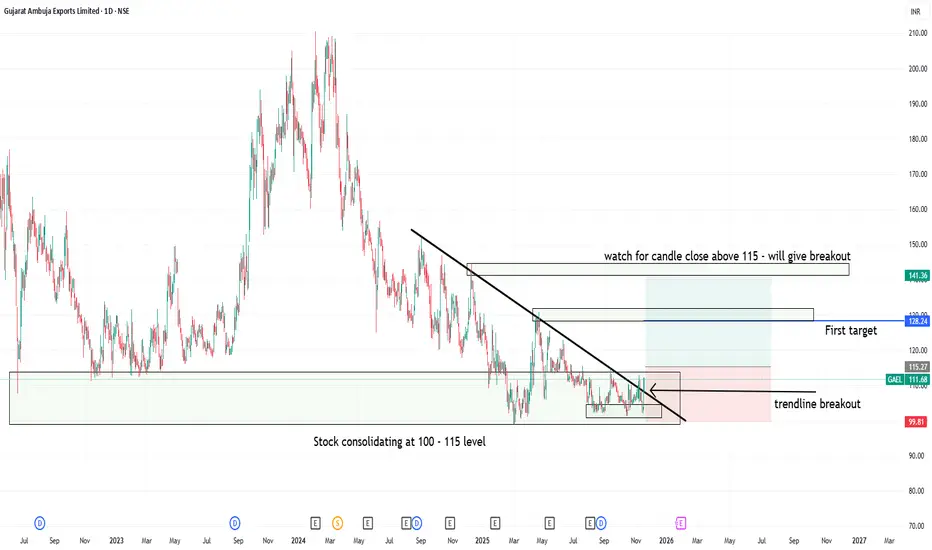
Trendline breakout at support level in GAEL1. Gujrat ambuja export lt- showing consolidation at 100 to 115 levels
2. Candle close above 115 can trigger consolidation breakout at strong support zone
3. Trendline breakout has already happend but above 115 close will be safe and logical
4. Good Risk:Reward one can watch for upside movement with strict sl level
BUY TODAY SELL TOMORROW for 5%DON’T HAVE TIME TO MANAGE YOUR TRADES?
- Take BTST trades at 3:25 pm every day
- Try to exit by taking 4-7% profit of each trade
- SL can also be maintained as closing below the low of the breakout candle
Now, why do I prefer BTST over swing trades? The primary reason is that I have observed that 90% of the stocks give most of the movement in just 1-2 days and the rest of the time they either consolidate or fall
Consolidation Breakout in KAPSTON
BUY TODAY SELL TOMORROW for 5%

Northern Arc Capital | Daily Chart | Consolidation Price is consolidating between ₹250–270 after a strong recovery, indicating absorption near resistance rather than weakness.
🔹 Resistance: ₹270–275
🔹 Support: ₹250–255
🔹 Structure: Falling channel / flag after upmove
🔹 EMA Zone: Price holding near EMAs → volatility compression
👉 Sustained breakout above ₹275 with volume can trigger the next leg towards ₹300+.
👉 Breakdown below ₹245 will weaken the bullish structure.

#JKTYRE - Cup & Handle / IHNS BO in DTFScript: JKTYRE
Key highlights: 💡⚡
📈 Cup & Handle / IHNS BO in DTF
📈 Volume spike seen during Breakout
📈 MACD Bounce
📈 RS Line making 52WH
✅Boost and follow to never miss a new idea! ✅
⚠️ Important: Always Exit the trade before any Event.
⚠️ Important: Always maintain your Risk:Reward Ratio as 1:2, with this RR, you only need a 33% win rate to Breakeven.
⚠️Disclaimer: I am not SEBI Registered Advisor. My posts are purely for training and educational purposes.
Eat🍜 Sleep😴 TradingView📈 Repeat 🔁

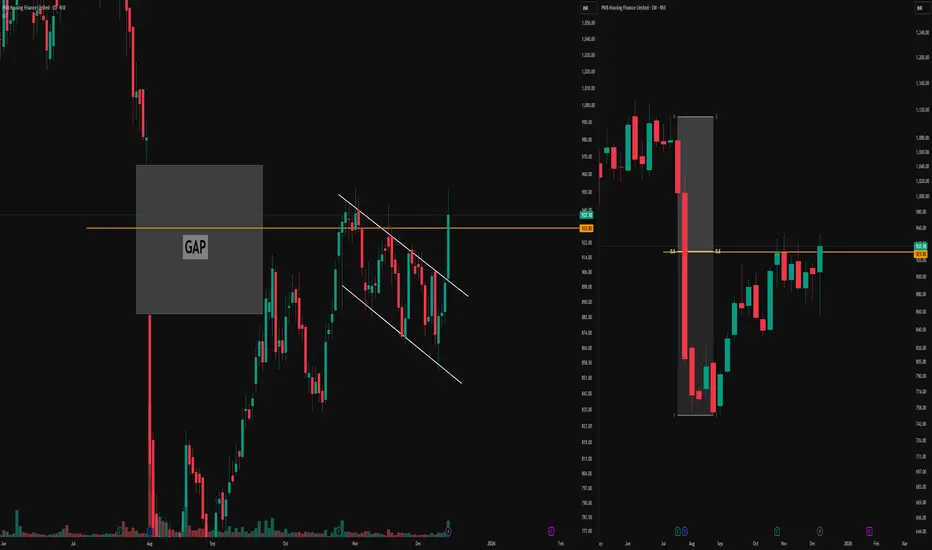
Parallel Channel, Stubborn Gap & 0.5 Equilibrium RejectionDaily Timeframe Details
The left chart on the daily timeframe displays a parallel channel structure forming after an initial one-sided move.
A significant gap emerged within this leg, which price has approached multiple times—first entering the gap area from below but rejecting sharply to form a higher low, then pushing toward a higher high without fully filling it.
This illustrates how gaps often resist easy fills from either direction, acting as persistent reference zones that demand confluence for interaction.
Weekly Timeframe Context
The right chart provides the weekly timeframe for the same instrument, highlighting repeated rejections at the 0.5 equilibrium level.
These weekly rejections align precisely with the daily gap interactions and channel boundaries, demonstrating how higher-timeframe equilibrium can underpin lower-timeframe price behavior without implying direction.
Such multi-timeframe alignment offers educational insight into structural references in market analysis.
This post serves purely educational and observational purposes and does not constitute buy, sell, or investment advice. Always conduct your own research.
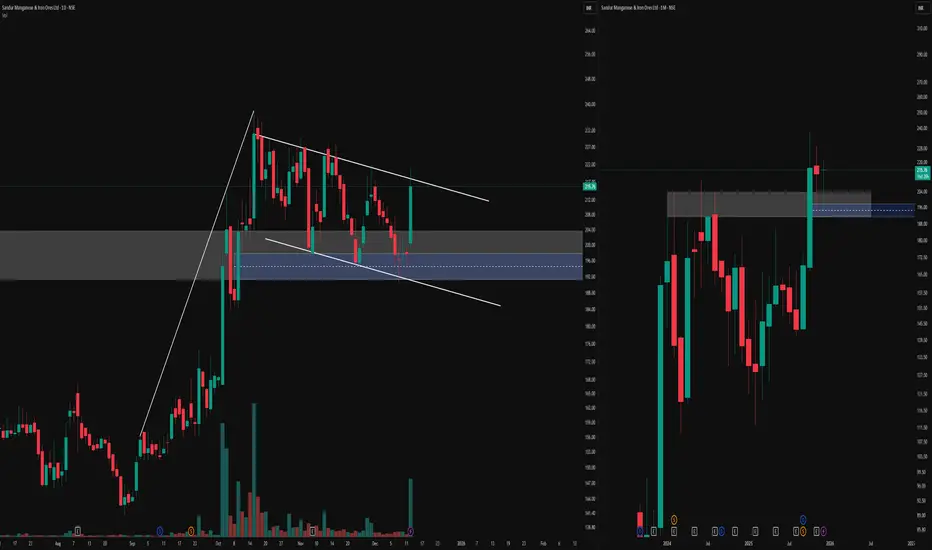
Multi‑Timeframe Flag & Fair Value Gap ObservationOn the left, the daily timeframe is highlighting a potential flag‑and‑pole structure after a strong one‑sided move.
Within this leg, a blue fair value gap has been marked, which price has interacted with multiple times, illustrating how an imbalanced area can act as a reference zone over time.
On the right, the monthly timeframe of the same instrument is added to provide broader structural context to the daily pattern.
This multi‑timeframe layout is meant purely to show how a lower‑timeframe pattern and an identified fair value gap can be viewed alongside the higher‑timeframe trend without attaching any directional bias.
Disclaimer: This post is for educational and illustrative purposes only and does not constitute investment, trading, or financial advice. Always do your own research and consult a registered financial professional before making any trading decisions.
#SAKAR - VCP BO in WTFScript: SAKAR
Key highlights: 💡⚡
📈 VCP BO in WTF
📈 Volume spike seen during Breakout
📈 MACD Bounce
📈 RS Line making 52WH
⚠️ Important: Always Exit the trade before any Event.
⚠️ Important: Always maintain your Risk:Reward Ratio as 1:2, with this RR, you only need a 33% win rate to Breakeven.
✅Boost and follow to never miss a new idea! ✅
Disclaimer: I am not SEBI Registered Advisor. My posts are purely for training and educational purposes.
Eat🍜 Sleep😴 TradingView📈 Repeat 🔁

Titan on 1W TF1. Titan have taken support on long term support zone for 3 times.
2. Near support zone, it have formed bullish candlestick patterns.
In May 2025, it have formed Bullish Morubozu like candle which was last hit to support zone.
3. In first week of July 2025, there was a strong bearih candle with volume, despite that, stock have sustained near 3400 levels by consolidation and then have bounced back with 2 Bullish belt-holds in the bounce and have tested the long term resistance zone.
And now have retraced around 50%(July - Aug move).
4. Now the current levels are make or break levels, short term trend will be confirmed, bearish or bullish as per the move from these levels (50% zone).
Probability wise looks like it may take support, previous resistance zone should act as support as per price action.
Let's see how it moves further.
Disclaimer: This is not any stock tip/advice to buy or sell. Invest on your own risk.

Indus Towers (W): Strongly Bullish - Turnaround BreakoutTimeframe: Weekly | Scale: Linear
The stock is on the verge of a major structural breakout from a decade-long corrective phase. This move is supported by a massive volume expansion and a "trifecta" of positive fundamental news.
🚀 1. The Fundamental Catalyst (The "Why")
The massive volume surge (32M+) is a direct reaction to major positive developments:
1. VIL Dues Recovery: Vodafone Idea has started clearing past dues, significantly improving Indus Towers' cash flow visibility.
2. Credit Rating Upgrade: ICRA recently upgraded the company's long-term rating to AAA (Stable) , the highest level of safety, signaling financial robustness.
3. Promoter Confidence: Bharti Airtel has increased its stake to >51%, solidifying its commitment.
📈 2. The Long-Term Structure (The Breakout)
- The "Lid" (Angular Resistance): The stock has been suppressed by a downward angular resistance since its historic highs (2015-2017). Breaking this trendline signals a multi-year trend reversal.
- The Consolidation: Since April 2024, the stock has formed a "base" with Equal Lows (~₹315) and Lower Highs, effectively coiling for a move.
- The "Ignition": This week’s 3.65% surge with 32.5 Million volume is the "ignition" signal. It shows that buyers are finally aggressive enough to challenge the long-term supply zone.
📊 3. Technical Indicators
Indicator analysis confirms the momentum shift:
- EMA: The short-term EMAs are in a Positive Crossover state across Monthly, Weekly, and Daily timeframes, confirming a synchronized bullish trend.
- RSI: Rising across all timeframes, indicating that momentum is expanding into the breakout.
🎯 4. Future Scenarios & Key Levels
The stock is right at the "make or break" point.
- 🐂 Bullish Breakout (Confirmation):
- Trigger: A decisive Weekly Close above ₹430 (the recent 52-week high).
- Target: ₹473 – ₹480 . This aligns with the 2017 All-Time High zone.
- 🛡️ Support (The "Must Hold"):
- Immediate Support: ₹394 . If the breakout fails, the stock must hold this level to keep the short-term uptrend alive.
- Stop Loss: A close below ₹380 would invalidate the current momentum.
Conclusion
This is a High-Conviction Setup . The combination of a multi-year technical breakout and strong fundamental turnaround (cash flow + ratings) makes this a prime candidate for a re-rating. Watch for a close above ₹430 .

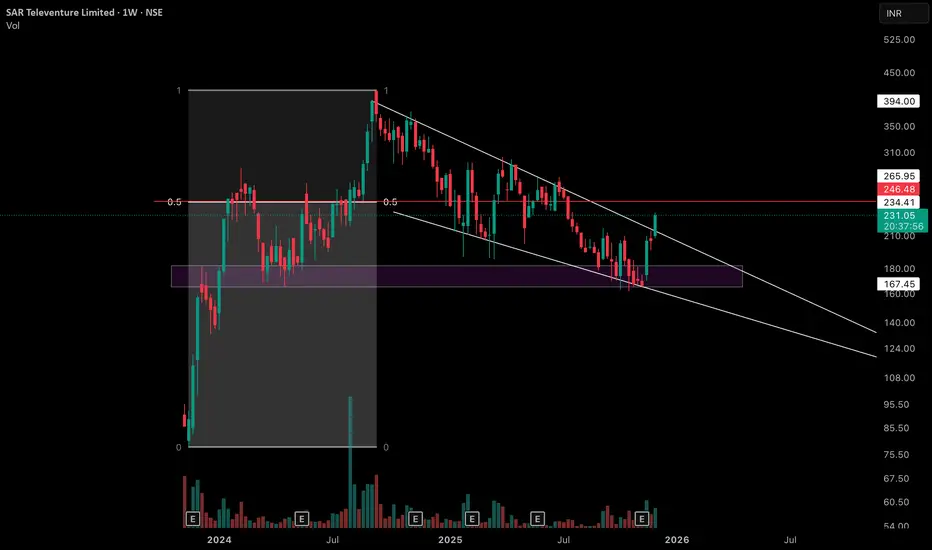
Weekly Equilibrium at Former Supply Zone with 4 observationsObservation 1 - On this weekly chart of SAR Televenture Limited, price has created an interesting equilibrium between the major swing low and the all‑time high swing high, with the 0.5 level highlighted by the red horizontal line as a key mid‑point reference.
Observation 2 - The purple zone marked on the chart was earlier a clear supply / resistance area but has now flipped into a support zone, getting respected multiple times over the past several weeks.
Observation 3 - After printing its all‑time high, price has moved into a sequence of lower highs and lower lows, but each leg has remained relatively controlled instead of showing any one‑sided, sharp liquidation move. This creates a broader consolidation structure where volatility is present yet contained.
Observation 4 - The white lines on the chart represent the upper and lower rejection boundaries of this consolidation channel, and most of the recent candles are developing within these two lines.
Disclaimer: This post is purely for educational and informational purposes, intended to study price structure and market behavior on the weekly timeframe. It is not investment advice or a recommendation to buy or sell any security; traders and investors should do their own research and consult a registered financial professional before making any decisions.
Apollo Tyres (D): Bullish, Momentum Building at ResistanceTimeframe: Daily | Scale: Linear
The stock is staging a strong recovery from the lower end of its consolidation range. It is now challenging the critical supply zone, backed by rising volume and positive fundamental developments (pledge release).
🚀 1. The Fundamental Catalyst (The "Why")
The renewed buying interest is driven by two key factors:
- Pledge Release: On Nov 17, 2025 , Catalyst Trusteeship released a massive pledge on 63 Million shares (approx. 9.9% stake). The removal of this overhang is a major confidence booster for investors.
- Softening Input Costs: Recent reports suggest a bearish outlook for Crude Oil (a key raw material for synthetic rubber), which directly improves margin outlooks for tyre companies.
📈 2. The Technical Structure (The "Box")
> The Range: The stock has been trapped in a wide "Box" pattern:
- Floor (Support): ₹364 – ₹370 . This level has held firm since May 2023, acting as a strong accumulation zone.
- Ceiling (Resistance): ₹545 – ₹550 . This zone (active since Jan 2024) has rejected multiple rally attempts, including the failed breakout to the ATH of ₹585 in Sep 2024.
> Current Action: The stock is currently consolidating just below this resistance.
- The Surge: Today's move (closing ~3% up) with 1.52 Million volume indicates that bulls are gathering strength to attack the resistance again.
📊 3. Technical Indicators
Indicator analysis shows a synchronized bullish trend:
- EMAs: The PCO (Positive Crossover) state across Monthly, Weekly, and Daily timeframes confirms that the trend is aligning upwards across all horizons.
- RSI: Rising across all timeframes, showing that momentum is expanding into the breakout attempt.
🎯 4. Future Scenarios & Key Levels
The stock is at a decision point. We need a confirmed breakout to avoid another rejection.
- 🐂 Bullish Breakout (The Trigger):
- Condition: A decisive Daily Close above ₹550 .
- Target 1: ₹585 (The ATH). This is the immediate magnet.
- Target 2: ₹630 . If the stock enters "blue sky" discovery, this is the technical extension target.
- 🐻 Bearish Rejection (The Range Play):
- Condition: If the stock faces heavy selling at ₹545-550 again.
- Support: The stock would likely drift back to the mid-range support at ₹512 or the 20-day EMA.
Conclusion
The setup is promising. The Pledge Release removes a major structural risk, and the technicals are aligned. However, do not anticipate the breakout. Wait for a close above ₹550 to confirm that the "ceiling" has finally been shattered.

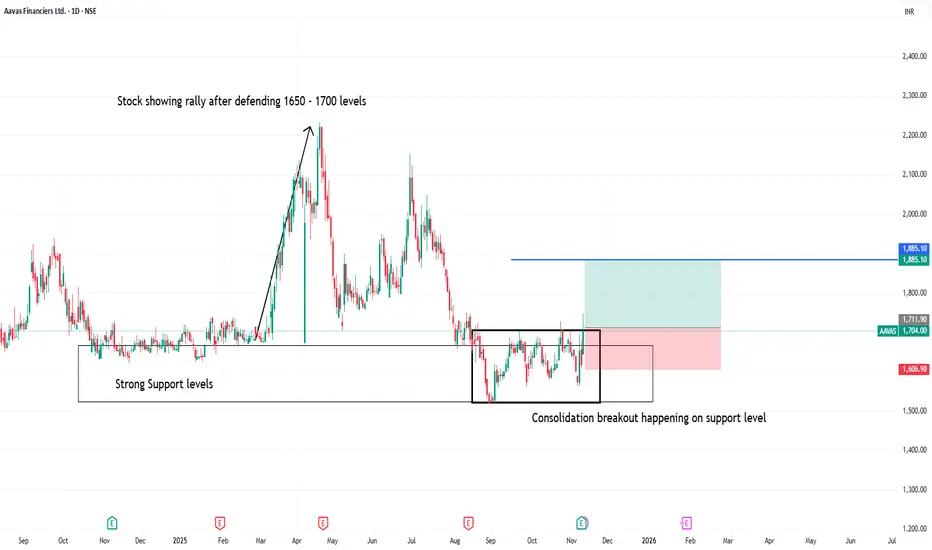
Consolidation breakout happening on support level in aavas fin1. Stock has been showing strength on 1700 levels buyers accumulating and taking further as shown on previous support
2. On same levels now consolidation has happened and soon stock may give nice breakout with great R:R
3. Usually range in consolidation will be its target after breakout
for ex:
if range is of 100 points in consolidation then target will be of 100 points
Lets Create and Backtest a Simple Strategy from literally ZeroI make educational content videos for swing / positional trading .
In this video I will be using 3 months old chart along with one example of how to approach any trade or price action with literally zero lines and zones on screen .

Nykaa (D): Strongly Bullish, Earnings-Driven BreakoutThe stock has confirmed a major structural breakout, reclaiming levels not seen in years. This move is supported by a powerful combination of rising volume , bullish indicators , and a stellar Q2 earnings report .
🚀 1. The Fundamental Catalyst (The "Why")
The technical breakout is being driven by the company's strong Q2 FY26 Earnings (announced recently):
- Net Profit: Surged over 243% YoY , signaling a massive turnaround in profitability.
- Revenue: Grew ~25% YoY , confirming sustained demand.
- Market Reaction: This fundamental strength is attracting institutional capital, evidenced by the rising volume.
📈 2. The Long-Term Structure (The Breakout)
- The "Lid" (May 2022 Resistance): The ₹260–₹270 zone was a major breakdown level back in May 2022. Reclaiming this zone after 3.5 years changes the long-term trend from bearish/neutral to bullish.
- The Consolidation Base: The "sideways trend since Oct 2025" was effectively a base-building phase where the stock absorbed supply before this leg up.
- Successful Re-tests: The fact that the stock has "re-tested" this breakout level multiple times and held above it confirms that the previous resistance has now flipped to support .
💥 3. Today's Price Action (Confirmation)
- Volume Surge: Today's volume of 14.57 Million is significant. It confirms that the breakout is supported by real buying pressure, not just retail speculation.
- Price Stability: The stock surging ~1% while holding above the resistance-turned-support area indicates that buyers are comfortable accumulating at these higher prices.
📊 4. Technical Indicators
- EMAs: Short-term EMAs are in a PCO (Price Crossover) state across Monthly, Weekly, and Daily timeframes, showing synchronized bullish momentum.
- RSI: The Relative Strength Index is rising across all timeframes , confirming that momentum is expanding.
🎯 5. Future Scenarios & Targets
With the multi-year resistance broken, the stock has room to run.
- 🐂 Bullish Target: ₹315 . This is a logical structural target, aligning with the major swing highs from early 2022.
- 🛡️ Support (The Safety Net): Support at ₹254 is the critical "line in the sand." As long as the stock stays above the ₹260–₹254 zone, the bullish structure remains intact.
Conclusion
The setup is high-quality, a technical breakout supported by a fundamental turnaround . The consolidation above the breakout zone is healthy, and the path of least resistance is now towards ₹315 .

Consolidation breakdown in eicher motors1. Consolidation range breakdown at top
below 6720 stock will test its Fibonacci support levels
2. stock has given big rally upwards
3. stock may test its fib support levels and the continue upward movement
4. one can watch for swing downside movement with strict targets and sl

Consolidation happening in BBTC (Bombay burmah trading)1. is having consolidation pattern between 1750 - 2100 levels
2. One can watch for breakout above 2100 with good Risk : Reward
3. stock has give strong results attracting buyers and accumulation seen at 1850 levels
with strong buyer coming taking stock to 2050 levels in single day
4. stock may test its all time high if breaches 2400 levels

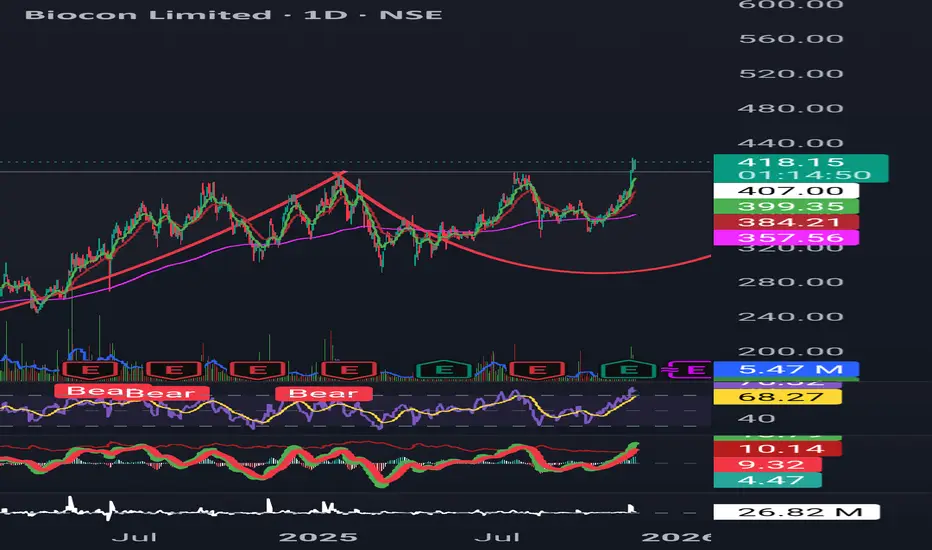
Biocon breaks out of 4-year consolidationStructure: Breakout from a long-term 4-year consolidation base
Volume: Strong expansion indicating institutional participation
Momentum:
RSI > 70 and holding → bullish trend zone
MACD positive and rising → trend confirmation
Trend:
9 EMA > 21 EMA > 200 EMA → multi-timeframe trend alignment
Sector Strength:
Pharma sector outperforming (Sun Pharma, JB Chem, Lupin, Biocon)
Broad-based buying visible across sector
Bias: Bullish as long as price sustains above breakout levels
Invalidation: Close back below breakout zone or loss of EMA/MACD trend
BUY TODAY SELL TOMORROW for 5%DON’T HAVE TIME TO MANAGE YOUR TRADES?
- Take BTST trades at 3:25 pm every day
- Try to exit by taking 4-7% profit of each trade
- SL can also be maintained as closing below the low of the breakout candle
Now, why do I prefer BTST over swing trades? The primary reason is that I have observed that 90% of the stocks give most of the movement in just 1-2 days and the rest of the time they either consolidate or fall
Consolidated Breakout in CCL
BUY TODAY SELL TOMORROW for 5%

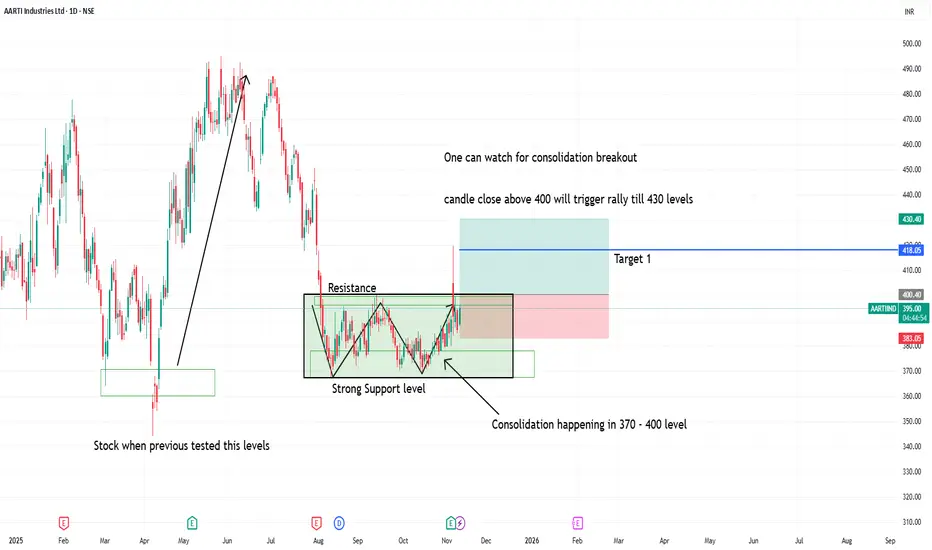
Watch for consolidation breakout in aarti industries1. Above 400 daily candle close will give strength to buyers to reach 430 level targets
2. Stock previously tested support levels gave big upside movement.
3. With good R:R one can watch for upside movement
4. normally the range of consolidation is target after breakout
if 30 points is consolidation range then target will 30 points after the consolidation breakout
Yatra Online (D): Strongly Bullish, Fundamentally-Driven BOThis is a high-conviction breakout, driven by explosive quarterly earnings. The stock has successfully broken its short-term consolidation but was temporarily rejected at its multi-year high. The underlying momentum is exceptionally strong.
🚀 1. The Fundamental Catalyst (The "Why")
The technicals are being driven by fundamentals. Today's +11.88% surge on massive 35.31 Million volume is a direct response to Yatra's record-breaking Q2 2026 earnings , which featured:
- Net Profit up 96% year-over-year.
- Revenue up 48% year-over-year.
- A raised full-year EBITDA guidance from the company.
📈 2. The Long-Term Context (The Setup)
- The Bottom & Reversal: After making its all-time low in March 2025 , the stock has been in a strong, sustained uptrend.
- The Consolidation: From August 2025, the stock entered a sideways trend, building a base for its next move. Volume was declining during this period—a classic sign of accumulation.
🎯 3. Today's Action (The "Two-Resistance Battle")
Today's price action was a textbook example of a breakout hitting two resistance levels:
- Resistance 1 (CLEARED): The short-term horizontal resistance from September 2025 (at ~₹172 ). The stock decisively broke and closed above this level.
- Resistance 2 (REJECTED): The long-term horizontal resistance from January 2024 (the previous multi-year high). The stock breached this level intraday to make a new ATH, but failed to close above it . This is a key sign of selling pressure or profit-taking at the old high.
📊 4. Key Technical Indicators
Indicator analysis confirms the bullish power across all timeframes:
- RSI: The Relative Strength Index is rising on the Daily, Weekly, and Monthly charts .
- EMAs: The short-term Exponential Moving Averages are in a "PCO" (Price Crossover) state on all three timeframes .
🧠 5. Future Scenarios & Key Levels to Watch
The path forward is now clearly defined by the two resistance levels identified.
🐂 The Bullish Case (Confirmation)
- Trigger: The stock must now get a decisive daily close above the long-term resistance (the Jan 2024 high it was rejected from today).
- Target: Once it clears that final hurdle, the path is open to price target of ₹205 .
🐻 The Pullback Case (Healthy Re-test)
- Trigger: If the stock is unable to continue the immediate momentum (due to the rejection) and pulls back.
- Target: The price will likely fall to re-test the resistance-turned-support at ₹172 . A "bounce" off this level would be a textbook, healthy confirmation of the breakout and a new buying opportunity.

Suzlon (W): Cautiously Bullish, Pending BreakoutThis is a classic "wait and watch" scenario. The stock is coiling in a major, year-long consolidation pattern, and the pressure is building. A powerful fundamental catalyst (record-breaking results) is now meeting a critical technical resistance, setting the stage for a significant move.
📈 1. The Long-Term Context
- The Run-Up: After hitting its all-time low in March 2020, the stock has been in a massive, multi-year uptrend, which paused in September 2024.
- The Pattern: The stock has been consolidating in a Symmetrical Triangle for over a year. This pattern indicates a period of indecision and contracting volatility—a "coiling spring" before its next major trend.
- The Foundation: The long-term trend remains bullish, supported by an active Golden Cross (50/200 SMA) on both the Weekly and Monthly charts .
🚀 2. The Current Setup (The Decisive Hurdles)
The stock is currently squeezed between two key resistance levels that must be broken:
1. A Short-Term Horizontal Resistance: A minor "lid" formed around ₹59-₹61 .
2. The Primary Angular Resistance: The main, multi-month downtrend line that forms the top of the Symmetrical Triangle.
The stock must first break the short-term horizontal level to gain the momentum needed to challenge the main triangle.
📊 3. Indicators & Catalysts
Conflicting indicators are observed which is the key. This is a classic feature of a consolidation phase:
- Short-Term (Weak): The RSI is down (currently in neutral/sell territory), and the short-term EMAs are not yet in a PCO state . This shows the immediate price action is choppy and lacks momentum.
- Long-Term (Strong): The active Golden Cross on higher timeframes shows the underlying trend is still firmly bullish.
- The Catalyst: The "good results" are a massive fundamental driver. The company just reported its highest-ever quarterly net profit (a 539% YoY increase) and a record 85% revenue jump . This provides a strong fundamental case for the triangle to break to the upside .
🎯 4. Future Scenarios & Key Levels to Watch
This is a "wait for confirmation" setup.
🐂 The Bullish Case (Two-Step Breakout)
- Trigger 1 (Short-Term): A decisive, high-volume breakout and close above the horizontal resistance (₹61) .
- Target 1: This would likely trigger a quick move to the first target of ₹65 .
- Trigger 2 (Long-Term): A sustained move that breaks the main angular resistance of the triangle.
- Target 2: This confirms the end of the year-long consolidation and opens the door to long-term target of ₹74 .
🐻 The Bearish Case (Breakdown)
- Trigger: If the stock fails to break out (due to weak short-term momentum) and instead breaks the triangle's support .
- Target: The price would likely fall to retest the recent support level, which is the identified zone of ₹51 - ₹53 .
