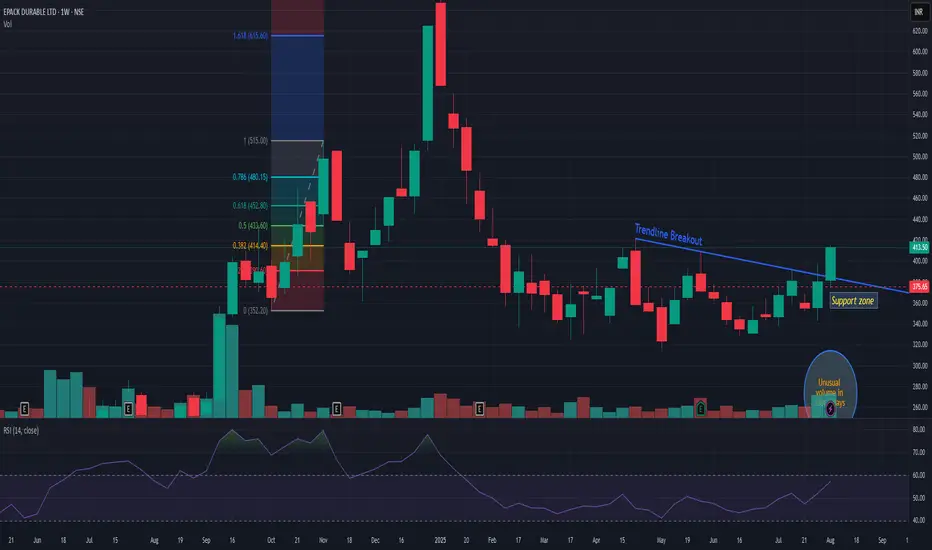
EPACKEPACK showing good strength after long bearish and then consolidation zone. It has been consolidating since February after steep fall from 660 levels. Now 390 is very strong support zone. So closing below it may change my view. On upper side I can see 510/85 resistance zone.
Consolidation-breakout
UltraTech Cement | Pullback Opportunity after Breakout?Description:
- After breaking out of a consolidation zone, UltraTech Cement is showing a controlled throwback towards prior resistance, now acting as support.
- Weekly structure remains intact with sloping EMAs and positive momentum.
- Daily & Hourly charts show minor weakness but no structural breakdown.
- EFI suggests lower TF selling pressure, while weekly remains stable.
📌 Entry Zone: ₹12,037
📉 Stoploss: ₹11,850 (ATR-based)
🎯 Targets: ₹12,937 → ₹13,139 → ₹13,427
Cement sector is gaining strength in the broader infra rally — watching for confirmation on bounce from support.

PAYTM, BIG BULLISH BREAKOUT HAPPENINGPaytm, one9 communication 1065, has given highest weekly closing in last 30 months. Stock ready for 1250/1320/1450/1600.
Good horizontal trendline resistance taken out at 1020 levels. Volumes are supportive
Trade negates if closed below 940 levels on weekly closing basis. Bigger Stop at 860 levels.

GLOBUS SPIRITS, POTENTIAL BIG BREAKOUT STOCKGlobus spirits (W), Buy Globus spirit above 1390 levels, add more above 1440 levels.
Stock has been consolidating from the last 24 months in range of 650 points and looking for breakout.
Potential target is 1800 to 2100
Trade negates if it falls below 1340 levels on weekly closing basis after breakout trade opens. Avoid bigger stops
PAYTM READY FOR BIG BULL RUNPaytm, one9 communication 1065, has given highest weekly closing in last 30 months. Stock ready for 1250/1320/1450/1600/1800
Good horizontal trendline resistance taken out at 1020 levels. Volumes are supportive
Trade negates if closed below 940 levels on weekly closing basis. Bigger stop at 860 levels.

Dhanuka Agri.: Consolidation BreakoutDhanuka Agri.: Consolidation Breakout. CMP 1779.
Resistance at 1861/1926
Support at 1747/1648

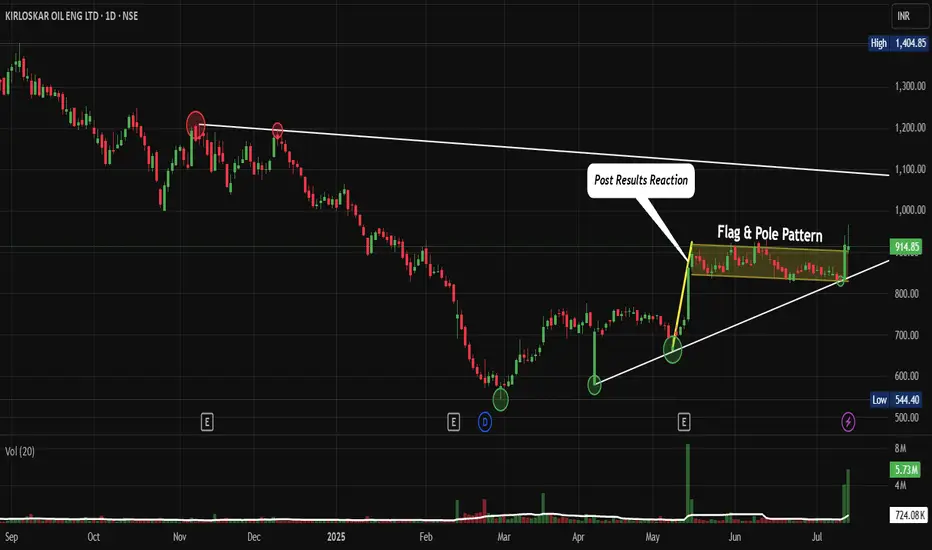
KIRLOSENG: Post-Results Breakout and Consolidation. F&P PatternNSE:KIRLOSENG : How This Hidden Gem Could Be Your Next Big Winner After Post-Results Breakout and Consolidation Let's Analyze in my "Chart of the Week"
Price Action:
- The stock shows a classic recovery pattern from March 2025 lows around ₹590-600
- Current price at ₹914.85 represents a significant 52% recovery from the March bottom
- The stock has been forming higher lows since March, indicating underlying strength
- Recent breakout above the ₹850 resistance level with strong volume confirmation
Volume Spread Analysis:
- Volume spike during the recent breakout suggests institutional participation
- The post-results reaction shows a healthy volume of 724.08K against a 20-day average of 5.73M
- Volume patterns indicate an accumulation phase during the consolidation period from April to June
Base Formation:
- Primary base established between ₹590-650 (March 2025 lows)
- Secondary base formed around the ₹750-800 level during April-May consolidation
- Current base being built around ₹880-920 after the recent breakout
Support and Resistance Levels:
Key Support Levels:
- Immediate support: ₹880-890 (recent breakout level)
- Strong support: ₹830-850 (previous resistance turned support)
- Major support: ₹780-800 (secondary base level)
- Ultimate support: ₹590-650 (primary base)
Resistance Levels:
- Immediate resistance: ₹950-970
- Major resistance: ₹1,000-1,020 (psychological level)
- Long-term resistance: ₹1,100-1,150 (previous highs from late 2024)
- Ultimate target: ₹1,400+ (all-time high region)
Technical Patterns:
Flag and Pole Pattern:
- The chart clearly shows a flag and pole formation
- The flag represents the consolidation phase from May to June 2025
- Recent breakout confirms the pattern completion with an upward trajectory
Ascending Triangle:
- The stock has formed an ascending triangle pattern with higher lows and consistent resistance around ₹850
- The breakout above this level validates the bullish continuation pattern
Post-Results Reaction:
- Kirloskar Oil Engines shares settled slightly, trading at Rs 803.75, representing a 9.36% increase, while the BSE Sensex was up by 0.25%.
- The positive reaction to results indicates market confidence in the company's performance
Trade Setup:
Entry Strategy:
- Primary entry: ₹900-920 (current levels on any dip)
- Secondary entry: ₹880-890 (on pullback to support)
- Aggressive entry: ₹930-950 (on breakout above current resistance)
Entry Levels:
- Conservative traders: Wait for pullback to ₹880-890 support
- Moderate traders: Enter at current levels around ₹910-920
- Aggressive traders: Enter on a breakout above ₹950
Exit Strategy:
Target Levels:
- Target 1: ₹1,000 (8-10% upside)
- Target 2: ₹1,100 (18-20% upside)
- Target 3: ₹1,250 (35-40% upside)
- Ultimate target: ₹1,400+ (50%+ upside)
Exit Timing:
- Book 30% profits at Target 1
- Book 40% profits at Target 2
- Hold the remaining 30% for the ultimate target with a trailing stop loss
Risk Management:
Stop-Loss Levels:
- Conservative stop-loss: ₹850 (6-7% downside)
- Moderate stop-loss: ₹830 (8-9% downside)
- Aggressive stop-loss: ₹800 (11-12% downside)
Position Sizing:
- Risk per trade: Maximum 2% of portfolio
- Position size calculation: Portfolio value × 2% ÷ (Entry price - Stop loss)
- For ₹1,00,000 portfolio with entry at ₹910 and stop at ₹850: Position size = ₹2,000 ÷ ₹60 = 33 shares
Sectoral Backdrop:
Industrial Machinery Sector:
- The industrial machinery sector has been showing resilience amid economic recovery
- Infrastructure push by the government supports demand for engines and pumps
- Agricultural mechanization trends favour companies like NSE:KIRLOSENG
Market Position:
- The company caters to the agriculture, ... Clients (Marine, Defence, etc), After Sales Support, Retail Channel – Tractor spares, Oil, Batteries.
- Diversified revenue streams provide stability across economic cycles
Fundamental Backdrop:
Financial Performance:
- Netprofit is up for the last 2 quarters, 68 Cr → 127 Cr (in ₹)
- Revenue is up for the last 2 quarters, 1454 Cr → 1753 Cr (in ₹)
- As of 31-Mar-2025, Kirloskar Oil Engines has a trailing 12-month revenue of 6349 Cr
Market Valuation:
- Its current market cap is 13,289 Cr with 14.5 Cr shares.
- Stock is trading at 4.30 times its book value
- Promoter holding has decreased over the last 3 years: -18.3%
Growth Outlook:
- The B2B business grew 5 per cent year on year, and the B2C business also witnessed a double-digit growth of 14 per cent year on year
- Strong positioning in agriculture and industrial segments provides sustainable growth prospects
- The final dividend of Rs 4 per equity Share indicates management confidence
My Take:
Investment Rationale:
- Technical breakout supported by improving fundamentals
- Diversified business model reduces concentration risk
- Strong balance sheet with consistent profitability
- Attractive valuation after the recent correction from highs
The combination of technical breakout, improving fundamentals, and supportive sectoral trends makes NSE:KIRLOSENG an attractive investment opportunity for medium to long-term investors with appropriate risk management measures in place.
Keep in the Watchlist.
NO RECO. For Buy/Sell.
📌Thank you for exploring my idea! I hope you found it valuable.
🙏FOLLOW for more
👍BOOST if you found it useful.
✍️COMMENT below with your views.
Meanwhile, check out my other stock ideas on the right side until this trade is activated. I would love your feedback.
Disclaimer: "I am not a SEBI REGISTERED RESEARCH ANALYST AND INVESTMENT ADVISER."
This analysis is intended solely for informational and educational purposes and should not be interpreted as financial advice. It is advisable to consult a qualified financial advisor or conduct thorough research before making investment decisions.
JP Power: Breaking Out After 6-Month ConsolidationNSE:JPPOWER : Breaking Out After 6-Month Consolidation
Price Action Analysis:
• Long-term Trend: Stock has been in a prolonged downtrend from highs of ₹23.77, finding support around ₹12.36
• Recent Pattern: Clear consolidation phase from December 2024 to May 2025 within a rectangular range
• Current Movement: Sharp breakout from consolidation with strong volume confirmation
• Momentum: Bullish momentum building with gap-up opening and sustained buying
Volume Analysis:
• Volume Pattern: Significant volume spike during current breakout session
• Volume Confirmation: Current volume of 195.09M vs average of 41.29M indicates strong institutional participation
• Historical Volume: Notable volume spikes during previous breakout attempts in October 2024
• Volume Quality: Expansion on up-moves and contraction during consolidation phases
Key Technical Levels:
Support Levels:
• Immediate Support: ₹16.35 (previous resistance turned support)
• Strong Support: ₹15.50-16.00 (consolidation base)
• Critical Support: ₹12.36 (52-week low and major support zone)
• Long-term Support: ₹12.00-12.50 (multiple bounce zone)
Resistance Levels:
• Immediate Resistance: ₹18.50-19.00 (previous swing high zone)
• Major Resistance: ₹20.00-20.50 (psychological level and previous rejection zone)
• Target Resistance: ₹22.00-23.00 (measured move target)
• Ultimate Resistance: ₹23.77 (52-week high)
Base Formation:
• Base Type: Rectangular consolidation base
• Base Duration: Approximately 6 months (December 2024 to May 2025)
• Base Range: ₹12.36 to ₹16.35
• Base Depth: Approximately 25% from highs
• Base Quality: Well-defined with multiple tests of support and resistance
Technical Patterns Identified:
Primary Pattern:
• Pattern: Rectangle/Box Consolidation with Breakout
• Formation Period: December 2024 to May 2025
• Breakout Confirmation: Volume-backed breakout above ₹16.35
• Pattern Reliability: High, given the extended consolidation period
Trade Setup:
Entry Strategy:
• Primary Entry: ₹17.50-17.80 (current levels with momentum)
• Pullback Entry: ₹16.50-17.00 (if stock retraces to test breakout level)
• Aggressive Entry: ₹18.00+ (breakout continuation trade)
• Conservative Entry: Wait for weekly close above ₹17.50 for confirmation
Exit Levels:
• Target 1: ₹19.50-20.00 (10-12% upside, resistance zone)
• Target 2: ₹22.00-22.50 (25-27% upside, measured move)
• Target 3: ₹24.00+ (35%+ upside, extension target)
• Trail Stop: Use a 15-20% trailing stop once the first target is achieved.
Stop Loss Strategy:
• Initial Stop Loss: ₹15.50 (below consolidation base)
• Risk: 12-15% from current levels
• Tight Stop: ₹16.00 (for aggressive traders)
• Weekly Close Stop: Below ₹15.80 on weekly closing basis
Position Sizing & Risk Management:
Position Sizing Guidelines:
• Conservative Approach: 2-3% of portfolio (given sector risks)
• Moderate Approach: 3-5% of portfolio
• Aggressive Approach: 5-7% of portfolio (only for risk-tolerant investors)
• Maximum Allocation: Not more than 10% due to sector concentration risk
Risk Management Framework:
• Risk per Trade: Limit to 1-2% of total capital
• Reward-to-Risk Ratio: Minimum 1:2, targeting 1:3
• Portfolio Heat: Consider correlation with other power/infrastructure stocks
• Sector Exposure: Monitor total exposure to the power sector
Sectoral Backdrop:
Power Sector Overview:
• Sector Trend: Power sector showing signs of revival with government's focus on renewable energy
• Policy Support: Government initiatives for power infrastructure development
• Demand Scenario: Growing power demand with industrial recovery
• Investment Climate: Increased capex allocation for power infrastructure
Industry Dynamics:
• Renewable Push: Shift towards renewable energy, creating opportunities
• Transmission Focus: Grid strengthening and transmission line expansion
• Financial Health: Gradual improvement in power sector financials
• Regulatory Environment: Supportive policies for power sector growth
Fundamental Backdrop:
Company Profile:
• Business: Power generation, transmission, and infrastructure development
• Promoter Group: Jaiprakash Associates Group
• Market Cap: Mid-cap power sector player
• Operational Status: Multiple power projects across different states
Key Fundamental Factors:
• Debt Levels: High debt burden remains a key concern
• Asset Quality: Mix of operational and under-construction assets
• Revenue Visibility: Power purchase agreements providing revenue stability
• Execution Risk: Project completion and commissioning risks
• Financial Stress: Historical financial challenges and restructuring efforts
Recent Developments:
• Debt Resolution: Ongoing efforts for debt restructuring and resolution
• Project Status: Updates on project commissioning and operations
• Regulatory Approvals: Progress on pending regulatory clearances
• Strategic Initiatives: Focus on operational efficiency and cost optimization
Risk Factors:
Technical Risks:
• False Breakout: Risk of failure at higher resistance levels
• Volume Sustainability: Need for sustained volume support
• Market Sentiment: Dependency on overall market conditions
• Sector Rotation: Risk of sector-specific selling pressure
Fundamental Risks:
• High Leverage: Elevated debt levels impacting financial flexibility
• Execution Risk: Project execution and commissioning challenges
• Regulatory Risk: Changes in power sector policies
• Liquidity Risk: Working capital and cash flow management issues
My Take:
My Technical Outlook:
• Short-term: Bullish momentum with breakout confirmation
• Medium-term: Potential for 25-30% upside if breakout sustains
• Long-term: Dependent on fundamental improvements and sector revival
My Investment Recommendation:
• Recommendation: Cautious Buy for technical traders
• Time Horizon: 3-6 months for technical targets
• Suitability: Risk-tolerant investors with sector understanding
• Monitoring: Close watch on volume patterns and sector developments
This analysis is based on technical patterns and should be combined with thorough fundamental research and professional advice before making investment decisions.
Keep in the Watchlist.
NO RECO. For Buy/Sell.
📌Thank you for exploring my idea! I hope you found it valuable.
🙏FOLLOW for more
👍BOOST if you found it useful.
✍️COMMENT below with your views.
Meanwhile, check out my other stock ideas on the right side until this trade is activated. I would love your feedback.
Disclaimer: "I am not a SEBI REGISTERED RESEARCH ANALYST AND INVESTMENT ADVISER."
This analysis is intended solely for informational and educational purposes and should not be interpreted as financial advice. It is advisable to consult a qualified financial advisor or conduct thorough research before making investment decisions.

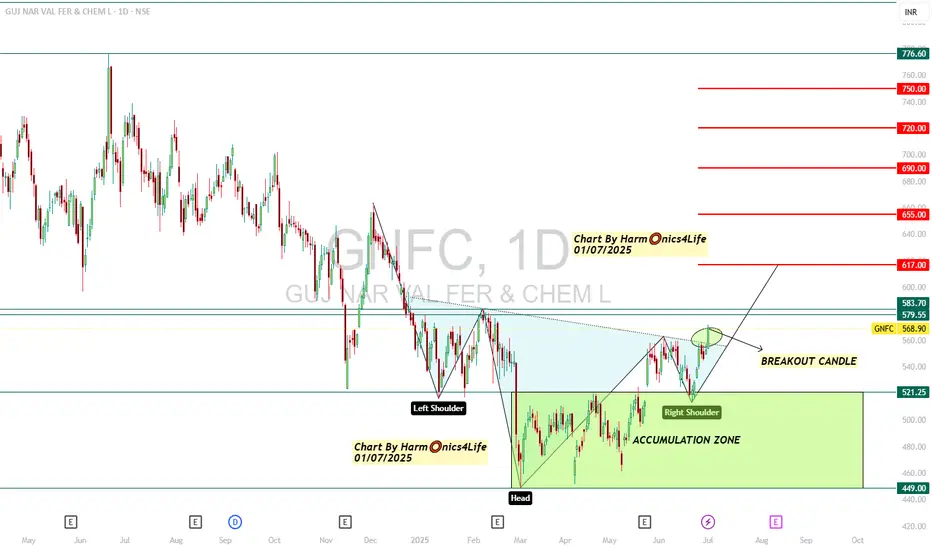
GNFC INVERTED HEAD AND SHOULDER BREAKOUT !NSE:GNFC (Gujarat Narmada Valley Fertilizers & Chemicals)
LTP 568.9
Inverted Head & Shoulder breakout on chart !
Buy here and accumulate in zone of 520---450
For Target🎯 617 / 625 / 655++
#Positional Target🎯 690 / 720 / 750++
==============================================
Positional Breakout chart
===============================================
Technical Setup:
1) More than 30% down from recent highs of 815 levels
2) Inverted Head & Shoulder breakout on chart
3) Came out of a tight consolidation range
4) Available at cheap valuations
5) Indication of Bottoming Out with High Volumes !!!
===============================================
Regards,
Harm⭕️nics4Life
01/07/2025
===============================================
Disclaimer & Risk Warning
I am not sebi registered analyst.
My studies shared here are for educational purposes .. Do Consult Your Financial advisor Before Taking any Trade.....Good Luck!
Midhani: Breaks Out of Consolidation: Ready for Lift-Off ?NSE:MIDHANI Breaks Out of Consolidation: A Technical Powerhouse Ready for Lift-Off ?
Price Action Analysis:
- Current Price: ₹463.60 (as of June 23, 2025)
- Price Movement: +20.30 points (+4.58%) on the day
- The stock has demonstrated a spectacular breakout from a lengthy consolidation phase
- Sharp vertical surge from ₹340 levels to current highs of ₹463.60
- Strong momentum evident with substantial volume expansion
Volume Spread Analysis:
- Current Volume: 6.03M shares (significantly elevated)
- Average Volume: 2.36M shares
- Volume surge of approximately 155% above average indicates strong institutional participation
- Volume spike during breakout confirms genuine buying interest
- The previous consolidation period showed declining volume, typical of accumulation phases
Key Technical Levels:
Base Formation:
- Primary Base: ₹220-₹340 range (March 2025 to May 2025)
- Base Duration: Approximately 3 months
- Base Type: Cup and Handle pattern with rectangular consolidation
- Base Depth: From ₹463 high to ₹220 low (52.5% correction)
- Quality: High-quality base with proper volume characteristics
Support Levels:
- Immediate Support: ₹420-₹440 (previous resistance turned support)
- Secondary Support: ₹380-₹400 (50% retracement of recent move)
- Major Support: ₹340-₹360 (breakout point and upper base boundary)
- Ultimate Support: ₹280-₹300 (middle of base formation)
Resistance Levels:
- Immediate Resistance: ₹480-₹500 (psychological round numbers)
- Next Resistance: ₹520-₹540 (measured move from base)
- Major Resistance: ₹580-₹600 (long-term projection target)
Technical Patterns Identified:
Primary Pattern:
- Cup and Handle Formation: Completed with successful breakout
- Handle Formation: Tight consolidation between ₹320-₹340 levels
- Breakout Volume: Exceptional with 155% above average volume
Secondary Patterns:
- Ascending Triangle: Formed during the handle phase
- Flag Pattern: Brief consolidation after initial breakout surge
- Higher Lows: Consistent pattern throughout base formation
Trend Analysis:
- Primary Trend: Strongly Bullish (breakout confirmed)
- Intermediate Trend: Bullish momentum accelerating
- Short-term Trend: Overbought but maintaining strength
Trade Setup and Strategy:
Entry Levels:
- Aggressive Entry: ₹445-₹460 (current levels on minor pullbacks)
- Conservative Entry: ₹420-₹440 (on deeper retracement to support)
- Breakout Entry: ₹350-₹360 (for those who missed the initial move)
Exit Levels:
- Target 1: ₹500 (near-term psychological resistance)
- Target 2: ₹540 (measured move from base)
- Target 3: ₹600 (extended target based on base width)
Stop-Loss Strategy:
- Tight Stop: ₹420 (for aggressive entries)
- Standard Stop: ₹380 (below key support zone)
- Conservative Stop: ₹340 (below breakout point)
Position Sizing and Risk Management:
Position Sizing Guidelines:
- Conservative Allocation: 2-3% of portfolio
- Moderate Allocation: 3-5% of portfolio
- Aggressive Allocation: 5-7% of portfolio (for high-risk tolerance)
Risk Management Framework:
- Maximum Risk per Trade: 2% of total capital
- Risk-Reward Ratio: Minimum 1:3 for all entries
- Scaling Strategy: Add positions on pullbacks to support levels
- Profit Booking: Book 30% at Target 1, 40% at Target 2, 30% at Target 3
Portfolio Considerations:
- Sector Allocation: Limit defence/aerospace exposure to 10-15% of portfolio
- Correlation Risk: Monitor other defence stocks for overexposure
- Market Timing: Consider broader market conditions before position sizing
Sectoral and Fundamental Backdrop:
Defence and Aerospace Sector Overview:
- India's defence budget targeting ₹1.75 lakh crore turnover by 2025
- The government focus on Atmanirbharta (self-reliance) in defence manufacturing
- The global aerospace and defence market is showing a strong growth trajectory
- Space economy growing at 7.4% year-over-year globally
Company Fundamentals:
- Market Cap: ₹8,693 crore
- Revenue: ₹1,074 crore (FY2025)
- Net Profit: ₹110 crore with 21.28% growth in Q4 FY2025
- Promoter Holding: 74% (strong management confidence)
- Specialisation: High-grade alloys, aerospace materials, defence components
Recent Developments:
- Strong presence at Aero India 2025 with indigenous aerospace materials
- Launch of High-Temperature Nickel Alloy Billets and Superni 41 Plates
- Strategic partnerships with HAL, GTRE, ADA, and the Indian Air Force
- Focus on critical materials for defence and aerospace applications
Industry Catalysts:
- Increasing defence procurement by the Indian government
- Export opportunities in aerospace components
- Technological advancement in the space and defence sectors
- The government push for indigenous manufacturing capabilities
Risk Factors and Considerations:
Technical Risks:
- Overbought conditions in the near term may lead to consolidation
- High volatility expected due to recent breakout
- Potential for profit booking at psychological resistance levels
Fundamental Risks:
- Dependence on government orders and policy changes
- Competition from private sector players
- Raw material cost fluctuations
- Execution risks in scaling up production
Market Risks:
- Broader market correction could impact momentum
- Sector rotation away from defence stocks
- Geopolitical factors affecting defence spending
- Interest rate environment impacting valuations
My Take:
NSE:MIDHANI presents a compelling technical setup with a successful breakout from a well-formed base pattern. The combination of strong volume confirmation, favourable sector dynamics, and improving fundamentals creates an attractive investment opportunity. However, investors should be mindful of the recent sharp move and consider appropriate position sizing and risk management strategies.
The stock appears well-positioned to benefit from India's growing defence and aerospace sector, supported by government initiatives and increasing focus on indigenous manufacturing capabilities. Technical indicators suggest further upside potential, making it suitable for both momentum and growth-oriented investment strategies.
Keep in the Watchlist.
NO RECO. For Buy/Sell.
📌Thank you for exploring my idea! I hope you found it valuable.
🙏FOLLOW for more
👍BOOST if you found it useful.
✍️COMMENT below with your views.
Meanwhile, check out my other stock ideas on the right side until this trade is activated. I would love your feedback.
Disclaimer: "I am not a SEBI REGISTERED RESEARCH ANALYST AND INVESTMENT ADVISER."
This analysis is intended solely for informational and educational purposes and should not be interpreted as financial advice. It is advisable to consult a qualified financial advisor or conduct thorough research before making investment decisions.

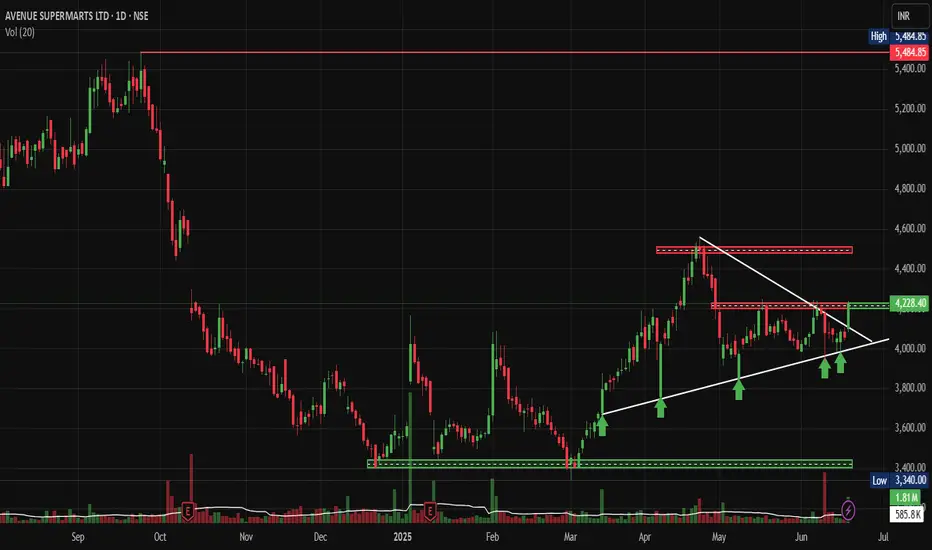
DMART: Technical Breakout Signals Major Rally AheadNSE:DMART Technical Breakout Signals Major Rally Ahead after news of its Entry in Uttar Pradesh as the First Store Opened in Agra.
Price Action:
• Current Price: ₹4,228.40 (up 4.17% or ₹169.30)
• 52-Week Range: ₹3,340 (Low) to ₹5,484.85 (High)
• Stock is trading in the upper half of its annual range, showing strong momentum
• Recent price action indicates a successful breakout from the consolidation phase
Volume Spread Analysis:
• Volume spike visible during recent breakout sessions
• Above-average volume of 585.8K shares traded, confirming institutional participation
• Volume pattern supports the bullish price movement
• Higher volume on green candles indicates genuine buying interest
Key Technical Levels:
Support Levels:
• Primary Support: ₹4,100-4,150 (recent breakout level)
• Secondary Support: ₹3,900-3,950 (previous resistance turned support)
• Major Support: ₹3,600-3,700 (demand zone from March-April consolidation)
• Critical Support: ₹3,400-3,450 (psychological level and volume-based support)
Resistance Levels:
• Immediate Resistance: ₹4,400-4,450 (supply zone marked on chart)
• Major Resistance: ₹4,600-4,700 (previous swing high area)
• Target Resistance: ₹5,200-5,300 (approaching 52-week high zone)
• Ultimate Target: ₹5,484 (52-week high)
Base Formation:
• Stock formed a strong accumulation base between December 2024 and April 2025
• Base depth: Approximately 25-30% from peak to trough
• Duration: A 5-month consolidation period indicates institutional accumulation
• Base breakout occurred with strong volume confirmation in May 2025
Technical Patterns:
• Cup and Handle formation visible from October 2024 to May 2025
• Ascending triangle pattern during the consolidation phase
• Higher lows formation indicating strong underlying demand
• Breakout from falling wedge pattern in early May 2025
Trend Analysis:
• Primary Trend: Bullish (upward sloping trendline from December lows)
• Intermediate Trend: Bullish breakout from consolidation
• Short-term Trend: Strong upward momentum with minor pullback potential
Trade Setup:
Bull Case Scenario:
• Entry Strategy: Buy on dips approach recommended
• Momentum continues toward ₹4,600-4,800 levels
• Volume expansion supports further upside
• Sector rotation favouring retail stocks
Entry Levels:
• Aggressive Entry: ₹4,200-4,250 (current market price area)
• Conservative Entry: ₹4,050-4,100 (on pullback to support)
• Ideal Entry: ₹4,000-4,050 (strong support retest)
Exit Levels:
• Partial Profit Booking: ₹4,500-4,600 (book 30-40% position)
• Second Target: ₹4,800-4,900 (book another 30-40%)
• Final Target: ₹5,200-5,300 (ride remaining 20-30% position)
Stop-Loss Strategy:
• Initial Stop-Loss: ₹3,950 (below recent support)
• Trailing Stop-Loss: Trail stops by ₹150-200 as price advances
• Final Stop-Loss: ₹3,800 (if major support breaks)
Risk Management:
Position Sizing:
• Conservative Allocation: 2-3% of total portfolio
• Moderate Allocation: 3-5% of total portfolio
• Aggressive Allocation: 5-7% of total portfolio (only for high-conviction traders)
Risk Factors:
• Market volatility during the quarterly results season
• Retail sector sensitivity to economic cycles
• High valuations may limit upside potential
• Profit booking pressure near previous highs
Risk Mitigation:
• Diversify across multiple retail stocks
• Use a staggered entry approach
• Maintain strict stop-loss discipline
• Monitor sector rotation trends
Sectoral Backdrop:
Retail Sector Overview:
• The Indian retail sector is following the "Everyday Low Cost - Everyday Low Price" strategy
• Strong, organised retail penetration growth expected
• Consumer spending recovery supporting sector growth
• E-commerce competition intensifying, but offline retail remains resilient
Sector Catalysts:
• Festival season approaching (positive for retail)
• Rural consumption recovery expected
• Urban consumption remains steady
• Government policies supporting organised retail
Fundamental Backdrop:
Company Overview:
• Avenue Supermarts follows a competitive procurement, operational efficiency, and cost-effective distribution strategy
• Market Cap: ₹2,75,237 Crores with almost debt-free status
• Leading hypermarket chain with strong brand presence
Financial Performance:
• Q4 FY25: Sales of ₹14,872 crore (16.9% YoY growth)
• Revenue projected to grow 15% to ₹68,000 to ₹70,000 crore
Business Strengths:
• Strong operational efficiency and supply chain management
• Consistent store expansion strategy
• High customer loyalty and repeat business
• Strong cash generation and a debt-free balance sheet
Growth Drivers:
• New store openings in Tier-2 and Tier-3 cities
• Same-store sales growth improvement
• Category expansion and private label growth
• Digital initiatives and omnichannel presence
My Take:
NSE:DMART presents a compelling technical setup with strong fundamental backing. The stock has successfully broken out from a 5-month consolidation base with volume confirmation. Risk-reward ratio favours bulls with proper position sizing and stop-loss management. Traders should consider entering on minor pullbacks, while investors can accumulate on any meaningful corrections toward support levels.
Keep in the Watchlist.
NO RECO. For Buy/Sell.
📌Thank you for exploring my idea! I hope you found it valuable.
🙏FOLLOW for more
👍BOOST if you found it useful.
✍️COMMENT below with your views.
Meanwhile, check out my other stock ideas on the right side until this trade is activated. I would love your feedback.
Disclaimer: "I am not a SEBI REGISTERED RESEARCH ANALYST AND INVESTMENT ADVISER."
This analysis is intended solely for informational and educational purposes and should not be interpreted as financial advice. It is advisable to consult a qualified financial advisor or conduct thorough research before making investment decisions.
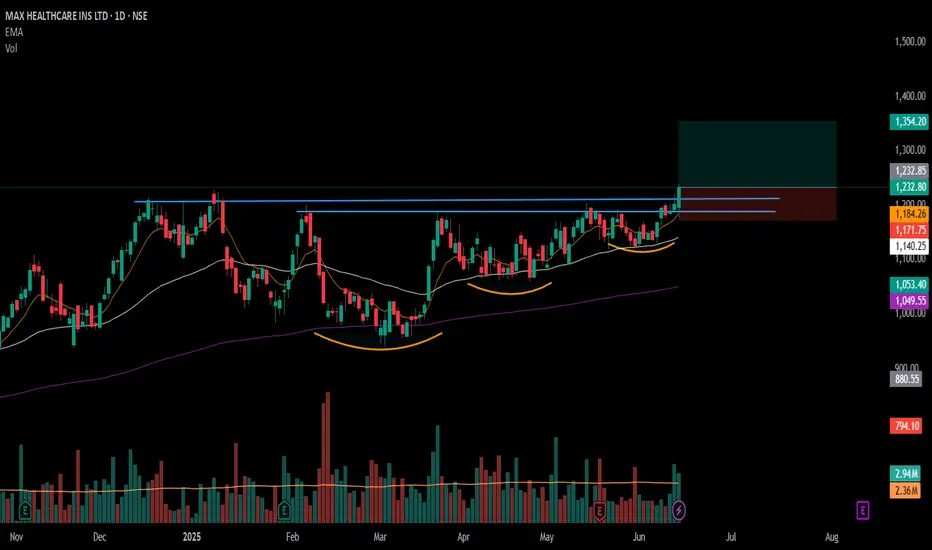
MAXHEALTH - 7 months consolidation VCP Breakout - ATHMAXHEALTH
1) 7 months consolidation - volatility contraction pattern breakout and Closed at it's All Time High. A potential up move is possible.
2) Pharma and Healthcare index looks solid to support Pharma stocks.

#MAXHEALTH - VCP Set up Breakout in Daily Time Frame📊 Script: MAXHEALTH
Key highlights: 💡⚡
📈 VCP Set up Breakout in Daily Time Frame.
📈 Price consolidating near Resistance, then Breakout.
📈 Volume spike seen during Breakout.
📈 MACD Cross
📈 Can go for a swing trade
BUY ONLY ABOVE 1235 DCB
⏱️ C.M.P 📑💰- 1232.80
🟢 Target 🎯🏆 – 11%
⚠️ Stoploss ☠️🚫 – 5%
⚠️ Important: Market conditions are Okish, Position size 50% per Trade. Protect Capital Always
⚠️ Important: Always Exit the trade before any Event.
⚠️ Important: Always maintain your Risk:Reward Ratio as 1:2, with this RR, you only need a 33% win rate to Breakeven.
✅Like and follow to never miss a new idea!✅
Disclaimer: I am not SEBI Registered Advisor. My posts are purely for training and educational purposes.
Eat🍜 Sleep😴 TradingView📈 Repeat 🔁
Happy learning with MMT. Cheers!🥂
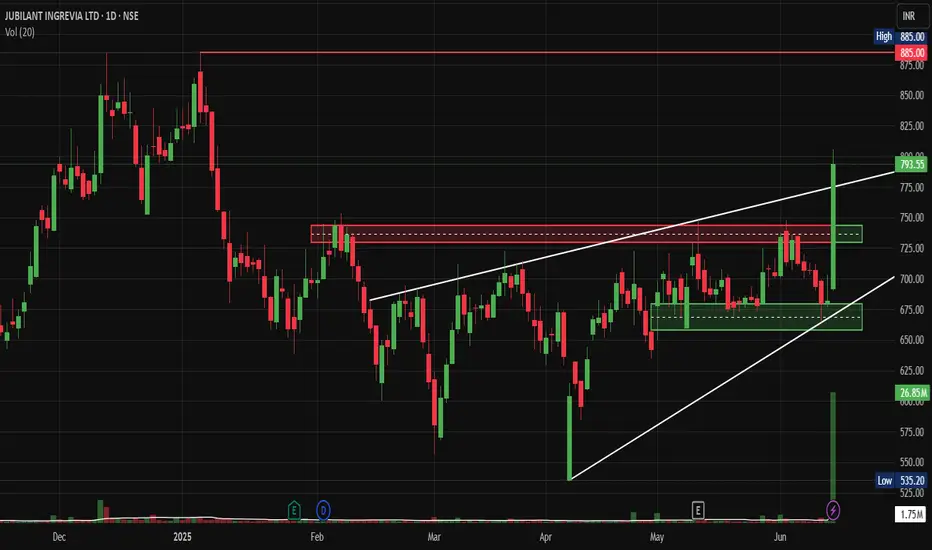
Jubilant Ingrevia: Broke Out after Stake Sell from PromotersNSE:JUBLINGREA Just Broke Out Big after Prabhudas Lilladher gave Hold Rating with a target of Rs 713 and Stake Sell from Promoters
Technical Chart Pattern:
• The stock displays a classic ascending triangle pattern formation spanning from February to June 2025
• Multiple higher lows connected by an ascending trend line (white diagonal support)
• Horizontal resistance zone around ₹735-740 levels acting as the upper boundary
• Recent breakout above the triangle pattern with strong volume confirmation
Key Support and Resistance Levels:
• Primary Support: ₹675-685 (previous resistance turned support)
• Secondary Support: ₹650-660 (trend line support)
• Major Support: ₹535-550 (swing low from March)
• Immediate Resistance: ₹800-810 (psychological level)
• Major Resistance: ₹885 (all-time high marked on chart)
Base Formation Analysis:
• Well-defined base formation between ₹650-740 levels over 4 months
• The consolidation phase showed declining volatility, indicating accumulation
• Multiple tests of resistance at ₹735-740 showing supply absorption
• Base depth of approximately 15-20% from the highs, indicating healthy correction.
Volume Spread Analysis:
Volume Characteristics:
• Significant volume spike during the recent breakout (26.85M vs average 1.75M)
• Volume expansion during upward moves and contraction during pullbacks
• Strong institutional participation is evident from the volume profile
• Volume-price correlation remains positive, supporting the uptrend
Volume Indicators:
• Above-average volume during breakout confirms genuine demand
• Recent sessions show sustained higher volumes, indicating continued interest
• No distribution patterns are visible in volume analysis
Trade Setup:
Entry Strategy:
• Primary Entry: ₹790-800 on any pullback to the breakout zone
• Aggressive Entry: Current market price around ₹799 with tight stops
• Conservative Entry: Wait for retest of ₹740-750 resistance-turned-support
• Scale-in approach recommended given the momentum
Exit Levels:
• Target 1: ₹850 (measuring the triangle height projection)
• Target 2: ₹885 (previous all-time high)
• Target 3: ₹920-950 (extended projection based on base depth)
• Trail stops above ₹850 for position management
Stop Loss Placement:
• Initial Stop Loss: ₹735 (below breakout level)
• Revised Stop Loss: ₹750 (after first target achievement)
• Final Stop Loss: ₹780 (trailing stop for remaining position)
Risk Management Framework:
Position Sizing Guidelines:
• Risk 1-2% of portfolio capital per trade
• Position size calculation: (Account Size × Risk %) ÷ (Entry Price - Stop Loss)
• Maximum position should not exceed 3-5% of the total portfolio
• Consider reducing the size given recent volatility expansion
Risk Control Measures:
• Maintain risk-reward ratio of a minimum of 1:2
• Use partial profit booking at predetermined levels
• Avoid averaging down below stop loss levels
• Monitor sector rotation and market sentiment
Fundamental and Sectoral Backdrop:
Company Overview:
• Jubilant Ingrevia operates in Speciality Chemicals, Nutrition and Health Solutions, and Chemical Intermediates segments
• Global provider serving pharmaceutical, nutrition, agrochemical, and consumer industries with a focus on quality and customization
• Serves 15 of the top 20 Global Pharma & 7 of the top 10 Global Agrochemical companies as a leading low-cost provider
Recent Financial Performance:
• Net profit jumped 153.16% year-over-year to ₹74.05 Cr in Q4 2024-2025
• Q4 2025 revenue of 1,051 cr. down from INR1,074 cr. in Q4 FY24 with EBITDA of INR148 crores showing 42% year-on-year rise
• Market capitalization of 12,664 Cr. with trailing twelve-month revenue of 4,178 Cr.
Sectoral Dynamics:
• The speciality chemicals sector is benefiting from the China+1 strategy
• Increasing demand for pharmaceutical intermediates post-COVID
• The government push for self-reliance in chemical manufacturing
• Export opportunities in agrochemical intermediates are expanding globally
Key Fundamentals:
• The company shows a low return on equity of 9.24% over the last 3 years
• Analyst average share price target of ₹735
• Strong client base with global pharmaceutical and agrochemical giants
• Diversified product portfolio, reducing concentration risk
Market Outlook and Catalysts:
Positive Catalysts:
• Expansion in speciality chemicals capacity
• New product launches in the nutrition segment
• Increasing penetration in international markets
• Potential margin expansion through product mix improvement
Risk Factors:
• Raw material price volatility
• Regulatory changes in target markets
• Currency fluctuation impact on exports
• Competition from Chinese manufacturers
My Take:
This technical setup presents a compelling opportunity with the stock breaking out of a well-defined pattern, supported by strong fundamentals and favourable sector dynamics. The risk-reward profile appears attractive for traders and investors willing to manage position size appropriately.
Keep in the Watchlist.
NO RECO. For Buy/Sell.
📌Thank you for exploring my idea! I hope you found it valuable.
🙏FOLLOW for more
👍BOOST if you found it useful.
✍️COMMENT below with your views.
Meanwhile, check out my other stock ideas on the right side until this trade is activated. I would love your feedback.
Disclaimer: "I am not a SEBI REGISTERED RESEARCH ANALYST AND INVESTMENT ADVISER."
This analysis is intended solely for informational and educational purposes and should not be interpreted as financial advice. It is advisable to consult a qualified financial advisor or conduct thorough research before making investment decisions.
#WINDMACHIN – Swing Trade Setup Alert📊 #WINDMACHIN – Swing Trade Setup Alert
🔸 VCP setup spotted on the Daily Time Frame (DTF)
🔸 Volume spike observed
🔸 Price consolidating near Resistance (RT)
📌 If a breakout (BO) occurs with strong volume, it could present a solid swing trade opportunity.

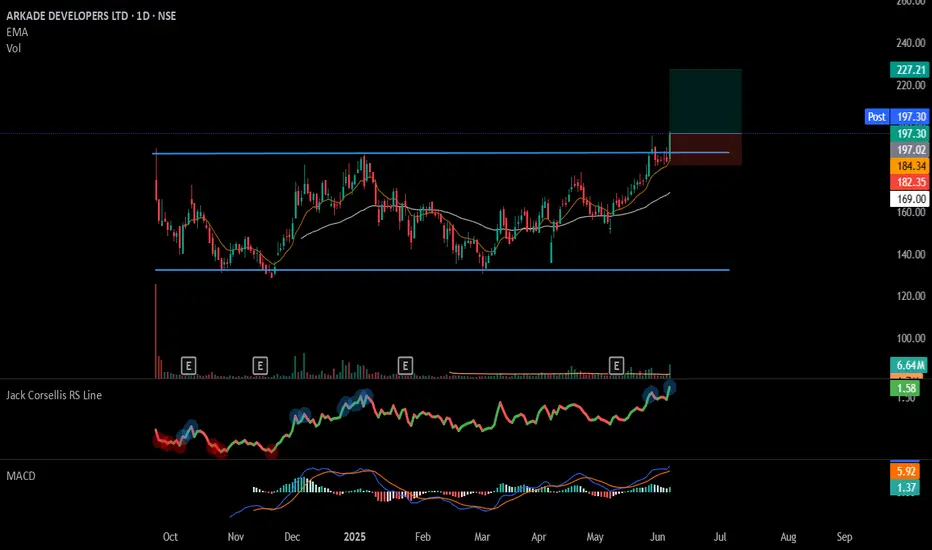
#ARKADE - IPO Base Breakout📊 Script: ARKADE
Key highlights: 💡⚡
📈 IPO Base Breakout in Daily Time Frame.
📈 Price consolidating near Resistance, then Breakout.
📈 Volume spike seen during Breakout.
📈 MACD Cross
📈 Can go for a swing trade
BUY ONLY ABOVE 197 DCB
⏱️ C.M.P 📑💰- 197.34
🟢 Target 🎯🏆 – 14%
⚠️ Stoploss ☠️🚫 – 7%
⚠️ Important: Market conditions are Okish, Position size 50% per Trade. Protect Capital Always
⚠️ Important: Always Exit the trade before any Event.
⚠️ Important: Always maintain your Risk:Reward Ratio as 1:2, with this RR, you only need a 33% win rate to Breakeven.
✅Like and follow to never miss a new idea!✅
Disclaimer: I am not SEBI Registered Advisor. My posts are purely for training and educational purposes.
Eat🍜 Sleep😴 TradingView📈 Repeat 🔁
Happy learning with MMT. Cheers!🥂
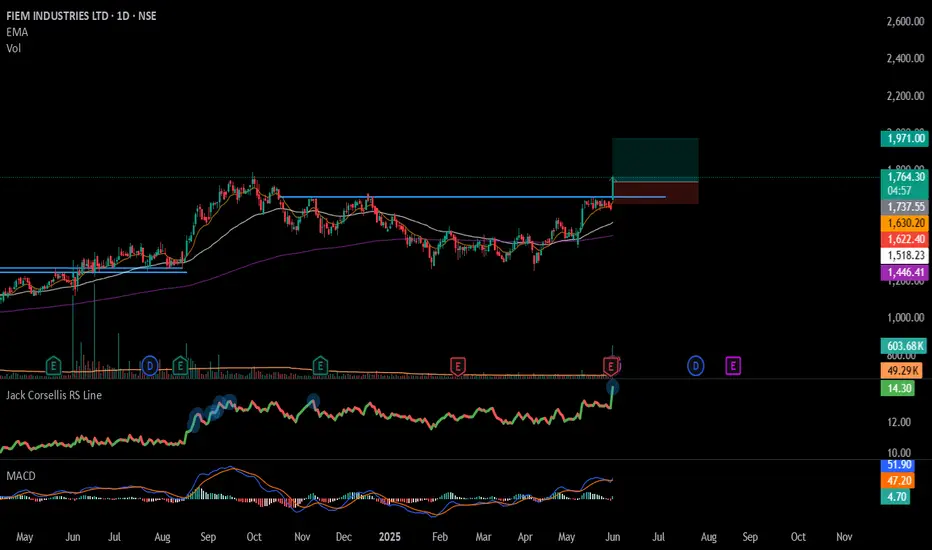
#FIEMIND - Cup & Handel BreakOut in Daily Time Frame📊 Script: FIEMIND
Key highlights: 💡⚡
📈 Cup & Handel BreakOut in Daily Time Frame.
📈 Price consolidating near Resistance.
📈 Volume spike during Breakout
📈 MACD Cross
📈 RS Line Making 52WH
📈 Can go for a swing trade
BUY ONLY ABOVE 1735 DCB
⏱️ C.M.P 📑💰- 1734
🟢 Target 🎯🏆 – 14%
⚠️ Stoploss ☠️🚫 – 7%
⚠️ Important: Market conditions are Okish, Position size 50% per Trade. Protect Capital Always
⚠️ Important: Always Exit the trade before any Event.
⚠️ Important: Always maintain your Risk:Reward Ratio as 1:2, with this RR, you only need a 33% win rate to Breakeven.
✅Like and follow to never miss a new idea!✅
Disclaimer: I am not SEBI Registered Advisor. My posts are purely for training and educational purposes.
Eat🍜 Sleep😴 TradingView📈 Repeat 🔁
Happy learning with MMT. Cheers!🥂
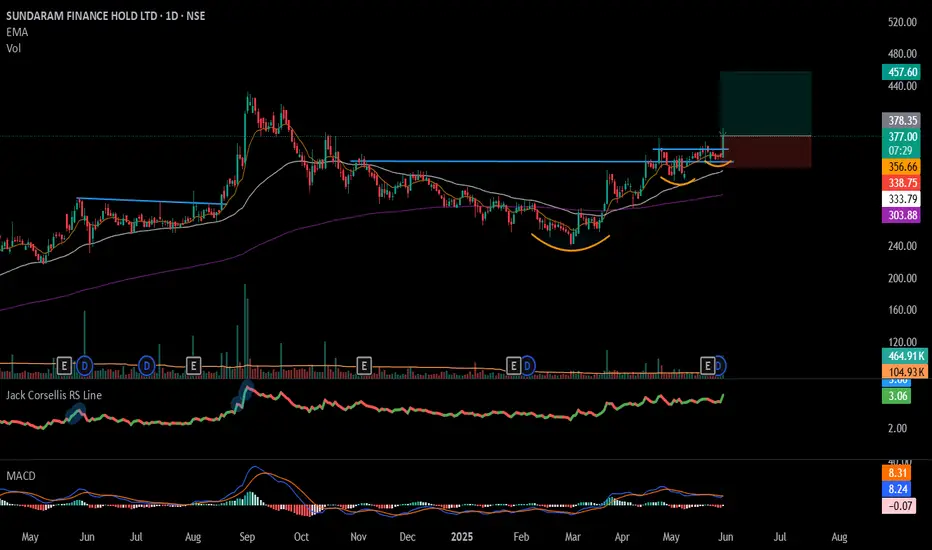
#SUNDARMHLD - VCP BreakOut in Daily Time Frame.📊 Script: SUNDARMHLD
Key highlights: 💡⚡
📈 VCP BreakOut in Daily Time Frame.
📈 Price consolidating near Resistance.
📈 Volume spike during Breakout
📈 MACD Cross
📈 Can go for a swing trade
BUY ONLY ABOVE 378 DCB
⏱️ C.M.P 📑💰- 376
🟢 Target 🎯🏆 – 21%
⚠️ Stoploss ☠️🚫 – 10.50%
⚠️ Important: Market conditions are Okish, Position size 50% per Trade. Protect Capital Always
⚠️ Important: Always Exit the trade before any Event.
⚠️ Important: Always maintain your Risk:Reward Ratio as 1:2, with this RR, you only need a 33% win rate to Breakeven.
✅Like and follow to never miss a new idea!✅
Disclaimer: I am not SEBI Registered Advisor. My posts are purely for training and educational purposes.
Eat🍜 Sleep😴 TradingView📈 Repeat 🔁
Happy learning with MMT. Cheers!🥂
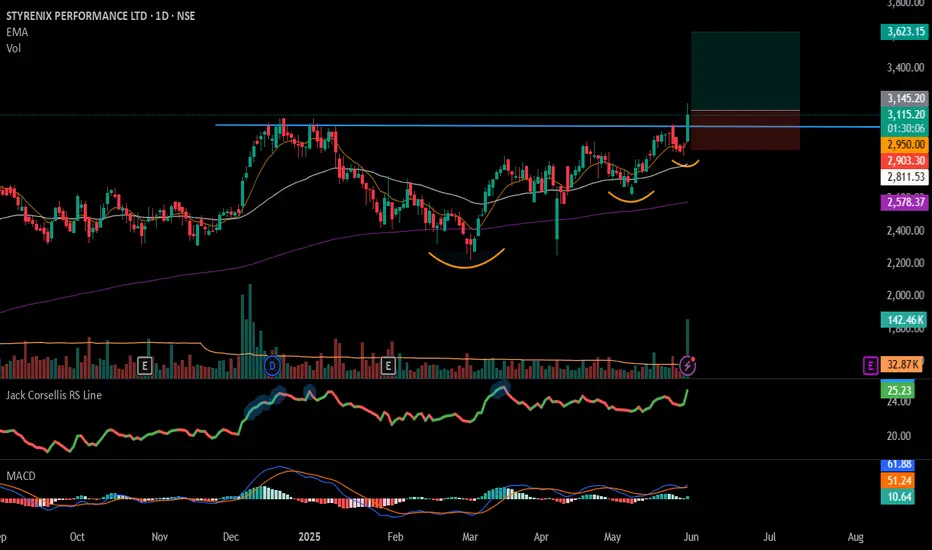
#STYRENIX - VCP BreakOut in Daily Time Frame📊 Script: STYRENIX
Key highlights: 💡⚡
📈 VCP BreakOut in Daily Time Frame.
📈 Price consolidating near Resistance.
📈 Volume spike during Breakout
📈 MACD Bounce
📈 Can go for a swing trade
BUY ONLY ABOVE 3145 DCB
⏱️ C.M.P 📑💰- 3115
🟢 Target 🎯🏆 – 16%
⚠️ Stoploss ☠️🚫 – 8%
⚠️ Important: Market conditions are Okish, Position size 50% per Trade. Protect Capital Always
⚠️ Important: Always Exit the trade before any Event.
⚠️ Important: Always maintain your Risk:Reward Ratio as 1:2, with this RR, you only need a 33% win rate to Breakeven.
✅Like and follow to never miss a new idea!✅
Disclaimer: I am not SEBI Registered Advisor. My posts are purely for training and educational purposes.
Eat🍜 Sleep😴 TradingView📈 Repeat 🔁
Happy learning with MMT. Cheers!🥂
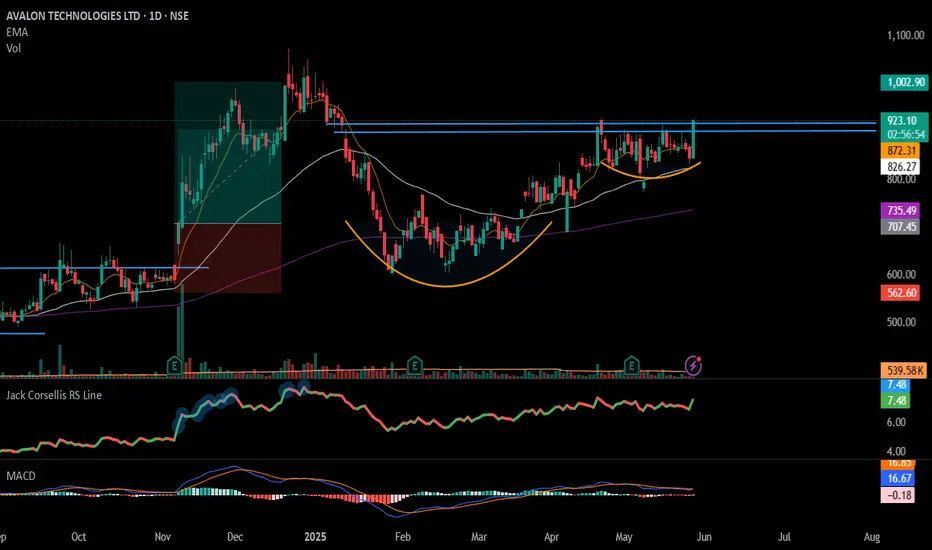
#AVALON - Cup & Handel Potential BreakOut / Keep In WatchList📊 Script: AVALON
Key highlights: 💡⚡
📈 Cup & Handel Potential BreakOut in Daily Time Frame.
📈 Price consolidating near Resistance.
📈 Wait for Volume spike during Breakout
📈 MACD Bullish
📈 Can go for a swing trade
BUY ONLY ABOVE 930 DCB
⏱️ C.M.P 📑💰- 915
🟢 Target 🎯🏆 – NA%
⚠️ Stoploss ☠️🚫 – NA%
⚠️ Important: Market conditions are Okish, Position size 50% per Trade. Protect Capital Always
⚠️ Important: Always Exit the trade before any Event.
⚠️ Important: Always maintain your Risk:Reward Ratio as 1:2, with this RR, you only need a 33% win rate to Breakeven.
✅Like and follow to never miss a new idea!✅
Disclaimer: I am not SEBI Registered Advisor. My posts are purely for training and educational purposes.
Eat🍜 Sleep😴 TradingView📈 Repeat 🔁
Happy learning with MMT. Cheers!🥂
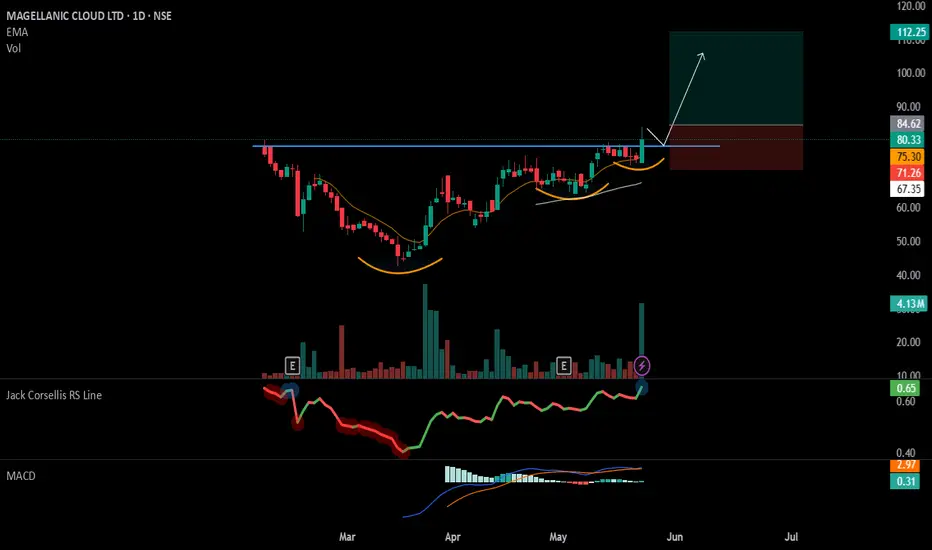
#MCLOUD - VCP + IPO Base Break Out📊 Script: MCLOUD
Key highlights: 💡⚡
📈 VCP + IPO Base BreakOut in Daily Time Frame.
📈 Price consolidated near Resistance.
📈 Volume spike seen
📈 MACD Crossover
📈 Can go for a swing trade
BUY ONLY ABOVE 85 DCB
⏱️ C.M.P 📑💰- 80.33
🟢 Target 🎯🏆 – 31%
⚠️ Stoploss ☠️🚫 – 15%
️⚠️ Important: Market conditions are Okish, Position size 50% per Trade. Protect Capital Always
⚠️ Important: Always Exit the trade before any Event.
⚠️ Important: Always maintain your Risk:Reward Ratio as 1:2, with this RR, you only need a 33% win rate to Breakeven.
✅Like and follow to never miss a new idea!✅
Disclaimer: I am not SEBI Registered Advisor. My posts are purely for training and educational purposes.
Eat🍜 Sleep😴 TradingView📈 Repeat 🔁
Happy learning with MMT. Cheers!🥂
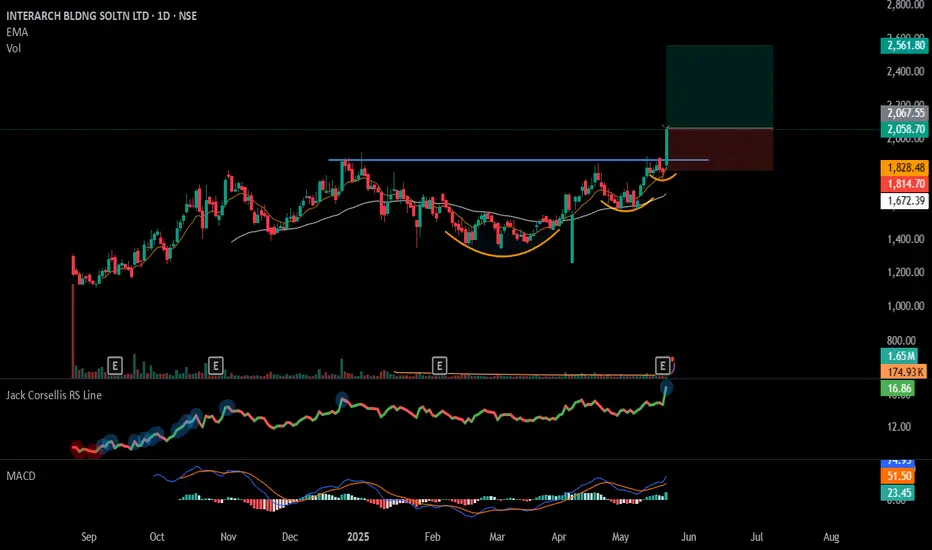
#INTERARCH - VCP BreakOut in Daily Time Frame📊 Script: INTERARCH
Key highlights: 💡⚡
📈 VCP BreakOut in Daily Time Frame.
📈 Price consolidated near Resistance.
📈 Volume spike seen
📈 MACD Crossover
📈 Can go for a swing trade
BUY ONLY ABOVE 2075 DCB
⏱️ C.M.P 📑💰- 2058
🟢 Target 🎯🏆 – 24%
⚠️ Stoploss ☠️🚫 – 12%
️⚠️ Important: Market conditions are Okish, Position size 50% per Trade. Protect Capital Always
⚠️ Important: Always Exit the trade before any Event.
⚠️ Important: Always maintain your Risk:Reward Ratio as 1:2, with this RR, you only need a 33% win rate to Breakeven.
✅Like and follow to never miss a new idea!✅
Disclaimer: I am not SEBI Registered Advisor. My posts are purely for training and educational purposes.
Eat🍜 Sleep😴 TradingView📈 Repeat 🔁
Happy learning with MMT. Cheers!🥂
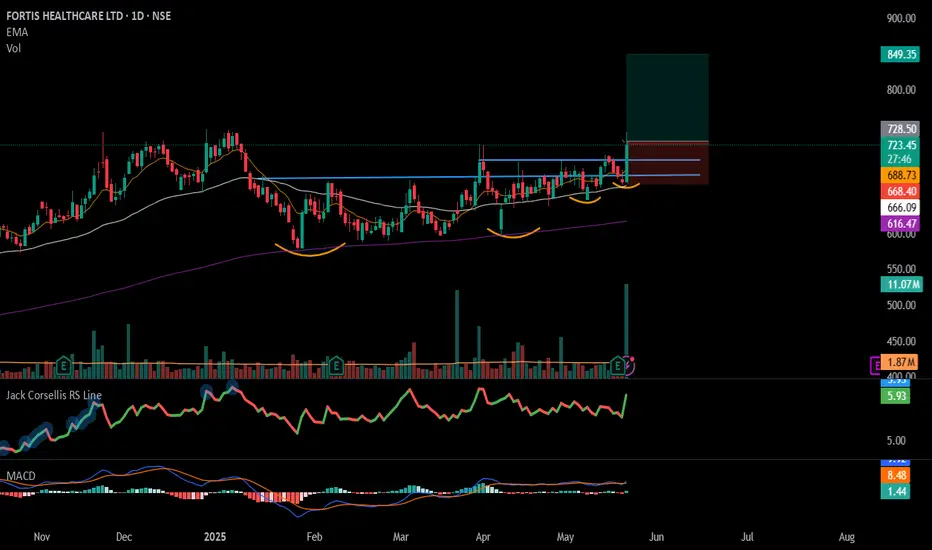
#FORTIS - VCP BreakOut in Daily Time Frame📊 Script: FORTIS
Key highlights: 💡⚡
📈 VCP BreakOut in Daily Time Frame.
📈 Price consolidated near Resistance.
📈 Volume spike seen
📈 MACD Crossover
📈 Can go for a swing trade
BUY ONLY ABOVE 728 DCB
⏱️ C.M.P 📑💰- 722
🟢 Target 🎯🏆 – 16%
⚠️ Stoploss ☠️🚫 – 8%
️⚠️ Important: Market conditions are Okish, Position size 50% per Trade. Protect Capital Always
⚠️ Important: Always Exit the trade before any Event.
⚠️ Important: Always maintain your Risk:Reward Ratio as 1:2, with this RR, you only need a 33% win rate to Breakeven.
✅Like and follow to never miss a new idea!✅
Disclaimer: I am not SEBI Registered Advisor. My posts are purely for training and educational purposes.
Eat🍜 Sleep😴 TradingView📈 Repeat 🔁
Happy learning with MMT. Cheers!🥂