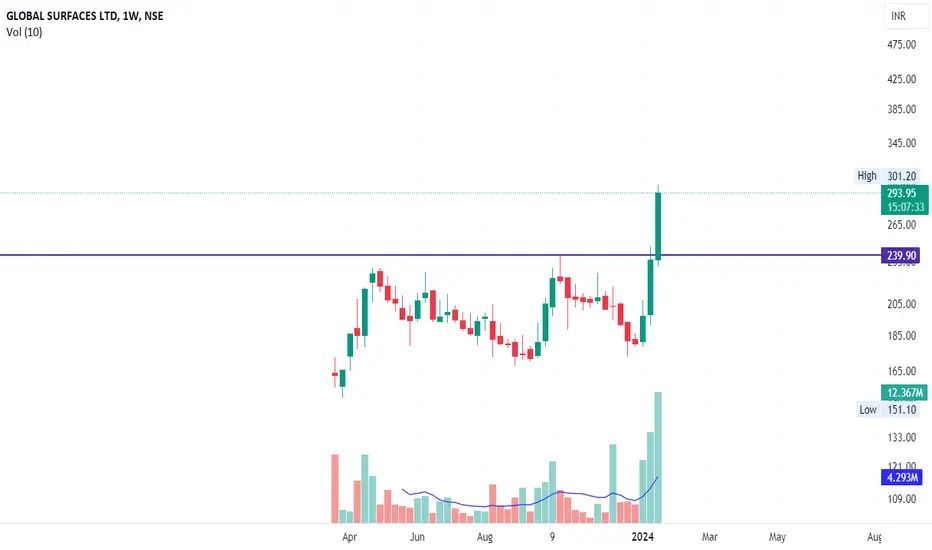
GSLSU / Global Surfaces Ltd - Consolidation / IPO Base BreakoutGSLSU
1) Time Frame - Weekly.
2) Previous Life Time High was 239.30. It has been consolidating since 2023, March & given a breakout in weekly time frame currently.
3) It's a consolidation / IPO base breakout with strong bullish candle & Good volume.
4) Recommendation - Strong Buy
Consolidation-breakout
HPAL / HP ADHESIVES LTD - 1 Yr Consolidation / IPO base breakoutHPAL
1) Time Frame - Weekly.
2) Previous Life Time High was 109.30. It has been consolidationg since 2022 January & given a breakout in weekly time frame currently.
3) It's a consolidation / IPO base breakout with strong bullish candle & Good volume.
4) Recommendation - Strong Buy

Capri Global-A breakout you shouldn't miss!Stock has been consolidating in a range from many days.Volume breakout has happened today.
Stock should sustain above 850 for couple of days for confirmation.
Levels mentioned on chart. Highly risky trade.

BUY HIMADARI FOR 50% GAINHIMADARI, HSCL 103, has respected all weekly moving average and support of 80 range. HSCL ready for 140 to 160 range in medium term.
Invalid below 80 levels on weekly closing basis. Use big dips here

CONSOLIDATION BREAKOUT IN LTIMBuy LTIM (D) 5240, for 5700 and 6100. Add on dips till 5000 with stop at 4950 on weekly close. Stock ready to give breakout above 38.2% fibonacci levels and then will reach 50% and 62% eventually. Consolidation happening for last 12 months which shall give minimum 15% returns.
Both leading and lagging indicator MACD and EMA is indicating bullish momentum in LTIM

PNCINFRA - Bullish Consolidation Breakout with volumesNSE: PNCINFRA is closing with a bullish consolidation breakout candle supported with volumes.
Today's volumes and candlestick formation indicates strong demand and stock should move to previous swing highs in the coming days.
The stock has been moving along the horizontal support for the past few days which is indicating demand.
One can look for a 11% to 17% gain on deployed capital in this swing trade.
The view is to be discarded in the event of the stock breaking previous swing low.
#NSEindia #Trading #StockMarketindia #Tradingview #SwingTrade

SULA / Sula Vineyards Ltd - 5 months consolidation breakout ATHSULA / Sula Vineyards Ltd - 5 months consolidation breakout | All Time High
1) Time Frame - Weekly.
2) 5 months of consolidation / previous All Time High broken in weekly time frame with huge volume.
3) Since the stock is moving in an uptrend channel it will find its resistance around the price (626.45 - 13% from today's close).
4) Recommendation - Strong Buy

TREL / TransIndia Real Estate Ltd - 4 Months Consolidation Break1) Time Frame - Weekly.
2) 4 Months consolidation breakout in weekly with huge bullish candle and volume.
3) Since the stock moves in an uptrend channel it will find its resistance around the price (67).
4) Recommendation - Strong Buy

INDIAGLYCO / India Glycols Ltd - 2 Years of Downtrend Breakout.INDIAGLYCO
1) Time Frame - Weekly.
2) 2 Years of Downtrend Breakout in weekly with huge bullish candle and volume.
3) Next resistance / Target would be its previous Life Time High at price (1151.95 - 22%).
4) Recommendation - Strong Buy

ADANIPORTS - 3 years consolidation breakoutADANIPORTS
1) Time Frame - Weekly.
2) 3 Years of consolidation breakout happened on 1st week of December 2023 & Now the stock has retraced its breakout point & consolidated 3 weeks & broken and closed today with a strong bullish weekly candle.
3) Recommendation - Strong Buy

GLAXO / Glaxosmithkline Pharmaceuticals Ltd - 13 Years ConsolidaGLAXO
1) Time Frame - Monthly. Kindly change the time frame to weekly for better understanding.
2) 13 Years of consolidation (Since 2010) broken & Closed strong in WEEKLY time frame.
3) Stock will find its strong resistance / profit booking zone at the primary trendline in the long term.
4) Recommendation - Strong Buy

JWL - Spinning Top with volumesNSE: JWL is closing with a bullish spinning top candle supported with volumes.
Today's volumes and candlestick formation indicates strong demand and stock should move to previous swing highs in the coming days.
The stock has been moving along the horizontal support for the past few days which is indicating demand.
One can look for a 11% to 20% gain on deployed capital in this swing trade.
The view is to be discarded in the event of the stock breaking previous swing low.
#NSEindia #Trading #StockMarketindia #Tradingview #SwingTrade

GHCL - Bullish Consolidation Breakout with VolumesNSE: GHCL is closing with a bullish consolidation breakout candle supported with volumes.
Today's volumes and candlestick formation indicates strong demand and stock should move to previous swing highs in the coming days.
The stock has been moving along the horizontal support for the past few days which is indicating demand.
One can look for a 8% to 13% gain on deployed capital in this swing trade.
The view is to be discarded in the event of the stock breaking previous swing low.
#NSEindia #Trading #StockMarketindia #Tradingview #SwingTrade

MOTHERSON - Bullish Consolidation Breakout with VolumesNSE: MOTHERSON is closing with a bullish consolidation breakout candle supported with volumes.
Today's volumes and candlestick formation indicates strong demand and stock should move to previous swing highs in the coming days.
The stock has been moving along the horizontal support for the past few days which is indicating demand.
One can look for a 9% to 14% gain on deployed capital in this swing trade.
The view is to be discarded in the event of the stock breaking previous swing low.
#NSEindia #Trading #StockMarketindia #Tradingview #SwingTrade

SULA - Bullish Consolidation Breakout with VolumesNSE: SULA is closing with a bullish consolidation breakout candle supported with volumes.
Today's volumes and candlestick formation indicates strong demand and stock should move to previous swing highs in the coming days.
The stock has been moving along the horizontal support for the past few days which is indicating demand.
One can look for a 8% to 12% gain on deployed capital in this swing trade.
The view is to be discarded in the event of the stock breaking previous swing low.
#NSEindia #Trading #StockMarketindia #Tradingview #SwingTrade

VOLTAS - Coming out of consolidation after retestThe analysis is done on Weekly TF hence price may take few weeks to few months in order to reach the targets. Trade setup is explained in image itself.
After breakout, a major resistance becomes major support.
When price reverses from major support and breaks above major resistance zone, it signals towards a major trend change towards upside.
The above analysis is purely for educational purpose. Traders must do their own study & follow risk management before entering into any trade
Checkout my other ideas to understand how one can earn from stock markets with simple trade setups. Feel Free to comment below this or connect with me for any query or suggestion regarding this stock or Price Action Analysis.

SFL - Bullish Consolidation Breakout with VolumesNSE: SFL is closing with a bullish consolidation breakout candle supported with volumes.
Today's volumes and candlestick formation indicates strong demand and stock should move to previous swing highs in the coming days.
The stock has been moving along the horizontal support for the past few days which is indicating demand.
One can look for a 8% to 12% gain on deployed capital in this swing trade.
The view is to be discarded in the event of the stock breaking previous swing low.
#NSEindia #Trading #StockMarketindia #Tradingview #SwingTrade

RITES - Bullish Consolidation Breakout with VolumesNSE: RITES is closing with a bullish consolidation breakout candle supported with volumes.
Today's volumes and candlestick formation indicates strong demand and stock should move to previous swing highs in the coming days.
The stock has been moving along the horizontal support for the past few days which is indicating demand.
One can look for a 8% to 14% gain on deployed capital in this swing trade.
The view is to be discarded in the event of the stock breaking previous swing low.
#NSEindia #Trading #StockMarketindia #Tradingview #SwingTrade

AngelOne BreakoutBreaking out with above average volume after 3 weeks of consolidation phase, just to continue with prior trend...

MAZDOCK - Bullish Consolidation Breakout with VolumesNSE: MAZDOCK is closing with a bullish consolidation breakout candle supported with volumes.
Today's volumes and candlestick formation indicates strong demand and stock should move to previous swing highs in the coming days.
The stock has been moving along the horizontal support for the past few days which is indicating demand.
One can look for a 8% to 13% gain on deployed capital in this swing trade.
The view is to be discarded in the event of the stock breaking previous swing low.
#NSEindia #Trading #StockMarketindia #Tradingview #SwingTrade

NATIONALUM - Bullish Consolidation BreakoutNSE: NATIONALUM is closing with a bullish consolidation breakout candle supported with volumes.
Today's volumes and candlestick formation indicates strong demand and stock should move to previous swing highs in the coming days.
The stock has been moving along the horizontal support for the past few days which is indicating demand.
One can look for a 8% to 11% gain on deployed capital in this swing trade.
The view is to be discarded in the event of the stock breaking previous swing low.
#NSEindia #Trading #StockMarketindia #Tradingview #SwingTrade

CANFINHOME - Bullish Consolidation BreakoutNSE: CANFINHOME is closing with a bullish consolidation breakout candle supported with volumes.
Today's volumes and candlestick formation indicates strong demand and stock should move to previous swing highs in the coming days.
The stock has been moving along the horizontal support for the past few days which is indicating demand.
One can look for a 8% to 12% gain on deployed capital in this swing trade.
The view is to be discarded in the event of the stock breaking previous swing low.
#NSEindia #Trading #StockMarketindia #Tradingview #SwingTrade

RALLISH - Bullish Consolidation Breakout with VolumesNSE: RALLIS is closing with a bullish consolidation breakout candle supported with volumes.
Today's volumes and candlestick formation indicates strong demand and stock should move to previous swing highs in the coming days.
The stock has been moving along the horizontal support for the past few days which is indicating demand.
One can look for a 8% to 13% gain on deployed capital in this swing trade.
The view is to be discarded in the event of the stock breaking previous swing low.
#NSEindia #Trading #StockMarketindia #Tradingview #SwingTrade
