Part 1 How to Draw Accurate Support and Resistance LevelsThe Key Components of an Option Contract
Underlying Asset:
The financial instrument (e.g., stock or index) on which the option is based.
Strike Price:
The price at which the holder of the option can buy (for calls) or sell (for puts) the underlying asset.
Expiry Date:
The date on which the option contract expires. In India, options can be weekly or monthly.
Premium:
The price the buyer pays to purchase the option contract from the seller (also known as the writer). This premium is non-refundable.
Lot Size:
Each option contract represents a fixed quantity of the underlying. For example, one NIFTY option lot equals 50 units, while one BANK NIFTY option equals 15 units.
Contains image

Part 2 Understanding the Master Candle ConceptWhat Are Options?
Options are derivative instruments, meaning their value is derived from an underlying asset. The underlying asset can be a stock, index, commodity, or currency.
There are two types of options:
Call Option:
Gives the buyer the right to buy the underlying asset at a specific price (called the strike price) before the expiry date.
Put Option:
Gives the buyer the right to sell the underlying asset at a specific price before the expiry date.
For example:
If you buy a NIFTY 50 call option at a strike price of 22,000, you are betting that the NIFTY will rise above 22,000 before expiry. If it does, your call option increases in value.
If you buy a NIFTY put option at 22,000, you’re betting the index will fall below 22,000 — and the value of your put option will rise as the index drops.

India’s IPO System:Securities and Exchange Board of India (SEBI)1. Understanding an IPO
An Initial Public Offering (IPO) is the process by which a privately held company offers its shares to the general public for the first time. Through an IPO, a company becomes publicly listed on a stock exchange, such as the National Stock Exchange (NSE) or the Bombay Stock Exchange (BSE). The primary goal of an IPO is to raise capital for expansion, reduce debt, fund research, or provide an exit opportunity for early investors and promoters.
An IPO marks a significant milestone in a company’s journey because it transitions from a private entity with limited ownership to a public entity with diverse shareholders. It also enhances the company’s visibility, credibility, and valuation in the market.
2. Regulatory Framework of the Indian IPO System
The IPO process in India is governed by SEBI, established in 1992, which regulates and ensures that companies follow strict norms before going public. SEBI’s guidelines protect investors’ interests and maintain transparency. Other regulatory bodies involved include:
Ministry of Corporate Affairs (MCA) – Oversees company law compliance.
Stock Exchanges (NSE/BSE) – Approve listing applications and trading permissions.
Registrar of Companies (ROC) – Records and validates company documents.
Depositories (NSDL/CDSL) – Facilitate electronic shareholding and transactions.
SEBI’s (Issue of Capital and Disclosure Requirements) Regulations, 2018 (ICDR) lay down the specific rules for disclosures, eligibility, and allotment in an IPO.
3. Types of IPO Issues in India
There are primarily two types of IPO issues based on pricing methods:
Fixed Price Issue:
The company sets a fixed price for each share in advance.
Investors know the share price before applying.
After closure, demand is revealed, and shares are allotted accordingly.
Book Building Issue:
The company sets a price band (e.g., ₹100–₹120).
Investors bid within the range, specifying the quantity and price they are willing to pay.
The final issue price is determined based on demand (cut-off price).
Most modern IPOs in India use this method due to market efficiency.
4. Eligibility Criteria for Companies
For a company to launch an IPO in India, SEBI mandates certain eligibility conditions:
Net Tangible Assets: Minimum of ₹3 crore in the preceding three years.
Net Worth: Minimum of ₹1 crore in the last three years.
Track Record: Positive operating profit for at least three out of the last five years.
Post-Issue Capital: Minimum ₹10 crore paid-up capital.
Promoter Contribution: Promoters must hold at least 20% of post-issue capital for one year.
If companies do not meet these conditions, they can still approach the market through alternative routes like the SME (Small and Medium Enterprises) Platform or offer for sale (OFS) mechanisms.
5. IPO Process in India
The IPO process involves several well-defined steps:
a. Appointment of Intermediaries
Companies hire financial and legal advisors, including:
Merchant bankers (lead managers)
Underwriters
Registrars to the issue
Auditors and legal consultants
These intermediaries help structure, price, and execute the IPO.
b. Due Diligence and Draft Red Herring Prospectus (DRHP)
The merchant banker prepares a Draft Red Herring Prospectus (DRHP), containing details like company background, financial statements, management, risks, and objectives of the issue.
SEBI reviews the DRHP to ensure full disclosure. After approval, it becomes the Red Herring Prospectus (RHP).
c. Marketing and Roadshows
Companies conduct roadshows to attract institutional and retail investors. The management team presents the company’s growth story, business potential, and financial performance.
d. Bidding and Allotment
In a book-building issue, bidding remains open for 3–5 working days.
Investors can bid through the Application Supported by Blocked Amount (ASBA) system, where funds remain blocked in their bank account until allotment.
Post-closure, the company determines the cut-off price and allots shares to investors.
e. Listing on the Stock Exchange
Once shares are allotted, they are credited to investors’ demat accounts.
The company’s shares are then listed on the NSE and/or BSE within six working days from the issue closure date (known as the T+6 timeline).
6. Categories of Investors in an IPO
SEBI divides investors into three main categories to ensure fair participation:
Qualified Institutional Buyers (QIBs):
Includes mutual funds, insurance companies, foreign portfolio investors (FPIs), and banks. They are allotted 50% of the issue size in book-built issues.
Non-Institutional Investors (NIIs):
High-net-worth individuals investing more than ₹2 lakh. Reserved quota is 15%.
Retail Individual Investors (RIIs):
Small investors investing up to ₹2 lakh. Reserved quota is 35%.
In some cases, an additional portion may be reserved for employees or shareholders.
7. Post-Listing Performance and Compliance
Once listed, companies must adhere to continuous disclosure norms, including quarterly results, corporate governance standards, and insider trading rules. SEBI and the stock exchanges monitor compliance to protect investors and maintain transparency.
Post-listing, share prices fluctuate based on demand, supply, and market perception, reflecting the company’s fundamentals and investor sentiment.
8. Role of Technology in India’s IPO System
India’s IPO ecosystem has become increasingly digitalized. Key advancements include:
ASBA system – Simplifies payment and ensures investor protection.
UPI integration – Allows retail investors to apply easily through mobile apps.
T+6 listing timeline – Reduces settlement time and enhances liquidity.
Online bidding platforms – Brokers and exchanges now offer real-time IPO bidding services.
These innovations have significantly increased retail participation in IPOs, especially among young investors.
9. Benefits of IPOs
For companies:
Access to large-scale capital for expansion.
Improved brand visibility and credibility.
Liquidity for existing shareholders and employees.
Easier access to debt financing post-listing.
For investors:
Opportunity to invest early in growing companies.
Potential for short-term listing gains.
Long-term wealth creation through equity growth.
10. Challenges and Risks
Despite its success, India’s IPO market faces certain challenges:
Market volatility – Global events can affect investor sentiment and pricing.
Overvaluation risk – Some IPOs are priced aggressively, leading to post-listing declines.
Information asymmetry – Retail investors may lack access to in-depth financial analysis.
Regulatory delays – SEBI’s scrutiny, while essential, can prolong the process.
However, ongoing reforms and improved investor education have made the system more resilient and transparent.
11. Recent Trends in the Indian IPO Market
A surge in tech-based IPOs (e.g., Zomato, Nykaa, Paytm).
Growing participation from retail and foreign investors.
Introduction of SME and startup platforms to support smaller firms.
Shift toward sustainable and ESG-compliant companies.
Pre-IPO placements and anchor investors strengthening price discovery.
12. Conclusion
India’s IPO system is a well-structured, transparent, and dynamic framework that bridges the gap between private enterprise and public capital. With the rise of digital platforms, regulatory reforms, and investor awareness, IPOs have become a cornerstone of India’s financial growth story. As India’s economy expands and more companies seek global exposure, the IPO ecosystem will continue to evolve, fostering innovation, inclusion, and wealth creation for millions of investors.
Option Chain: Powerful Tools for Traders and Investors1. What is an Option Chain?
An option chain, also known as an option matrix, lists all the available call and put options for a specific security. Each row represents an individual option contract with its strike price, expiry date, premium, and other key metrics. It helps traders compare multiple options to make informed decisions about trading strategies.
For example, on the NSE (National Stock Exchange of India), you can view the option chain for NIFTY 50, Bank NIFTY, or any stock. It displays both Call Options (CE) on the left and Put Options (PE) on the right.
2. Basic Terms in an Option Chain
a. Call Option (CE)
A Call Option gives the buyer the right, but not the obligation, to buy the underlying asset at a predetermined price (strike price) before or on the expiration date. Buyers of calls expect the underlying price to rise, while sellers (writers) of calls expect it to stay the same or fall.
b. Put Option (PE)
A Put Option gives the buyer the right, but not the obligation, to sell the underlying asset at a predetermined strike price before or on expiration. Buyers of puts expect the underlying asset’s price to fall, while sellers expect it to stay the same or rise.
c. Strike Price
The strike price is the price at which the option holder can buy (for a call) or sell (for a put) the underlying asset. Option chains list multiple strike prices around the current market price of the asset.
Example:
If NIFTY is trading at 22,000, the option chain may show strikes like 21,900, 22,000, 22,100, etc.
d. Expiry Date
The expiry date (or expiration date) is the date when the option contract ceases to exist. In India, options can have weekly or monthly expiries.
Weekly options expire every Thursday.
Monthly options expire on the last Thursday of the month.
After expiry, the option either becomes worthless (out-of-the-money) or is settled for profit/loss (in-the-money).
e. Option Type
Each contract specifies whether it is a Call (CE) or Put (PE). Traders choose the type based on their market outlook:
Bullish traders buy Calls or sell Puts.
Bearish traders buy Puts or sell Calls.
3. Option Chain Data Columns Explained
Each row in an option chain contains various data points. Let’s decode them one by one.
a. Last Traded Price (LTP)
The Last Traded Price is the most recent price at which the option contract was traded. It indicates the current market value or premium of the option.
Example:
If NIFTY 22,000 CE LTP = ₹120, that means the last buyer paid ₹120 for that call option.
b. Change and % Change
This shows how much the premium has moved compared to the previous trading session.
Change = LTP today – LTP yesterday
% Change = (Change / Previous LTP) × 100
It helps traders track intraday momentum and volatility.
c. Bid Price & Ask Price
Bid Price: The highest price a buyer is willing to pay.
Ask Price: The lowest price a seller is willing to accept.
The difference between them is the Bid-Ask Spread, which shows liquidity—narrow spreads indicate higher liquidity.
d. Bid Quantity & Ask Quantity
These represent how many contracts traders are willing to buy or sell at the bid or ask price.
Example:
If Bid Quantity = 1,200, it means traders want to buy 1,200 contracts at the bid price.
e. Open Interest (OI)
Open Interest is one of the most important metrics in an option chain. It represents the total number of outstanding (open) option contracts that have not been settled yet.
Rising OI indicates new positions being created.
Falling OI means positions are being squared off.
Interpretation Example:
Price ↑ and OI ↑ → Strong trend continuation (bullish).
Price ↓ and OI ↑ → Bearish trend strengthening.
Price ↑ and OI ↓ → Short covering.
Price ↓ and OI ↓ → Long unwinding.
f. Change in Open Interest
This shows how much the OI has changed compared to the previous session. It helps identify whether traders are entering new positions or exiting existing ones.
g. Volume
Volume indicates the number of option contracts traded during the day.
High volume shows active trading and high liquidity.
h. Implied Volatility (IV)
Implied Volatility reflects the market’s expectation of future volatility in the underlying asset.
High IV → Expensive premiums (greater uncertainty).
Low IV → Cheaper premiums (stable markets).
Traders use IV to assess whether options are overpriced or underpriced.
i. LTP vs. IV Relationship
If IV rises, option premiums generally increase (even if the underlying doesn’t move).
If IV falls, premiums tend to decline.
j. Intrinsic Value and Time Value
Each option premium consists of:
Intrinsic Value: The actual value if the option were exercised now.
Time Value: The extra value based on time to expiry and volatility.
Example:
If NIFTY = 22,100 and Call Strike = 22,000,
then Intrinsic Value = 100 (22,100 – 22,000).
4. In-the-Money (ITM), At-the-Money (ATM), Out-of-the-Money (OTM)
a. For Call Options:
ITM: Strike < Current Price
ATM: Strike ≈ Current Price
OTM: Strike > Current Price
b. For Put Options:
ITM: Strike > Current Price
ATM: Strike ≈ Current Price
OTM: Strike < Current Price
Traders often focus on ATM and nearby strikes, as they have higher liquidity.
5. Option Chain Analysis Techniques
a. OI Analysis
By comparing Call OI and Put OI, traders can estimate support and resistance levels:
High Call OI → Resistance zone (sellers active).
High Put OI → Support zone (buyers active).
b. Put-Call Ratio (PCR)
PCR = Total Put OI / Total Call OI
PCR > 1 → More Puts, bullish sentiment.
PCR < 1 → More Calls, bearish sentiment.
Traders use PCR as a contrarian indicator when extreme values appear.
c. Max Pain Theory
The Max Pain point is the strike price where the combined loss for option buyers is maximum and sellers benefit most.
At expiry, the underlying price often gravitates toward this level due to hedging and unwinding activity.
6. Real-World Example (NIFTY Option Chain)
Suppose NIFTY = 22,000, and we analyze the option chain:
Strike Call OI Put OI CE LTP PE LTP
21,900 25,000 10,000 160 70
22,000 30,000 28,000 120 120
22,100 45,000 20,000 80 160
Interpretation:
Strong Call OI at 22,100 → Possible resistance.
Strong Put OI at 22,000 → Possible support.
Market range: 22,000–22,100.
7. Advanced Option Chain Terms
a. Delta
Measures how much an option’s price moves for every ₹1 change in the underlying.
Call Delta: 0 to +1
Put Delta: 0 to –1
Example: Delta = 0.5 means the premium moves ₹0.50 for every ₹1 move in the asset.
b. Theta
Represents time decay—how much the option loses in value each day as expiry nears.
c. Gamma
Shows the rate of change of Delta. High Gamma means Delta will change rapidly with price movements.
d. Vega
Measures sensitivity of an option’s price to changes in volatility. High Vega means the option is more affected by IV changes.
e. Rho
Represents sensitivity of option price to interest rate changes.
8. Conclusion
Understanding option chain terms is essential for anyone involved in derivatives trading. The data helps traders:
Gauge market sentiment (bullish or bearish).
Identify support/resistance zones through OI.
Track volatility via IV.
Recognize trading opportunities through volume and price changes.
A skilled trader doesn’t just read numbers — they interpret the psychology behind them. With consistent analysis, the option chain becomes not just a data sheet, but a strategic roadmap for profitable trading decisions in dynamic markets like India’s NSE.
Trading Secrets in the Indian Market1. Understanding Market Structure
One of the most fundamental secrets of successful trading in India lies in mastering the market structure. The Indian market operates through multiple participants: retail traders, domestic institutional investors (DIIs), foreign institutional investors (FIIs), and algorithmic traders. Each group behaves differently, influencing price trends and volatility.
FIIs, for instance, often drive large movements due to their massive volumes, while DIIs provide stability by investing in long-term opportunities. Observing the data from NSE’s FII/DII activity reports can reveal the underlying sentiment of the market. Smart traders align their trades with institutional flow instead of going against it.
2. The Power of Technical Analysis
Technical analysis remains a key secret weapon for traders. Charts reveal the footprints of big players, showing where buying or selling pressure is concentrated.
Common tools like support and resistance, moving averages, candlestick patterns, and indicators such as RSI, MACD, and Bollinger Bands help traders anticipate price movements. However, the real secret lies in combining multiple signals for confirmation. For example, if a stock breaks above a resistance level with high volume and RSI crosses above 50, it indicates strong bullish momentum.
Professional traders also focus on price action trading, which eliminates noise and focuses on pure price movement — a strategy that works well in Indian stocks with high liquidity.
3. Fundamental Strength Matters
While short-term traders often focus on charts, long-term success in the Indian market is built on strong fundamentals. Knowing a company’s business model, revenue growth, debt levels, and profit margins can protect traders from speculative traps.
One secret many professionals use is the combination of technical and fundamental analysis — entering technically strong stocks that are also fundamentally solid. For instance, during bull markets, stocks like HDFC Bank, Infosys, or Reliance Industries often outperform because they have strong fundamentals along with technical confirmation.
4. Risk Management: The Hidden Key
Most traders lose not because of bad strategy, but due to poor risk management. The golden secret of trading is to protect capital first and aim for profit later.
A disciplined trader uses a stop-loss in every trade. The general rule is never risk more than 1–2% of total capital on a single trade. Moreover, position sizing ensures that even a series of losses doesn’t wipe out one’s account.
For instance, if your capital is ₹1,00,000, risking ₹1,000–₹2,000 per trade ensures survival through market volatility. As Warren Buffett famously said, “The first rule of investing is don’t lose money. The second rule is don’t forget rule number one.”
5. Market Psychology and Emotion Control
Another major secret lies in mastering one’s psychology. The Indian market, like any other, tests patience and emotions daily. Fear and greed drive most traders’ decisions — buying when prices soar and selling when panic hits.
Experienced traders, however, do the opposite. They follow a contrarian approach, buying when others are fearful and selling when others are greedy. For example, during market corrections, quality stocks often become undervalued — a golden opportunity for long-term positions.
Maintaining emotional balance through journaling, back-testing, and following a trading plan is essential for consistent performance.
6. Sector Rotation and Market Cycles
The Indian market operates in cycles — not all sectors move together. Understanding sector rotation is one of the least known but most powerful trading secrets.
At times, IT and pharma sectors perform well, especially when the rupee weakens, while banking and infrastructure rally during economic expansion. By tracking sector indices like NIFTY BANK, NIFTY IT, or NIFTY FMCG, traders can identify where money is flowing.
For instance, if NIFTY IT starts outperforming the benchmark NIFTY 50, traders can focus on stocks like TCS or Infosys for better risk-adjusted returns.
7. The Role of Volume and Open Interest
Volume and open interest (OI) provide deep insights into the strength of a trend. Increasing volume during a price rise signals strong buying interest, while high open interest in futures indicates active participation by large traders.
For example, in the derivatives market, if both price and open interest rise simultaneously, it indicates a long build-up. Conversely, rising OI with falling prices shows short build-up.
Smart traders monitor OI data from NSE to confirm the direction before entering trades, especially in index futures like NIFTY and BANKNIFTY.
8. The Secret of Compounding in Positional Trading
While day trading offers quick rewards, positional trading can yield exponential results through compounding. Holding fundamentally strong stocks for weeks or months allows traders to benefit from both price appreciation and dividend payouts.
For instance, investors who held Maruti Suzuki, HDFC Bank, or Infosys for several years witnessed multi-fold returns. The secret lies in letting profits run instead of booking gains too early — a habit that differentiates successful traders from inconsistent ones.
9. News, Events, and Economic Indicators
Another secret weapon is staying informed about macroeconomic and corporate events. In India, announcements like RBI policy decisions, GDP data, inflation rates, and quarterly corporate earnings influence short-term price movements.
Professional traders often anticipate these events and adjust their positions accordingly. For example, during the Union Budget or RBI policy week, volatility spikes — offering opportunities for both breakout and options traders.
10. Algorithmic and Automated Trading
In recent years, algorithmic trading has emerged as a major force in Indian markets. Many institutions and advanced retail traders use automated systems to execute trades based on predefined strategies.
The secret benefit is precision and discipline — algorithms remove emotional bias and can execute hundreds of trades per second. With platforms like Zerodha Streak and AlgoTest, even retail traders can now automate strategies based on indicators or price action, increasing their efficiency.
11. Patience and Discipline Over Prediction
A hidden truth most traders learn late is that discipline beats prediction. No one can predict the market perfectly, but consistent execution of a proven strategy yields results over time.
The best traders focus on probability, not certainty. They understand that losses are part of the game and use them as feedback to refine strategies. Maintaining discipline — following stop-losses, not overtrading, and adhering to trading plans — builds long-term success.
12. The Power of Continuous Learning
The Indian market evolves rapidly. New instruments like index options, ETFs, and sectoral funds constantly appear. Hence, continuous learning becomes a secret ingredient for staying ahead.
Top traders read books, follow market experts, and backtest new strategies regularly. They treat trading as a business, not a gamble — focusing on skill improvement rather than quick profits.
Conclusion
The “secrets” of trading in the Indian market are not hidden in mystery but in discipline, knowledge, and psychology. Success depends on understanding market behavior, managing risks, following technical and fundamental cues, and maintaining emotional balance.
The Indian stock market offers immense opportunities for those who approach it with strategy and patience. By applying these principles — reading institutional flow, following sector trends, using proper risk control, and embracing continuous learning — traders can move from random speculation to consistent profitability.
Ultimately, the biggest secret of trading is simple: there are no shortcuts — only systems, discipline, and experience.

Trading with Automated Systems1. Introduction to Automated Trading Systems
An automated trading system (ATS) is a computer program that follows pre-defined instructions to execute trades in the financial markets. These instructions—based on price, time, indicators, or mathematical models—allow traders to open and close positions automatically without manual input. The main objective of automation is to improve consistency and remove the psychological barriers that often affect manual trading decisions.
The system can operate across multiple asset classes such as equities, commodities, forex, derivatives, and cryptocurrencies. It can analyze multiple charts simultaneously, detect trading opportunities, and place trades within milliseconds—something human traders cannot match.
2. How Automated Trading Works
Automated trading is based on algorithms—sets of rules or formulas that define how and when trades are made. The process usually involves several steps:
Strategy Development:
Traders define a strategy using technical indicators (like moving averages, RSI, MACD) or statistical models (like mean reversion, momentum, or arbitrage).
Coding the Algorithm:
Once the rules are defined, they are coded into a trading platform (such as MetaTrader, NinjaTrader, or Python-based systems) using programming languages like MQL, Python, or C++.
Backtesting:
The system is tested on historical market data to evaluate its performance, profitability, drawdown, and accuracy.
Optimization:
Parameters are adjusted to improve the system’s performance while avoiding “overfitting,” where the model works only for historical data but fails in live markets.
Execution:
Once tested, the system is deployed for live trading. It monitors the market continuously and executes trades automatically when the defined conditions are met.
Monitoring and Maintenance:
Even though the system is automated, traders must monitor its performance to ensure technical stability and make adjustments when market conditions change.
3. Key Components of Automated Trading Systems
Automated systems rely on several essential components for successful operation:
Trading Algorithm: The heart of the system, it defines when to buy or sell based on predefined rules.
Market Data Feed: Provides real-time price, volume, and order book information.
Execution Engine: Places orders in the market and ensures fast, accurate execution.
Risk Management Module: Sets stop losses, take profits, and position sizing limits to control exposure.
Backtesting Engine: Tests strategies on historical data to evaluate performance.
Broker API: Connects the system to the trading platform for real-time order execution.
Each component must work in harmony to ensure the system performs efficiently, reliably, and safely.
4. Advantages of Automated Trading
1. Speed and Efficiency:
Algorithms can process vast amounts of data and execute trades in milliseconds. This speed is crucial in markets where price fluctuations happen within seconds.
2. Emotion-Free Trading:
Human emotions—fear, greed, and impatience—often lead to mistakes. Automated systems eliminate these factors, ensuring decisions are made purely based on logic and data.
3. Consistency and Discipline:
Since the system follows rules without deviation, it ensures trading consistency and discipline.
4. Backtesting Capability:
Traders can test their strategies on past data before risking real capital, allowing them to refine and validate their approaches.
5. Diversification:
Automated systems can trade multiple assets simultaneously, spreading risk across different instruments and markets.
6. 24/7 Operation:
In global markets like forex and crypto, automated systems can operate continuously without breaks, capturing opportunities even when traders are offline.
5. Risks and Challenges in Automated Trading
Despite its benefits, automated trading also has potential drawbacks:
1. Technical Failures:
Power outages, internet disruptions, or server failures can interrupt trade execution, leading to losses.
2. Over-Optimization:
Traders may “curve fit” their strategies to historical data, creating systems that perform well in testing but fail in real-time markets.
3. Market Volatility:
Sudden market shifts or black swan events can cause large losses if the system cannot adapt quickly.
4. Lack of Human Judgment:
Automated systems follow logic blindly and may miss contextual market information or news events that impact price movements.
5. Cost and Complexity:
Developing and maintaining advanced trading algorithms requires technical skills and can be expensive due to data feeds, servers, and platform costs.
6. Latency and Slippage:
Even minor execution delays can cause slippage—where trades occur at a slightly different price than expected, impacting profitability.
6. Types of Automated Trading Strategies
Trend-Following Systems:
These strategies identify and trade in the direction of prevailing market trends using indicators like moving averages and breakouts.
Mean Reversion Strategies:
They assume prices will revert to their average level after deviation and trade accordingly.
Arbitrage Strategies:
Exploit price differences between assets or markets to earn risk-free profits.
Scalping Strategies:
Involve executing a large number of trades to capture small price movements.
High-Frequency Trading (HFT):
Uses powerful computers to execute thousands of trades per second, capitalizing on minute price inefficiencies.
News-Based Trading:
Algorithms analyze economic reports or sentiment data to make quick trades based on market reactions.
Machine Learning-Based Trading:
AI-driven models learn from data patterns to predict price movements and adjust dynamically to market changes.
7. Platforms and Tools for Automated Trading
There are several platforms designed for algorithmic trading:
MetaTrader 4/5: Widely used in forex, supports automated trading through Expert Advisors (EAs).
NinjaTrader: Suitable for futures and equities with advanced charting tools.
Interactive Brokers API: Offers professional-grade access for institutional traders.
TradingView (with Pine Script): Enables custom strategy scripting and backtesting.
Python and R: Common programming languages used for custom algorithm development.
QuantConnect, AlgoTrader, and MetaStock: Cloud-based or hybrid solutions for quantitative traders.
8. Risk Management in Automated Systems
No trading system is perfect, and risk management is crucial. Automated systems should integrate the following controls:
Stop-Loss Orders: Automatically limit losses if prices move unfavorably.
Take-Profit Orders: Lock in profits once a target is achieved.
Position Sizing: Allocate capital proportionally to reduce exposure.
Diversification: Spread investments across assets to mitigate systemic risk.
Periodic Review: Regularly monitor system performance and adjust parameters as needed.
Proper risk control ensures long-term survival even when markets behave unpredictably.
9. The Future of Automated Trading
The future of automated trading is being shaped by artificial intelligence (AI), machine learning (ML), and big data analytics. These technologies allow systems to adapt dynamically, detect hidden patterns, and evolve based on market conditions. Quantum computing may further transform trading by enabling complex computations in real time.
Furthermore, decentralized finance (DeFi) and blockchain-based platforms are introducing smart contract trading bots, expanding automation beyond traditional financial markets. As technology evolves, automation will become more accessible, transparent, and efficient.
10. Conclusion
Automated trading systems have transformed financial markets by combining data analytics, computing power, and strategic precision. They allow traders to operate with discipline, efficiency, and emotion-free execution. However, automation is not a “set-and-forget” solution—it demands rigorous testing, constant monitoring, and sound risk management.
When used wisely, automated trading enhances performance, minimizes human errors, and provides a competitive edge in a fast-moving global marketplace. As technology continues to evolve, the integration of AI, machine learning, and blockchain will make automated trading even more intelligent, adaptive, and powerful—reshaping how both retail and institutional investors participate in the financial world.
Understanding the Master Candle ConceptOption trading is one of the most exciting and flexible segments of the financial markets. It allows traders to profit not only when prices rise, but also when they fall — and even when they stay relatively stable. In simple terms, an option is a financial contract that gives the buyer the right, but not the obligation, to buy or sell an underlying asset at a predetermined price within a specified period. In India, options are primarily traded on stock indices (like NIFTY 50 or BANK NIFTY) and individual stocks on exchanges like the NSE (National Stock Exchange) and BSE (Bombay Stock Exchange).
Option Trading in India – Regulations
Option trading in India is regulated by the Securities and Exchange Board of India (SEBI).
Contracts are standardized and traded through exchanges like NSE and BSE.
All participants must trade through SEBI-registered brokers, and margins are monitored daily to control risk.

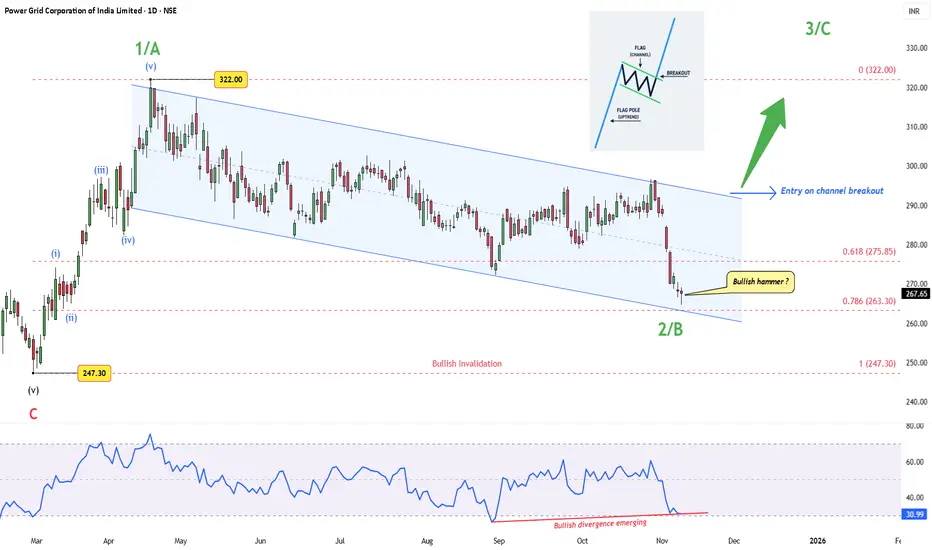
Power Grid – A Flag Within a WaveAfter completing a clean five-wave rally from ₹247.30 to ₹322, Power Grid has spent months in a controlled drift lower — a textbook corrective channel, likely forming Wave 2/B of the next major leg.
Price now sits near the 0.786 retracement (₹263 zone), showing early signs of exhaustion. A “ Bullish hammer? ” candle has appeared — not textbook-perfect, but hinting that buyers are starting to show up near prior demand.
The RSI divergence adds another layer — price made new lows, RSI didn’t. That’s often how momentum bottoms quietly form before a sharp reversal.
Still, price hasn’t kissed the lower boundary of the channel, which has already acted as support thrice. So, another quick dip can’t be ruled out before a stronger move unfolds.
A breakout above the upper channel would confirm the end of this correction and signal the start of Wave 3/C, with ₹322 as the first key level to reclaim.
Until then, patience is key — the structure remains healthy, the confluence is strong, and the risk is clearly defined.
Structure summary:
Wave 1/A : ₹247.30 → ₹322
Wave 2/B : Descending flag-type correction
Key fibs : 0.618 = ₹275.85, 0.786 = ₹263.30
RSI : Bullish divergence emerging
Trigger : Breakout above channel
Invalidation : Below ₹247
Disclaimer: This analysis is for educational purposes only and does not constitute investment advice. Please do your own research (DYOR) before making any trading decisions.
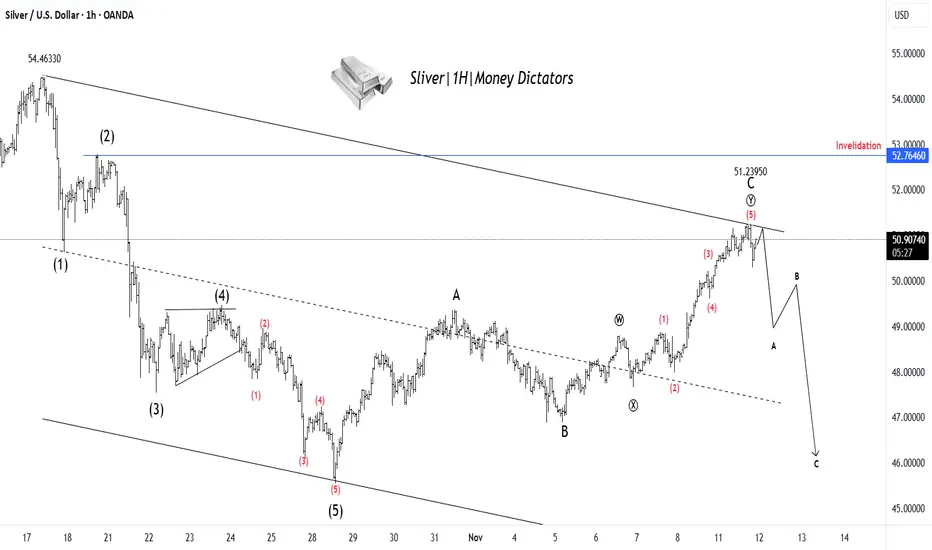
XAG/USD Set for Decline After Finishing Wave YSilver has completed a clear 5-wave upward move, ending near the 51.23 zone, which likely marks the completion of Wave C of the corrective structure. Price action shows rejection from the upper trendline, signaling that buying momentum is fading. This suggests the start of a new A–B–C corrective decline, where Silver could first drop toward 48–47 levels before any temporary bounce. The overall structure remains bearish in the short term unless the price breaks above the 52.76 invalidation zone. In simple terms: rally looks complete → downside correction likely ahead.
Stay tuned!
@Money_Dictators
Thank you :)
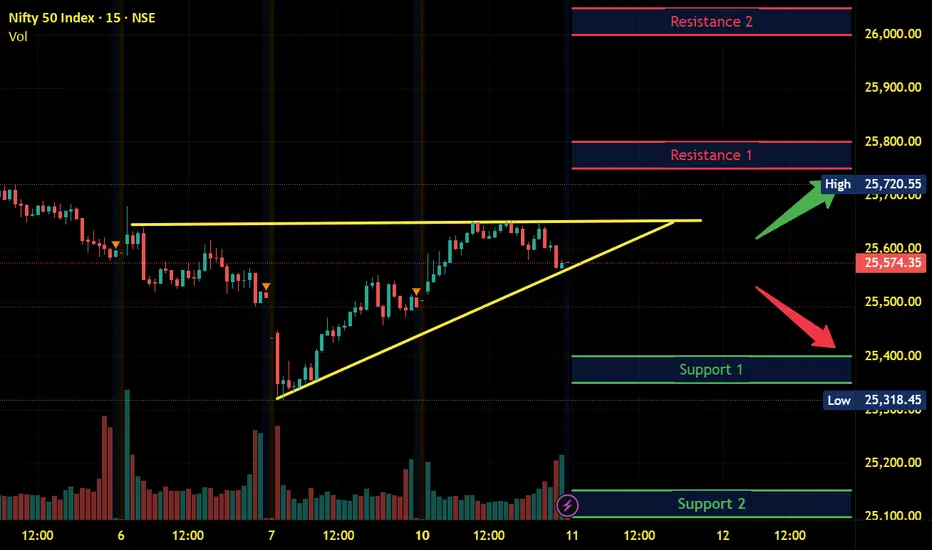
Nifty Intraday Analysis for 11th November 2025NSE:NIFTY
Index has resistance near 25750 – 25800 range and if index crosses and sustains above this level then may reach near 26000 – 26050 range.
Nifty has immediate support near 25400 – 25350 range and if this support is broken then index may tank near 25150 – 25100 range.
The Next Big Altcoin Reversal? $CAKE Ready for a Massive Bull RuThe Next Big Altcoin Reversal? NASDAQ:CAKE Ready for a Massive Bull Run
#CAKE is breaking out from a strong falling wedge after a long accumulation phase. Smart money is showing interest as price shifts from bearish to bullish structure.
Support: $2.30 – $2.50
Resistance: $9.30 / $18.70 / $38.40
A weekly close above $3 could trigger a major trend reversal with potential upside of 900%+ in the long term.
SMC & ICT Insights:
Break of Structure confirmed on HTF
FVG support around $2.40–$2.55
Liquidity targets above $9.30 and $18.70
CAKE looks ready for a multi-month bullish run if it holds current levels.
NFA & DYOR

How to Use Candlestick Patterns in TradingA candlestick represents price movement for a given time frame.
It shows:
Open price – where the candle started
Close price – where the candle ended
High price – the top point (shadow or wick)
Low price – the bottom point (shadow or wick)
👉 If the close price > open price, it’s a bullish candle (often green or white).
👉 If the close price < open price, it’s a bearish candle (often red or black).

Understanding The Premium Chart Patterns 1. Hedging: To protect against losses in existing positions.
Example: If you own Nifty stocks but fear a market fall, buying a put option acts as insurance.
2. Speculation: To profit from expected price movements with limited risk.
Example: Buying a call if you expect prices to rise.
3. Income Generation: Selling (writing) options to earn a premium — the price paid by the buyer of the option.

Advanced Option Trading StrategiesHedging and Portfolio Protection Strategies
Options are not just for speculation; they are powerful tools for hedging existing stock portfolios. Hedging means protecting against potential losses due to adverse price moves.
Popular Hedging Techniques:
Protective Put: Buy a put option against long stock holdings to limit downside.
Collar Strategy: Hold stock, sell a call, and buy a put — ideal when you expect limited movement.
Index Options for Portfolio Hedge: Traders holding multiple stocks often hedge using Nifty or Bank Nifty puts instead of individual stock options.

Part 12 Trading Master ClassImportance of Time Decay (Theta)
Another vital concept in options trading is Theta, which measures how much the value of an option decreases as it approaches expiry — this is called time decay.
Buyers of options lose value daily because the time value erodes.
Sellers (writers) benefit from time decay as they collect premium that melts away if the market remains range-bound.

Part 11 Trading Master ClassTaxation and Regulations in India
In India:
Profits from options trading are treated as business income.
Traders must file under F&O income while filing Income Tax.
Options trading is regulated by SEBI and executed through NSE/BSE.
Always ensure you trade only through authorized brokers and maintain proper records for compliance.

Part 9 Trading Master ClassChoosing the Right Strategy
Selecting the right options strategy depends on three factors:
Market Outlook:
Bullish → Long Call, Bull Call Spread, Short Put
Bearish → Long Put, Bear Put Spread, Covered Call
Neutral → Iron Condor, Butterfly, Short Straddle
Volatility:
High volatility → Buy options (Straddle, Strangle)
Low volatility → Sell options (Condor, Credit spreads)
Risk Appetite:
Low-risk → Spreads
Medium-risk → Covered/Protective positions
High-risk → Naked calls/puts

Part 10 Trade Like InstitutionsAdvanced Option Strategies
a) Butterfly Spread
Market View: Very Neutral (Expecting Minimal Movement)
Action: Buy 1 lower strike call + Sell 2 middle strike calls + Buy 1 higher strike call.
It profits if the market remains near the middle strike.
Risk: Limited.
Reward: Limited but high probability of success.
b) Calendar Spread
Market View: Expecting Low Short-Term Volatility but High Long-Term Movement
Action: Sell near-month option + Buy next-month option of same strike.
Used by professional traders to take advantage of time decay differences between expiries.

Part 8 Trading master Class Types of Option Trading Strategies
Options strategies are broadly divided into single-leg and multi-leg strategies.
Single-leg strategies: Involve buying or selling one option.
Multi-leg strategies: Combine two or more options (calls and puts) to create structured trades for specific market conditions.
Let’s discuss each category in detail.

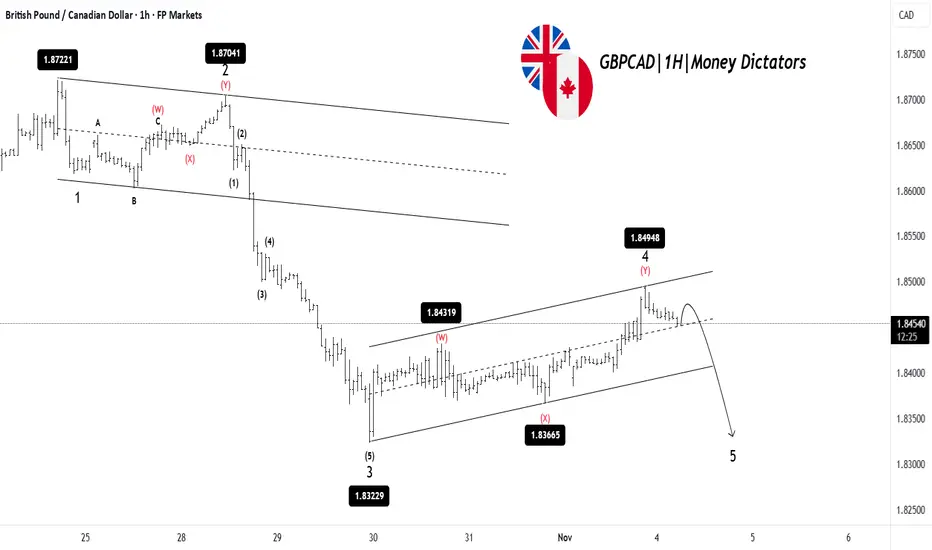
GBPCAD: Bears Ready to Push Into Wave 5GBPCAD has completed a clear 1-2-3 move to the downside, followed by a corrective Wave 4 that has pushed the price higher inside a rising channel. This correction now looks nearly complete, as the price is struggling to break above the resistance. Once Wave 4 is finished, the chart suggests a final drop into Wave 5 toward the lower support zone. That would complete the overall bearish structure before any larger reversal can happen. In simple terms: correction is almost done → one more leg down expected.
Stay tuned!
@Money_Dictators
Thank you :)
Technical Analysis and Chart PatternsIntroduction
Technical analysis is a cornerstone of modern trading and investing. It involves studying price charts and market data to forecast future price movements. Unlike fundamental analysis, which focuses on financial statements, earnings, and economic indicators, technical analysis revolves around price action, volume, and market psychology. It assumes that all relevant information is already reflected in the price, and history tends to repeat itself through recognizable chart patterns and trends.
Core Principles of Technical Analysis
Technical analysis operates on three main principles:
Price Discounts Everything:
All known information—economic data, earnings, market sentiment, or political events—is already factored into the stock price. Therefore, analyzing price action alone can reveal the collective behavior of market participants.
Price Moves in Trends:
Markets rarely move randomly. Prices tend to move in identifiable trends—upward, downward, or sideways. Recognizing these trends early allows traders to position themselves advantageously.
History Repeats Itself:
Human psychology drives markets—fear, greed, hope, and panic repeat across generations. Therefore, patterns formed in the past tend to recur, providing clues about future price action.
Types of Technical Charts
Before identifying patterns, one must understand chart types used in technical analysis:
Line Chart:
It connects closing prices over a specific period, providing a simple view of the trend.
Bar Chart:
Each bar represents the open, high, low, and close (OHLC) for a given period. It gives more insight than a line chart.
Candlestick Chart:
The most popular chart among traders, candlesticks visually show market psychology. A bullish candle (close > open) is often green or white, while a bearish candle (close < open) is red or black.
Candlestick formations help identify reversals and continuations in price.
Trend Analysis
A trend is the general direction of price movement. It can be classified as:
Uptrend: Series of higher highs and higher lows.
Downtrend: Series of lower highs and lower lows.
Sideways/Range: Prices oscillate between support and resistance.
Traders use trendlines and channels to visualize and trade along the trend. The saying “Trend is your friend” highlights the importance of trading with the prevailing direction rather than against it.
Key Tools in Technical Analysis
Support and Resistance Levels:
Support: A price level where buying pressure prevents further decline.
Resistance: A level where selling pressure halts price advances.
When a resistance is broken, it can turn into new support and vice versa.
Moving Averages:
They smooth out price data to identify trend direction.
Simple Moving Average (SMA) – average of closing prices over a period.
Exponential Moving Average (EMA) – gives more weight to recent prices.
Common crossovers like the Golden Cross (short-term MA crosses above long-term MA) and Death Cross (short-term MA crosses below long-term MA) indicate trend reversals.
Volume Analysis:
Volume measures market participation. Increasing volume confirms the strength of a trend, while declining volume may signal weakening momentum.
Indicators and Oscillators:
Tools like Relative Strength Index (RSI), Moving Average Convergence Divergence (MACD), Bollinger Bands, and Stochastic Oscillator help identify overbought/oversold conditions, momentum shifts, and trend confirmation.
Chart Patterns in Technical Analysis
Chart patterns are visual formations created by price movements. They represent the psychological struggle between buyers and sellers and help traders predict potential outcomes.
Patterns are generally divided into reversal patterns and continuation patterns.
1. Reversal Patterns
These indicate that a current trend is likely to change direction.
a. Head and Shoulders
One of the most reliable reversal patterns.
Appears at the end of an uptrend.
Consists of three peaks: a higher middle peak (head) between two smaller ones (shoulders).
Neckline break confirms a bearish reversal.
Inverse Head and Shoulders appears at the bottom of a downtrend and signals a bullish reversal.
b. Double Top and Double Bottom
Double Top: Price hits a resistance twice, forming an “M” shape, signaling a bearish reversal.
Double Bottom: Price touches support twice, forming a “W” shape, indicating a bullish reversal.
c. Triple Top and Triple Bottom
Similar to double patterns but with three peaks or troughs. They confirm stronger reversals after multiple failed attempts to break support/resistance.
d. Rounding Bottom (Saucer Bottom)
Indicates a gradual shift from bearish to bullish sentiment over time. Common in long-term trend reversals.
e. Falling and Rising Wedges
Falling Wedge: Occurs during a downtrend and signals a bullish reversal.
Rising Wedge: Forms during an uptrend and signals a bearish reversal.
The breakout direction typically opposes the wedge slope.
2. Continuation Patterns
These suggest that the existing trend will continue after a brief pause or consolidation.
a. Triangles
Ascending Triangle: Horizontal resistance with rising support. Usually bullish.
Descending Triangle: Horizontal support with falling resistance. Usually bearish.
Symmetrical Triangle: Converging trendlines; breakout can occur in either direction.
b. Flags and Pennants
Flags: Small rectangular consolidations that form after a sharp move (flagpole). Breakout in the same direction resumes the prior trend.
Pennants: Similar to flags but shaped like small symmetrical triangles.
c. Rectangles (Price Channels)
When price oscillates between parallel support and resistance lines, it indicates accumulation or distribution. A breakout determines the next direction.
d. Cup and Handle
Looks like a tea cup: a rounded “cup” followed by a small “handle” consolidation. A breakout above the handle signals bullish continuation.
Candlestick Patterns
In addition to chart patterns, candlestick patterns offer short-term trading signals:
Bullish Engulfing: Large bullish candle engulfs the previous bearish candle—signals buying momentum.
Bearish Engulfing: Large bearish candle engulfs the previous bullish one—signals selling pressure.
Doji: Open and close prices are nearly equal, indicating indecision.
Hammer & Inverted Hammer: Found at bottoms, indicating potential reversals.
Shooting Star: Appears at tops, suggesting bearish reversal.
Combining Patterns with Indicators
Professional traders often combine chart patterns with technical indicators for confirmation.
Example:
A head and shoulders pattern confirmed by falling RSI strengthens the bearish outlook.
A cup and handle confirmed by rising volume adds validity to a bullish move.
This multi-factor approach reduces false signals and increases accuracy.
Advantages of Technical Analysis
Quick Decision-Making: Real-time charts provide instant trading opportunities.
Universal Application: Works across stocks, forex, commodities, and crypto.
Captures Market Psychology: Reflects fear and greed through patterns.
Supports Short-Term Trading: Ideal for day traders and swing traders.
Limitations of Technical Analysis
Subjectivity: Two traders may interpret the same chart differently.
False Breakouts: Patterns may fail, especially in volatile markets.
Lagging Indicators: Some tools like moving averages react after price changes.
No Fundamental Insight: It ignores earnings, news, and macroeconomic data.
Conclusion
Technical analysis is both an art and a science. By studying chart patterns, trends, and indicators, traders can anticipate potential price moves with greater confidence. However, success in technical analysis demands discipline, patience, and risk management. Patterns don’t guarantee results; they only increase probabilities. Combining chart patterns with volume analysis, market context, and proper stop-loss strategies creates a strong foundation for consistent profitability.
Ultimately, mastering technical analysis means understanding how market psychology shapes price movements—and using that knowledge to stay one step ahead of the crowd.
Private vs Public Banks in the Indian Market1. Ownership and Management Structure
The fundamental difference between public and private banks lies in ownership.
Public Sector Banks (PSBs) are majority-owned by the Government of India, which holds more than 50% of their equity. The government plays a key role in appointing top executives and formulating policy directions. Examples include State Bank of India (SBI), Punjab National Bank (PNB), Bank of Baroda (BoB), and Canara Bank.
Private Sector Banks (PVBs), on the other hand, are owned and managed by private entities or individuals, with the government having little or no control. The management is typically professional, and boards are accountable to private shareholders. Major private banks include HDFC Bank, ICICI Bank, Axis Bank, Kotak Mahindra Bank, and IndusInd Bank.
This difference in ownership affects how both types of banks operate, their decision-making processes, and their responsiveness to market conditions.
2. Historical Background
Public sector banks form the backbone of India’s traditional banking system. They gained prominence after bank nationalization in 1969 and 1980, which brought 20 major banks under government control. The aim was to ensure that banking services reached rural and underbanked areas, supporting agriculture, small industries, and social development.
Private banks, however, emerged in two waves:
The first phase included old private banks such as Karur Vysya Bank, South Indian Bank, and Federal Bank, which were regional and limited in scale.
The second phase, or the “new generation” private banks, began after the economic liberalization of 1991, when the Reserve Bank of India (RBI) allowed new private players to enter. Banks like HDFC Bank, ICICI Bank, and Axis Bank brought innovation, technology, and competition to the market.
3. Operational Efficiency and Technology
Private sector banks are widely recognized for their efficiency and technological advancement. They were pioneers in introducing digital banking, internet and mobile apps, ATMs, 24/7 customer service, and AI-based financial solutions. Their focus on automation and quick service appeals especially to urban customers.
Public banks, though initially slower to adopt technology, have made significant progress in recent years. Initiatives like YONO by SBI, Bank of Baroda’s digital transformation, and PSB Alliance have modernized public banking. However, public banks still face challenges due to their vast legacy systems and bureaucratic procedures.
4. Customer Service and Experience
Private banks are often perceived as offering superior customer service, with faster processing times, personalized products, and proactive relationship management. Their staff is trained to focus on efficiency and customer satisfaction.
Public banks, however, have traditionally been known for longer processing times and formal procedures. Yet, they provide an essential service to a larger section of society, especially in rural and semi-urban areas where private banks may not have strong penetration. PSBs are more committed to social welfare schemes such as Jan Dhan Yojana, Mudra loans, and agricultural credit programs.
5. Market Reach and Financial Inclusion
In terms of reach, public sector banks hold a dominant position. They have thousands of branches across rural India, ensuring that even remote populations have access to banking facilities. For instance, SBI alone accounts for more than 20% of India’s total banking network.
Private banks, conversely, focus primarily on urban and metropolitan regions where customers demand faster, technology-driven services. However, they are now expanding into Tier 2 and Tier 3 cities to capture a growing middle-class market.
6. Profitability and Performance
Private banks usually exhibit higher profitability, better asset quality, and more stable returns. Their operational flexibility, low non-performing asset (NPA) ratios, and efficiency in cost management contribute to superior financial performance. For instance, banks like HDFC and ICICI consistently report high return on assets (ROA) and return on equity (ROE).
Public banks, due to their social obligations and exposure to priority sectors, often face higher NPAs and lower profitability. Lending to agriculture, infrastructure, and small enterprises—though socially vital—sometimes leads to defaults. However, government support through recapitalization and mergers (like SBI with its associate banks) helps maintain their financial stability.
7. Lending Patterns and Risk Management
Public banks prioritize social and developmental objectives, lending to priority sectors such as agriculture, small industries, and low-income groups. They are also instrumental in implementing government schemes like PMEGP, Stand-Up India, and PM Kisan.
Private banks focus more on profitable segments such as retail loans, home loans, credit cards, and wealth management. They employ advanced risk assessment tools, AI-driven credit scoring, and market-based pricing, which help reduce bad loans and maintain better credit discipline.
8. Employment and Work Culture
Public sector banks provide job security, stable career paths, and government-linked benefits. They attract candidates through national-level exams conducted by IBPS or SBI. However, the work culture can be bureaucratic, hierarchical, and slower in decision-making.
Private banks offer performance-based incentives, faster promotions, and modern work environments, but job security is lower. They emphasize productivity, targets, and results, often leading to higher stress levels but better pay for top performers.
9. Regulatory Environment
Both public and private banks are regulated by the Reserve Bank of India (RBI) and governed by the Banking Regulation Act, 1949. However, PSBs are also accountable to the Ministry of Finance and the Parliament of India, which increases oversight but sometimes limits autonomy. Private banks enjoy greater independence in policy decisions but must adhere strictly to RBI norms.
10. Public Trust and Perception
Public banks enjoy a high level of trust among citizens, especially older generations and rural populations, because of government backing. Depositors believe their money is safe, even if the bank faces trouble, as the government is expected to intervene.
Private banks are viewed as modern, efficient, and customer-friendly, but public confidence fluctuates based on market performance. However, strong brands like HDFC Bank and ICICI Bank have built reputations rivaling public banks in reliability.
11. Future Trends and Outlook
The future of India’s banking sector lies in coexistence and collaboration between public and private players.
Public banks are likely to focus on financial inclusion, rural expansion, and implementation of government initiatives.
Private banks will continue to drive technological innovation, digital lending, and customer-centric growth.
Additionally, the rise of fintech companies, digital payments platforms (like Paytm and PhonePe), and neo-banks is pushing both sectors toward modernization and customer-focused strategies.
Government-led reforms such as bank mergers, recapitalization packages, and privatization plans indicate an evolving structure aimed at improving competitiveness and efficiency. As India’s economy grows, both public and private banks will play complementary roles in supporting national development and financial stability.
Conclusion
In summary, public sector banks represent the traditional, inclusive, and socially driven side of Indian banking, while private sector banks symbolize innovation, efficiency, and profit-oriented growth. Each has its strengths: public banks bring trust, accessibility, and social responsibility, while private banks bring technology, speed, and superior service quality.
The Indian market thrives on this balance — where government-backed institutions ensure inclusive development and private banks drive modernization and competition. Together, they form a robust dual system that continues to evolve, reflecting the dynamic needs of a rapidly developing economy.

Relative Strength Index (RSI) Indicator Secrets1. The Hidden Meaning Behind RSI Levels
Most traders use the 70/30 rule blindly. In reality, RSI levels are relative, not absolute. For instance:
In a strong uptrend, RSI can remain above 70 for a long period — this does not mean the market will immediately reverse. It often indicates strong bullish momentum.
In a downtrend, RSI can stay below 30 for an extended time — signaling strong bearish pressure, not necessarily an immediate bounce.
Secret Tip:
Adjust your RSI levels based on market conditions:
Bullish market: Use RSI zones of 40–80 (support around 40, resistance around 80).
Bearish market: Use RSI zones of 20–60 (resistance around 60, support around 20).
By doing this, you interpret RSI in the context of trend strength rather than treating it as an isolated signal.
2. RSI as a Trend Identifier
One of the most overlooked uses of RSI is trend confirmation. Traders often rely on moving averages or price patterns to identify trends, but RSI can do this more efficiently.
In uptrends, RSI tends to stay above 40 and frequently reach 70–80.
In downtrends, RSI remains below 60 and often hits 20–30.
Secret Insight:
If RSI repeatedly bounces from the 40–50 zone during a price pullback, it suggests that the uptrend is healthy. Conversely, if RSI fails to move above 60 during rallies, it signals weakness in the market.
This method helps traders stay with the trend longer, instead of prematurely exiting a position when RSI crosses traditional overbought or oversold levels.
3. RSI Divergence – The Ultimate Reversal Signal
RSI divergence is one of the strongest signals for trend reversal. It occurs when the price makes a new high or low that isn’t confirmed by the RSI.
Bullish Divergence: Price makes a lower low, but RSI makes a higher low — signaling potential upward reversal.
Bearish Divergence: Price makes a higher high, but RSI makes a lower high — indicating possible downward reversal.
Secret Tip:
For divergence to be effective, it must occur after a strong trend and be confirmed by volume or candlestick patterns (like Doji, hammer, or engulfing). Many traders lose money by trading every small divergence — patience is key.
Additionally, hidden divergence can predict trend continuation:
Hidden Bullish Divergence: RSI makes a lower low, but price makes a higher low → continuation of uptrend.
Hidden Bearish Divergence: RSI makes a higher high, but price makes a lower high → continuation of downtrend.
Combining regular and hidden divergences can give traders early entry signals and improve accuracy.
4. RSI Swing Rejections: The Secret Entry Technique
Welles Wilder’s original writings described an advanced RSI technique called “Swing Rejection”, which most traders overlook.
A bullish swing rejection occurs when:
RSI drops below 30 (oversold zone).
It rises above 30.
Pulls back but stays above 30.
Then breaks its previous high.
This pattern signals a strong bullish reversal — often before the price fully turns up.
A bearish swing rejection is the opposite:
RSI rises above 70.
Falls below 70.
Rebounds but fails to cross 70 again.
Then breaks its prior low — confirming weakness.
Secret Insight:
Swing rejections filter out false overbought/oversold signals and identify high-probability turning points in the market.
5. RSI with Multiple Time Frames
Professional traders rarely rely on a single RSI setting or timeframe. Instead, they confirm RSI signals across multiple timeframes.
For example:
If the daily RSI is oversold but the weekly RSI is still in a downtrend, the bounce may be short-lived.
When both daily and weekly RSI align in the same direction, it indicates a powerful trend reversal or continuation.
Secret Tip:
Use RSI(14) on higher timeframes (daily/weekly) for trend bias, and RSI(7) or RSI(9) on lower timeframes (hourly or 4-hour) for precise entries.
6. RSI and Moving Averages – A Smart Combination
Combining RSI with moving averages creates a more reliable trading system. For example:
Use a 50-period moving average to determine the trend direction.
Trade RSI signals only in the direction of the moving average.
Example:
If the price is above the 50-MA and RSI bounces from 40 → it’s a strong buy signal.
If the price is below the 50-MA and RSI drops from 60 → it’s a strong sell signal.
This combination filters out false signals and aligns trades with the dominant market trend.
7. RSI Range Shifts – The Professional Secret
A rarely discussed RSI secret is the concept of range shifts. In a strong uptrend, RSI tends to move between 40–80 instead of 30–70. In a strong downtrend, it shifts between 20–60. Recognizing this range shift early helps traders identify when the market transitions from sideways to trending behavior.
When RSI consistently fails to fall below 40 and pushes above 70, it confirms that bulls control the market. Conversely, when RSI struggles to rise above 60 and keeps hitting 30, bears dominate.
Spotting a range shift early can help you enter trends sooner and ride them longer.
8. Customizing RSI Periods for Different Assets
Most traders use the default 14-period RSI. However, adjusting the period can dramatically change its responsiveness:
Shorter RSI (5 or 7): More sensitive, gives early signals but more noise.
Longer RSI (20 or 30): Smoother, fewer false signals but more lag.
Secret Tip:
For volatile instruments like cryptocurrencies or small-cap stocks, use a shorter RSI (7–10).
For stable assets like large-cap stocks or indices, use longer RSI (14–21).
Customizing RSI settings according to volatility improves accuracy and reduces whipsaws.
9. Psychological Secrets of RSI
At its core, RSI reflects market psychology — the tug-of-war between buyers and sellers. When RSI rises above 70, it shows traders’ greed; when it falls below 30, it reveals fear. Understanding this helps you trade in the opposite direction of crowd emotions.
The best traders use RSI not just as a technical tool, but as a window into trader sentiment. Combining RSI readings with support/resistance zones or volume analysis offers a powerful edge.
10. Conclusion
The RSI indicator is far more than a simple overbought/oversold tool. Its true strength lies in understanding context, trend structure, divergence, and range behavior. By mastering RSI’s hidden secrets — such as swing rejections, range shifts, and multiple timeframe confirmations — traders can dramatically improve accuracy and timing.
When used intelligently, RSI reveals the rhythm of market momentum and helps traders ride trends, spot reversals, and stay on the right side of price action. Like all tools, it works best when combined with sound risk management, patience, and discipline — the true secrets behind profitable trading.