Momentum Trading Secrets: Unlocking the Market’s Hidden Energy1. The Science of Momentum
Momentum trading is rooted in behavioral finance and market psychology. It leverages the tendency of investors to underreact or overreact to new information, creating sustained price moves. The basic scientific principle can be summarized as:
“Assets that have performed well recently are likely to continue performing well in the near future, and vice versa.”
Key aspects include:
Trend Identification: Momentum traders look for assets with strong directional movement.
Rate of Change (ROC): Calculating how fast an asset’s price is changing helps determine momentum strength.
Volume Confirmation: High trading volume validates the sustainability of a trend.
Behavioral Patterns: Fear and greed amplify trends, making momentum strategies more predictable.
2. Tools and Indicators in Momentum Trading
Momentum traders rely heavily on technical indicators to gauge the strength of a move. Some of the most effective tools include:
Relative Strength Index (RSI): Measures overbought or oversold conditions to anticipate potential trend continuations or reversals.
Moving Average Convergence Divergence (MACD): Helps identify trend direction and momentum shifts.
Stochastic Oscillator: Useful for spotting trend reversals or continuation signals in volatile markets.
Volume Weighted Average Price (VWAP): Indicates the average price weighted by volume, often used by institutional traders to confirm momentum.
Rate of Change (ROC): Measures the percentage change in price over a specific period, signaling momentum strength.
The secret lies in combining indicators rather than relying on one. For example, using RSI for trend strength and MACD for entry timing often produces higher-probability trades.
3. Secrets to Identifying True Momentum
Not all price movements represent genuine momentum. The following secrets help distinguish real trends from false signals:
Look Beyond the Noise: Small price fluctuations are often misleading. True momentum comes with consistent directional moves and high volume.
Time Frame Alignment: Momentum should be confirmed across multiple time frames. A short-term uptrend in a long-term downtrend can be risky.
Sector and Market Context: Stocks often move in sync with sectors. Identifying sector momentum can increase trade success.
Catalyst Awareness: Earnings reports, news events, and macroeconomic data often trigger strong momentum moves.
Volume Patterns: Sudden spikes in volume often precede sharp moves, indicating institutional participation.
4. Entry and Exit Strategies
Mastering momentum trading requires precise timing. Secrets in execution include:
Breakout Trading: Enter trades when price breaks key resistance or support levels with high momentum.
Pullback Entries: Waiting for minor retracements during a trend allows for safer entries at lower risk levels.
Trailing Stop Losses: Using dynamic stops that follow the trend ensures profits are locked in while letting winners run.
Scaling Positions: Incrementally increasing positions as momentum strengthens reduces risk exposure.
The critical secret: never fight the trend. Momentum trading is about riding the wave, not predicting reversals.
5. Risk Management Secrets
Momentum trading can be extremely profitable but also highly risky if not managed properly. Successful traders use:
Position Sizing: Limiting exposure to a small percentage of the trading account prevents catastrophic losses.
Stop Loss Discipline: Predefined exit points are crucial, as momentum can reverse quickly.
Diversification: Trading across multiple assets or sectors spreads risk while capturing diverse momentum opportunities.
Volatility Assessment: Understanding the volatility of the instrument ensures proper risk-reward alignment.
The secret is balancing aggressive profit potential with controlled risk, turning a volatile strategy into a sustainable one.
6. Psychological Edge in Momentum Trading
Momentum trading is as much about mindset as strategy. The key psychological secrets include:
Emotion Control: Fear and greed can destroy momentum trades. Sticking to rules and systems is vital.
Patience and Discipline: Waiting for the right setup rather than chasing price is a hallmark of successful traders.
Adaptability: Market conditions change. Momentum traders must adjust strategies to new trends, not rely on past performance.
Confidence vs. Overconfidence: Understanding the difference ensures consistent execution without reckless risk-taking.
7. Advanced Momentum Trading Techniques
Seasoned traders often leverage advanced techniques to amplify profits:
Sector Rotation Strategy: Moving capital into sectors showing strongest momentum while exiting weak sectors.
Pairs Trading with Momentum: Trading correlated assets by buying the stronger momentum asset and shorting the weaker.
Algorithmic Momentum Strategies: Using quantitative models to scan multiple instruments and automatically execute trades.
Options for Momentum Leverage: Using call and put options to magnify returns while managing capital efficiently.
These techniques reveal the “hidden secrets” of institutional-level momentum trading, making it more than just buying high and selling higher.
8. Common Mistakes to Avoid
Even experienced traders stumble when ignoring momentum trading rules. Common pitfalls include:
Chasing Trends Too Late: Entering after most of the move is over reduces profit potential.
Ignoring Volume: Low-volume momentum often reverses unexpectedly.
Over-Leveraging: Excessive leverage can wipe out accounts during sudden reversals.
Neglecting Market Context: Ignoring broader market trends can lead to false signals.
Awareness of these mistakes is a secret weapon in protecting both capital and confidence.
9. Case Studies of Momentum Trading Success
Momentum trading has produced legendary gains for traders who mastered its secrets. For instance:
Tech Stock Surges: Riding early momentum in high-growth tech companies during earnings announcements.
Commodity Moves: Capturing sharp momentum in oil or gold during geopolitical events.
Cryptocurrency Trends: Exploiting rapid price swings with disciplined momentum strategies.
These examples highlight that momentum trading is applicable across markets and time frames, provided the rules are followed.
10. The Future of Momentum Trading
With advancements in technology, momentum trading is evolving:
AI and Machine Learning: Algorithms can detect momentum patterns faster than human traders.
Social Sentiment Analysis: Platforms now measure crowd psychology and predict momentum based on social chatter.
High-Frequency Trading (HFT): Institutional traders use speed and algorithms to exploit tiny momentum shifts.
Traders who understand these trends and adapt their strategies will maintain a competitive edge in the future markets.
Conclusion
Momentum trading is an art backed by science. Its secrets lie not just in indicators or charts, but in understanding market psychology, managing risk, and executing trades with discipline. By mastering trend identification, entry and exit timing, and psychological control, traders can transform momentum strategies into consistent profit engines.
While momentum trading can seem risky, applying these secrets systematically turns volatility into opportunity. In today’s fast-moving markets, momentum trading remains one of the most powerful tools for traders willing to combine technical skill with strategic insight.
Contains image
Scalping Bank Nifty: Strategies, Techniques, and Risk Management1. Understanding Bank Nifty
Bank Nifty is the Nifty Bank Index, representing the 12 most liquid and large-cap banking stocks listed on the NSE. Its movements are heavily influenced by:
RBI monetary policies
Inflation data
Interest rate changes
Banking sector earnings and news
Global financial market movements
Because of its volatility, Bank Nifty is ideal for intraday trading strategies like scalping. It typically moves in a wide price range within a trading day, offering multiple opportunities for profit if trades are executed correctly.
2. Basics of Scalping
Scalping focuses on small, frequent gains rather than holding positions for long-term appreciation. Key elements of scalping include:
Timeframe: Usually 1-minute, 3-minute, or 5-minute charts.
Trade duration: Seconds to a few minutes.
Target profit per trade: Often between 10–50 points in Bank Nifty.
Stop loss: Tight stops, often 5–20 points.
The goal is consistency rather than large single-trade profits. Scalping thrives on high liquidity and minimal spreads, both characteristics of Bank Nifty.
3. Key Tools and Indicators for Scalping Bank Nifty
Successful scalpers rely on a combination of technical indicators, market analysis tools, and chart patterns:
a. Moving Averages (MA):
5 EMA and 20 EMA are commonly used.
Buy signals occur when the short-term EMA crosses above the long-term EMA, and sell signals occur on the reverse.
b. Bollinger Bands:
Identify overbought and oversold conditions.
Scalpers can enter trades when price touches the lower or upper band and exits when it reverts to the mean.
c. Relative Strength Index (RSI):
Measures momentum; scalpers often use 14-period RSI on 1-minute charts.
Overbought >70, Oversold <30 signals help time entry and exit.
d. MACD (Moving Average Convergence Divergence):
Detects trend direction and momentum.
Quick crossovers of MACD line over signal line provide short-term trade opportunities.
e. Market Depth & Order Flow:
Scalpers monitor the live bid-ask spread to anticipate price moves.
Large orders or imbalances can indicate short-term reversals or breakouts.
4. Scalping Strategies for Bank Nifty
Several popular strategies exist for intraday scalping:
a. Trend-Following Scalping:
Enter trades in the direction of the short-term trend.
Use EMAs or moving averages to confirm trend.
b. Range-Bound Scalping:
Works during low volatility sessions.
Identify support and resistance levels and trade bounces between them.
c. Breakout Scalping:
Exploit sudden price moves when Bank Nifty breaks key intraday levels.
Confirm breakout with volume and momentum indicators.
d. News-Based Scalping:
Intraday trades triggered by economic news or RBI announcements.
Requires rapid execution and awareness of market-moving events.
5. Risk Management in Scalping
Because scalping involves frequent trades with tight stops, risk management is critical:
Capital Allocation: Never risk more than 1–2% of capital per trade.
Stop Loss: Always predefine and strictly follow.
Trade Frequency: Avoid overtrading; quality over quantity.
Exit Strategy: Know your target points and exit at predefined levels.
Psychological Discipline: Avoid emotional trading, as rapid losses can compound quickly.
6. Choosing the Right Brokerage and Platform
Scalping demands low-latency platforms with fast order execution. Key features include:
Real-time market data
Minimal lag and downtime
Advanced charting tools
Direct market access (DMA) for speed
Popular brokers for Bank Nifty scalping include Zerodha Kite, Upstox Pro, Angel Broking, and ICICI Direct.
7. Common Mistakes in Bank Nifty Scalping
Overleveraging positions
Ignoring market news
Trading against the trend
Holding losing trades for too long
Lack of predefined entry and exit rules
Learning from mistakes is essential for long-term profitability. Scalping requires a combination of skill, discipline, and constant market awareness.
8. Psychological and Emotional Aspects
Scalping is mentally demanding:
Constant attention to charts
Quick decision-making under pressure
Managing stress from rapid wins and losses
Successful scalpers often take breaks between sessions and maintain a trading journal to analyze performance.
9. Backtesting and Practice
Before trading live, scalpers should:
Backtest strategies on historical Bank Nifty data
Use paper trading or demo accounts
Track performance metrics such as win rate, average profit/loss, and drawdown
10. Conclusion
Scalping Bank Nifty can be highly profitable, but it demands skill, discipline, and the right tools. By combining technical analysis, market awareness, and strict risk management, traders can capitalize on short-term price movements while minimizing losses. Scalping is not suitable for everyone—it requires dedication, focus, and the mental fortitude to handle rapid market changes.
When executed correctly, Bank Nifty scalping can become a consistent source of intraday profits, leveraging India’s most liquid index for high-frequency trading opportunities.
Demat Account Secrets in Trading —Every Traders Should KnowIntroduction
A Demat account is the digital locker for your shares and securities — the backbone of equity investing and trading in modern markets. But beyond opening an account and watching prices, there are plenty of practical, operational, and strategic “secrets” that experienced traders and long-term investors use to reduce costs, manage risks, and extract real value. This guide unpacks those lesser-known but high-impact insights: from choosing the right Depository Participant (DP) and optimizing charges, to advanced features like pledging, e-voting, corporate actions handling, fraud prevention, and tax implications. Whether you’re a frequent intraday trader, a swing trader, or a buy-and-hold investor, these tips will help you use your Demat account more intelligently.
1. Demat 101 — the fundamentals (so you can stop guessing)
A Demat (dematerialized) account holds securities in electronic format. In India, two depositories — NSDL and CDSL — maintain the records; brokers or banks act as Depository Participants (DPs) who provide the interface. When you buy shares, they land in your Demat account; when you sell, they are debited.
Key components:
DP (Depository Participant): Your broker/bank managing the Demat.
Client ID / Beneficiary Owner (BO) ID: Unique identifier for holdings.
ISIN: International Security Identification Number for each instrument.
Statement of Holdings (MSOH): Periodic summary of your holdings.
Understanding the basics helps avoid simple but costly mistakes, like missing corporate action deadlines or confusing a brokerage trading account fee with a DP demat charge.
2. Choosing the right DP — the biggest hidden lever for costs & convenience
Everyone talks about brokerage, but DP fees and service quality quietly shape net returns.
What to compare:
Account opening fees and annual maintenance charges (AMC) — DPs vary widely.
Transaction fees / custodian charges — per scrip or flat per transaction?
Pledge/unpledge fees — important if you use margin funding.
Speed & UI of the DP portal/app — corporate actions, e-voting, and statements are handled through the DP interface.
Customer service responsiveness — when issues arise (frozen shares, IPO refunds), fast support saves money.
Integration with your broker — some brokers offer bundled Demat+trading at lower cost.
Value-adds — auto-pay for corporate actions, consolidated statements, or tax reports.
A little fee shopping can save hundreds per year for active traders. If you trade frequently, prioritize low transaction/DVP (delivery versus payment) costs. If you hold long-term, low AMC and reliable corporate action handling matter more.
3. Know every charge — the micro-fees that add up
Demat-related costs are often small, but they compound.
Common fees:
Account opening fee
Annual maintenance charge (AMC)
Transaction charges (debited shares, off-market transfer)
Rematerialization fee (if you want physical certificates)
Pledge/unpledge fee
Dematerialization fee (converting physical to electronic)
Re-registration fee (if transferring DP)
Pro tip: Ask for a clear fee schedule before opening. Some DPs waive AMC for the first year or if you maintain a minimum balance.
4. Pledging shares — a secret weapon (and its pitfalls)
Pledging lets you use your Demat holdings as collateral for loans or margin from your broker or financial institution without selling them. This is a powerful tool but needs careful handling.
When to pledge:
To avoid selling for short-term margin calls.
To take loans against shares for diversification, emergency liquidity, or tax planning.
Risks & secrets:
Margin haircut: Lenders apply haircuts; volatile scrips get lower borrowing value.
Forced unpledge/sell: If the borrower (you or broker) defaults, the lender can liquidate.
Pledge charges & delays: Unpledging can take time; if markets move quickly you might not recover positions in time.
Keep pledged shares low proportion of total holdings to preserve flexibility.
Best practice: Use pledging conservatively and document the exact terms — interest, margin maintenance, and liquidation triggers.
5. Corporate actions — don’t let freebies slip away
Corporate actions include dividends, bonus shares, rights issues, stock splits, and buybacks. These affect your holdings and tax position.
Secrets:
Auto-execution settings: Some DPs auto-apply rights/renunciation choices; others require manual action. Know your DP’s default.
Track ex-dates and record dates: Missing a record date can mean missing a dividend or allocation.
Tax implications: Dividends and buybacks have different taxation; plan around holding periods to optimize capital gains tax.
Fractional shares from corporate actions may be paid out in cash — watch your account for small value credits.
Tip: Set calendar reminders for big corporate events for your core holdings.
6. Intraday trading & Demat — what traders often misunderstand
Many intraday traders think Demat doesn’t matter because intraday uses the trading account. But Demat still influences some things:
Delivery cycles: If you convert an intraday position to delivery, shares will land in your Demat only after settlement — check T+1/T+2 rules for the exchange.
Transaction vs delivery charges: No Demat debit for intraday (since shares aren’t delivered), but frequent delivery trades create more DP debits and costs.
Avoid unnecessary delivery: If you don’t intend to hold beyond the day, use intraday product to avoid DP transaction costs.
Secret: Using product/overnight margin vs MIS/Intraday modes changes margin requirements and whether shares actually hit your Demat account.
7. Security & fraud prevention — protect the locker
Scams target accounts everywhere. Protecting your Demat is non-negotiable.
Practical measures:
No POA unless necessary: Power of Attorney allows brokers to debit shares; while convenient, it’s a risk if given indiscriminately.
Two-factor authentication for broker/DPS portals.
Regularly reconcile your MSOH with transactions — report discrepancies immediately.
Keep KYC up to date — mismatches slow down corporate actions and transfers.
Beware phishing & SMS frauds: Never share OTPs, passwords, or UCCs.
Freeze facility: Many DPs offer "freeze" on holdings to prevent off-market transfer — useful if you detect suspicious activity.
Secret: If you must grant POA for ease of trading, limit it and use a reputable broker with transparent audit logs and insurance cover.
8. Reconciliation and statements — the daily routine of pros
Make it a habit:
Check daily trade reports and weekly Demat statements.
Match buy/sell confirmations with Demat credits/debits.
Track corporate action updates and small credits (fractional payouts, interest).
Why this matters: Small reconciliation catches — like a miscredited dividend or a failed transfer — can save disputes and losses later.
9. Off-market transfers & gifts — tax and legal subtleties
Off-market transfer (transfer of shares between Demat accounts without exchange) is common for gifts, family transfers, or private transactions.
Secrets:
Stamp duty & documentation: Gifts may require stamped transfer forms and declarations.
Gift taxation: In many jurisdictions, gifts from non-relatives have tax consequences. Document relationship and value.
Lock-in periods for ESOPs: Employee stock plans often have restrictions — off-market transfers may be blocked until vesting or expiry.
Always get the paperwork right to avoid future audits or blocked transfers.
10. IPO allotment & ASBA — how Demat helps get allocations
When you apply for IPOs, you must provide your Demat beneficiary ID. ASBA (Application Supported by Blocked Amount) ties refunds to the bank account, but Demat ensures shares — if allotted — are credited cleanly. Tip: Keep your Demat details updated and ensure PAN/DP mapping is correct to avoid allotment or transfer failures.
11. Taxation & reporting — your Demat is a tax record
Demat statements are primary source documents for capital gains calculations. Hidden advantages:
Broker consolidated statements often include trade-wise P&L and tax reports — use them for accurate filings.
Record holding periods precisely to differentiate between short-term and long-term rates.
Track cost basis across corporate actions — splits, bonus shares, and mergers alter cost per share; your DP statement and ISIN mapping help reconstruct basis.
Secret: Use consolidated transaction history from DP + broker to build an auditable trail for taxes.
12. Advanced tricks traders use (legitimately)
Scrip selection for pledge-margins: Keep a small basket of high-liquidity, low-volatility blue-chips for emergency pledges — they attract better haircuts.
Arbitrage of corporate actions: Professional traders sometimes buy before bonus/record dates to capture specific corporate actions, but account for ex-dates and tax impacts.
Fractional sell tactic: For small fractional leftover holdings after corporate actions, monitor for cash credits or plan an off-market consolidation to reduce micro-lots.
Caveat: All strategies must respect exchange rules and insider trading laws.
13. Common mistakes & how to avoid them
Giving POA to unknown brokers. Fix: Use limited POA or avoid if not necessary.
Ignoring AMC & small fees. Fix: Annual review of DP and renegotiate or switch.
Not tracking corporate action timelines. Fix: Subscribe to alerts and maintain a calendar.
Assuming all charges are the broker’s responsibility. Fix: Read fee schedule and keep records.
Failure to reconcile statements. Fix: Weekly reconciliation habit.
14. Switching DPs — the painless way
If you’re unhappy, transfer holdings using the Off-Market Transfer or Consolidation process. You’ll submit a DIS (Delivery Instruction Slip) at your current DP or use electronic transfer forms. Watch for transfer fees and timing — sometimes it’s cheaper to transfer slowly to avoid peak fees.
Secret: Coordinate transfer during low market activity to avoid missing corporate action deadlines.
15. Final checklist — your Demat hygiene
Know your DP’s fee schedule inside out.
Keep KYC & bank details updated and linked.
Avoid giving unrestricted POA; prefer limited authorizations.
Reconcile statements weekly.
Use pledge sparingly and understand haircut rules.
Track corporate action dates and tax implications.
Enable strong authentication and freeze options if suspicious activity occurs.
Use consolidated broker/DP tax reports at filing time.
Conclusion
A Demat account is more than a passive repository — it’s an operational hub for your market activity. Traders who master its mechanics and hidden levers (fee optimization, pledge use, corporate action handling, security practices) gain efficiency, reduce unexpected costs, and protect themselves from fraud. Whether you’re day-trading, swing trading, or building a long-term portfolio, treat your Demat account with the same discipline you apply to strategy and risk management. Small operational advantages compound over months and years — and often separate consistent winners from unlucky participants.
Small Account Challenge in TradingWhy Small Account Challenges Are Popular
Several factors make small account challenges attractive to traders:
Low Financial Risk:
Trading with a small account reduces the exposure to catastrophic losses. This makes it ideal for beginners or those who want to learn without risking life-changing amounts.
Skill Development:
Success in trading is more about strategy and discipline than capital. A small account forces traders to refine their skills, including technical analysis, market timing, and psychological control.
Motivation:
Turning a small sum into a meaningful amount, even modestly, provides immense satisfaction and confidence.
Accessibility:
Many brokers now allow trading with minimal capital, often under $100, making this challenge feasible for almost anyone.
Key Challenges of Small Accounts
While small account trading has its benefits, it also comes with significant hurdles:
Limited Position Size:
Small accounts restrict the ability to diversify or take large positions. This limitation can make profits small and slow to accumulate.
High Impact of Fees and Commissions:
Brokerage fees, spreads, and slippage affect small accounts disproportionately. A single losing trade can wipe out a large portion of the account if fees are high.
Emotional Pressure:
Small accounts require precision. Every loss feels magnified, which can create emotional stress and lead to impulsive decisions.
Leverage Temptation:
Traders often turn to leverage to amplify returns. While leverage can increase gains, it also exponentially increases risk, potentially wiping out a small account in seconds.
Scaling Profits:
Compounding small profits into substantial growth is slower compared to larger accounts, testing patience and consistency.
Psychology of Small Account Trading
The mental aspect of trading a small account is crucial. Many traders fail not due to strategy flaws but psychological weaknesses.
Fear of Loss:
With limited capital, fear of losing even a small amount can paralyze decision-making or cause early exits from trades.
Overtrading:
Small accounts often tempt traders to overtrade, chasing every opportunity to “grow fast,” which usually leads to losses.
Discipline and Patience:
Successful small account traders develop strong discipline—sticking to strategies, following risk management rules, and avoiding emotional trading.
Mindset Shift:
Instead of seeking quick wins, the focus should be on consistent, small gains and learning from each trade.
Strategies for Small Account Success
To thrive with a small trading account, traders need robust strategies tailored for low capital:
1. Risk Management
Risk only 1–2% of the account per trade.
Avoid leverage unless necessary and manageable.
Use stop-loss orders to protect capital.
2. Focused Markets
Trade highly liquid assets to ensure tight spreads and easy entry/exit.
Examples: major forex pairs, popular stocks, ETFs, or index options.
3. Scalping and Short-Term Trades
Short-term trades can maximize small capital by exploiting small price movements.
Scalping requires focus and discipline but can be effective for small accounts.
4. Position Sizing
Use micro-lots or fractional shares if possible.
Avoid large positions that could risk the entire account on a single trade.
5. Learning and Record-Keeping
Maintain a trading journal to track strategies, outcomes, and mistakes.
Continuously refine your strategy based on performance and market conditions.
The Role of Leverage
Leverage is a double-edged sword for small accounts. While it allows traders to control larger positions with limited capital, it significantly increases risk.
Pros: Potential for higher returns, faster account growth.
Cons: Risk of complete account wipeout, emotional stress, and overtrading.
A conservative approach is to use leverage sparingly, ensuring losses are manageable.
Advantages of the Small Account Challenge
Skill Mastery: Small accounts force traders to master discipline, strategy, and risk management.
Reduced Financial Pressure: Losses are smaller, making it easier to learn without catastrophic consequences.
Foundation for Larger Accounts: Mastery of small account trading sets the stage for trading larger accounts confidently.
Psychological Resilience: Learning to control emotions in a small account builds mental toughness for the long term.
Common Mistakes to Avoid
Chasing Quick Profits: Avoid impulsive trades to grow the account too quickly.
Ignoring Risk Management: Never risk too much of your account in a single trade.
Overleveraging: High leverage may be tempting but is often disastrous.
Neglecting Education: Continuous learning is crucial; rely on strategy and analysis, not luck.
Trading Too Many Markets: Focus on one or two markets to gain expertise.
Examples of Small Account Challenges
Many traders have successfully turned small accounts into substantial portfolios by applying discipline and consistency:
A forex trader may start with $500, risking 1–2% per trade, and after a year of disciplined trading, grow the account to $5,000.
A stock trader using fractional shares might start with $1,000 and focus on swing trades, gradually increasing account size while managing risk carefully.
The key is consistency, risk management, and learning from every trade.
Practical Tips for Small Account Trading
Start with Education: Learn technical analysis, chart patterns, indicators, and market fundamentals.
Use Demo Accounts First: Test strategies without risking real money.
Set Realistic Goals: Aim for steady growth (e.g., 5–10% per month) instead of unrealistic gains.
Track Every Trade: Analyze winners and losers to refine strategy.
Avoid High-Fee Brokers: Fees can eat small accounts quickly, so choose low-cost brokers.
Control Emotions: Avoid revenge trading and stick to your trading plan.
Conclusion
The small account challenge is more than a test of financial skill—it’s a test of discipline, patience, and emotional intelligence. While growing a small trading account is difficult, it teaches invaluable lessons about risk management, trading psychology, and strategic thinking.
Success in small account trading doesn’t come from luck or high-risk gambles; it comes from consistent, disciplined efforts, a strong strategy, and a mindset focused on learning rather than immediate profit. Traders who master small accounts set themselves up for long-term success, eventually handling larger accounts with confidence and expertise.
In essence, a small account challenge is not just a trading exercise—it is a bootcamp for professional traders, shaping skills, mindset, and habits that last a lifetime.
Midcap Multi-Bagger Moves in Trading1. Understanding Midcap Stocks
Midcap stocks generally refer to companies with a market capitalization ranging between ₹5,000 crore to ₹20,000 crore (or $500 million to $5 billion) depending on the market. They strike a balance between stability and growth potential:
Large-cap stocks are stable but slow-growing.
Small-cap stocks offer high growth but come with extreme volatility.
Midcap stocks combine growth potential with manageable risk, making them ideal candidates for multi-bagger moves.
Midcaps are often in the growth phase of their lifecycle. They have proven business models but are not yet fully recognized by institutional investors. This under-representation creates opportunities for early investors to gain extraordinary returns.
2. Characteristics of Midcap Multi-Bagger Stocks
Not all midcap stocks become multi-baggers. Successful midcap multi-baggers usually share some common characteristics:
Strong Revenue and Earnings Growth: Companies showing consistent growth in revenue and net profits, often higher than industry averages.
Scalable Business Model: Ability to expand operations, enter new markets, or increase product offerings without proportionally increasing costs.
Innovative Products/Services: Midcaps introducing unique products or services that create market disruption.
High Return Ratios: Consistently high ROE (Return on Equity) and ROCE (Return on Capital Employed) indicate efficient use of capital.
Low Debt Levels: Companies with manageable debt can reinvest profits into growth rather than servicing loans.
Institutional Recognition: Gradual interest from mutual funds and large investors often acts as a catalyst for price appreciation.
3. Factors Driving Multi-Bagger Moves
The movement of midcap stocks into multi-bagger territory is driven by a combination of fundamental, technical, and macroeconomic factors:
a) Fundamental Drivers
Profitability Expansion: Companies increasing margins due to operational efficiency, technology adoption, or scale benefits.
Sectoral Tailwinds: Industries experiencing high demand, regulatory support, or government incentives (like IT, renewable energy, pharmaceuticals).
Market Share Gains: Companies successfully capturing competitors’ market share through innovation or cost leadership.
b) Technical Drivers
Breakout Patterns: Price movements above historical resistance levels often attract momentum traders.
Volume Expansion: Rising volumes signal genuine investor interest and reduce liquidity concerns.
Institutional Accumulation: When large investors buy in gradually, it supports price stability and long-term uptrend.
c) Macroeconomic Factors
Economic Growth: Midcaps benefit more in a growing economy due to scalability and higher discretionary spending.
Policy Support: Favorable government policies like Make in India, tax incentives, or industry-specific reforms accelerate growth.
Liquidity Conditions: Low-interest rates and higher retail participation often drive up stock prices, including midcaps.
4. Strategies to Identify Midcap Multi-Baggers
Investors employ multiple strategies to identify potential midcap multi-baggers:
Fundamental Analysis:
Analyze balance sheets for revenue and profit growth.
Assess profitability ratios like ROE, ROCE, and profit margins.
Check debt-to-equity ratios and cash flows.
Sectoral Analysis:
Identify industries with high growth potential.
Look for midcaps within these sectors that are leaders or emerging leaders.
Technical Screening:
Use moving averages, trend lines, and volume indicators to spot breakout stocks.
Identify consolidation patterns that precede a rally.
Growth vs. Valuation Analysis:
A true multi-bagger is often undervalued relative to its growth potential.
Metrics like PEG ratio (Price/Earnings to Growth) can be useful.
Tracking Promoter Holding and Insider Buying:
Increasing promoter confidence is often a precursor to stock price appreciation.
Macro Awareness:
Be aware of government initiatives, economic cycles, and sector-specific reforms.
5. Risks Associated with Midcap Multi-Baggers
While midcap multi-baggers are enticing, they come with risks that every trader should be aware of:
Volatility: Prices can fluctuate dramatically due to low liquidity.
Market Sentiment: Negative news or global macro events can disproportionately impact midcaps.
Execution Risk: Companies may fail to scale operations efficiently, leading to missed expectations.
Overvaluation Risk: During bull markets, midcaps often get overvalued, leading to corrections.
Regulatory Risk: Policy changes can affect midcap companies more than established large-cap firms.
Risk management strategies like stop-loss orders, portfolio diversification, and position sizing are crucial to protect capital.
6. Trading Approaches for Midcap Multi-Baggers
There are multiple ways to approach midcap multi-bagger stocks in trading:
a) Long-Term Investment (Buy & Hold)
Buy fundamentally strong midcaps with multi-bagger potential.
Hold through market volatility to realize exponential gains over 3-5 years.
b) Momentum Trading
Focus on midcaps showing breakout patterns, high relative strength, and institutional buying.
Enter during upward trends and exit once momentum weakens.
c) Swing Trading
Identify short-term price oscillations in fundamentally strong midcaps.
Capitalize on price swings while limiting exposure to prolonged downturns.
d) Options Strategies
Use call options to leverage returns with limited capital in highly promising midcap stocks.
Protective puts can hedge against unexpected downtrends.
7. Case Studies of Midcap Multi-Baggers
Several midcap companies in India and globally have delivered exceptional returns:
Bajaj Finance (India) – Evolved from midcap to large-cap, delivering 10x+ returns over a decade.
Page Industries (India) – Niche player in textiles, achieved multi-bagger status due to consistent growth.
Eicher Motors (India) – Benefited from strong product positioning and market share gains.
Case studies highlight the importance of timely investment, research, and patience in reaping multi-bagger benefits.
8. Tips for Retail Traders
Diversify: Avoid putting all capital into one midcap stock.
Focus on Fundamentals: Short-term volatility may be high, but strong fundamentals increase multi-bagger chances.
Monitor Trends: Follow market news, sector growth, and macroeconomic indicators.
Patience is Key: Multi-bagger moves often take 3–7 years to materialize.
Avoid Herd Mentality: Don’t chase stocks just because they are trending; focus on research-based picks.
Conclusion
Midcap multi-baggers represent a unique opportunity for traders and investors willing to balance risk and reward. These stocks lie at the intersection of growth, innovation, and market inefficiencies. While identifying them requires a combination of fundamental research, technical analysis, and macroeconomic awareness, the potential rewards can be extraordinary. By understanding the drivers, risks, and strategies involved, traders can position themselves to benefit from the transformational wealth creation that midcap multi-baggers offer.
The world of midcap trading is not for the faint-hearted, but for disciplined investors with a growth mindset, it can be the playground of extraordinary returns.
Advanced Option Strategies1. Understanding Advanced Option Strategies
Advanced option strategies involve combining multiple option positions in ways that optimize outcomes for specific market scenarios. Unlike straightforward buying or selling of single options, these strategies use combinations of calls, puts, or both, sometimes with different strike prices and expiration dates, to achieve nuanced profit/loss structures.
Traders use these strategies for several reasons:
Hedging: Protect existing portfolios against adverse price movements.
Speculation: Take calculated bets on the direction, volatility, or timing of price movements.
Income Generation: Earn premiums through selling options while controlling risk.
Volatility Trading: Profit from changes in implied volatility rather than price direction alone.
To successfully implement advanced option strategies, traders must have a deep understanding of option Greeks (Delta, Gamma, Theta, Vega, and Rho), as these metrics determine how option prices react to market movements.
2. Popular Advanced Option Strategies
2.1 Spreads
Spreads involve buying and selling options of the same type (calls or puts) on the same underlying asset but with different strike prices or expiration dates. Spreads can be broadly categorized into vertical spreads, horizontal spreads, and diagonal spreads.
2.1.1 Vertical Spreads
Vertical spreads involve buying and selling options with the same expiration date but different strike prices. They can be bullish or bearish.
Bull Call Spread: Buy a call at a lower strike and sell a call at a higher strike. This strategy limits both profit and loss and is profitable if the stock price rises moderately.
Bear Put Spread: Buy a put at a higher strike and sell a put at a lower strike. Profitable if the underlying declines moderately.
Example: A stock trading at $100:
Buy 1 call at $100 strike for $5
Sell 1 call at $110 strike for $2
Net cost: $3, Maximum gain: $7, Maximum loss: $3
2.1.2 Horizontal (Time) Spreads
Also called calendar spreads, horizontal spreads involve options with the same strike price but different expiration dates.
Long Calendar Spread: Buy a long-dated option and sell a short-dated option at the same strike. This strategy profits from low volatility and time decay.
2.1.3 Diagonal Spreads
A combination of vertical and horizontal spreads, diagonal spreads involve options with different strikes and expiration dates. These allow traders to take advantage of both time decay and directional moves.
2.2 Straddles and Strangles
These strategies are designed to profit from volatility, regardless of price direction.
2.2.1 Straddle
A straddle involves buying a call and a put at the same strike price and expiration date. Traders use straddles when they expect significant price movement but are unsure of the direction.
Pros: Unlimited profit potential if the underlying makes a large move.
Cons: High cost due to purchasing two options, risk of losing premium if the price remains stable.
2.2.2 Strangle
A strangle is similar to a straddle but uses out-of-the-money options. This makes it cheaper but requires a bigger price movement to be profitable.
Example: Stock at $100:
Buy 1 OTM call at $105
Buy 1 OTM put at $95
Outcome: Profitable if the stock moves significantly beyond $105 or below $95.
2.3 Butterfly Spreads
Butterfly spreads are limited-risk, limited-reward strategies that involve three strike prices. The most common is the call butterfly spread:
Buy 1 call at lower strike
Sell 2 calls at middle strike
Buy 1 call at higher strike
This strategy profits if the underlying price remains near the middle strike at expiration. Variants include put butterflies and iron butterflies.
Iron Butterfly: Combines a call and put spread, offering a strategy that benefits from low volatility with defined risk and reward.
2.4 Condors
Condor strategies, like butterflies, involve four strikes and aim to profit from a narrow price range.
Iron Condor: Sell an OTM put and OTM call, and buy further OTM put and call to limit risk.
Pros: Generates income in low volatility markets.
Cons: Limited profit, requires precise range predictions.
2.5 Ratio Spreads
Ratio spreads involve buying and selling options in unequal quantities. For instance, a trader might buy 1 call and sell 2 calls at a higher strike.
Pros: Can generate credit upfront, benefit from moderate moves.
Cons: Unlimited risk if the underlying moves sharply beyond the sold options.
2.6 Backspreads
Backspreads are the opposite of ratio spreads: they involve selling fewer options and buying more further out-of-the-money options. Traders use them when expecting large moves in the underlying asset.
Example: Sell 1 ATM call, buy 2 OTM calls.
Outcome: Profitable if the stock surges, limited risk if the stock drops slightly.
2.7 Synthetic Positions
Synthetic strategies replicate the payoff of holding the underlying asset using options:
Synthetic Long Stock: Buy a call and sell a put at the same strike and expiration.
Synthetic Short Stock: Sell a call and buy a put.
These strategies allow traders to gain exposure to price movements without actually holding the underlying stock.
2.8 Box Spread
A box spread is a combination of a bull call spread and a bear put spread, effectively creating a riskless arbitrage if executed correctly.
Profit/Loss: The spread’s value converges to the difference between strikes at expiration, usually used by professional traders for interest rate arbitrage.
3. Practical Considerations
Advanced option strategies require careful planning and risk management. Key considerations include:
Volatility: High implied volatility increases option premiums, affecting the profitability of debit vs. credit strategies.
Time Decay (Theta): Strategies like calendar spreads benefit from time decay, while long options lose value as expiration approaches.
Liquidity: Illiquid options can have wide bid-ask spreads, increasing execution costs.
Greeks Management: Understanding Delta, Gamma, Vega, and Theta is critical for predicting how positions respond to market changes.
Margin Requirements: Complex strategies, especially those with naked positions, may require significant margin.
4. Risk Management
Even advanced strategies carry risks. Techniques to manage risk include:
Diversification: Avoid putting all capital into a single underlying or strategy.
Stop-Loss Orders: Predefined exit points can prevent large losses.
Position Sizing: Limit exposure per trade to a fraction of the total portfolio.
Adjustments: Rolling or converting positions can mitigate adverse movements.
5. Advantages of Advanced Option Strategies
Flexibility: Traders can structure strategies for bullish, bearish, or neutral market conditions.
Defined Risk: Many strategies offer limited-risk exposure compared to outright positions in the underlying asset.
Profit from Volatility: Traders can earn profits even in sideways markets.
Portfolio Hedging: Protects against large moves without selling assets.
6. Challenges and Limitations
Complexity: Understanding multiple legs, Greeks, and expiration cycles can be challenging.
Execution Costs: Commissions and slippage can reduce profits.
Market Timing: Many strategies require precise timing and predictions.
Psychological Pressure: Multi-leg trades can be stressful and require constant monitoring.
7. Conclusion
Advanced option strategies offer traders sophisticated tools to manage risk, speculate on price movements, and generate income. From spreads and straddles to butterflies and synthetic positions, each strategy has unique characteristics suited for different market conditions. Success in these strategies requires a thorough understanding of option pricing, Greeks, volatility, and risk management techniques. While the rewards can be substantial, the complexity and risks demand disciplined execution, continual learning, and practice.
For traders willing to invest the time in mastering these strategies, options provide a versatile framework to navigate today’s dynamic markets and optimize portfolio performance.
CHF/JPY Builds Momentum for Next Wave HigherThe CHF/JPY 1-hour chart shows a completed wave (1) near the 191.17 level, confirming a strong bullish impulse after a previous decline. The pair is now entering a wave (2) corrective phase, which is likely to retrace toward the 188.7–189.0 support zone before resuming the next upward move. This pullback appears to be a healthy correction within the broader uptrend. Once the correction is complete, wave (3) is expected to begin, targeting levels above 193.0 . The overall market structure remains bullish, suggesting that any short-term dips could offer potential buying opportunities for traders waiting for the next impulsive rally
Stay tuned
@Money_Dictators
Thank you.

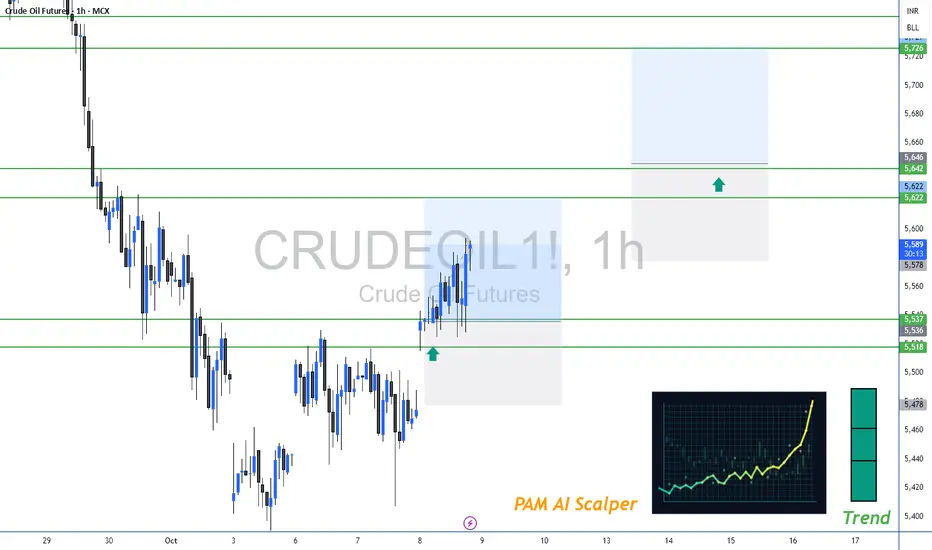
Crude Oil Levels For October 2025Important support and Resistance Levels For Crude Oil.
When Market touches the level, the price action plays important roles.
For More Learning Reach out to us.
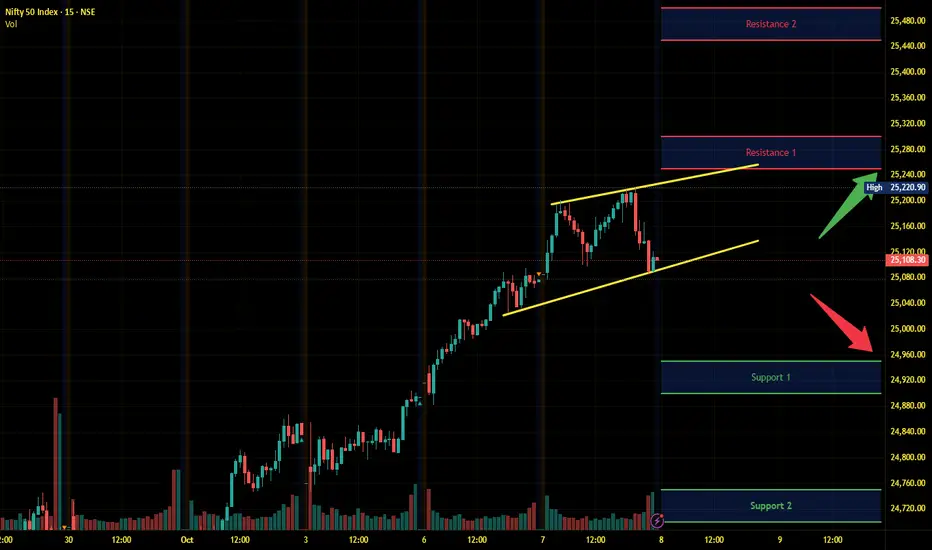
Nifty Intraday Analysis for 08th October 2025NSE:NIFTY
Index has resistance near 25250 – 25300 range and if index crosses and sustains above this level then may reach near 25450 – 25500 range.
Nifty has immediate support near 24950 – 24900 range and if this support is broken then index may tank near 24750 – 24700 range.
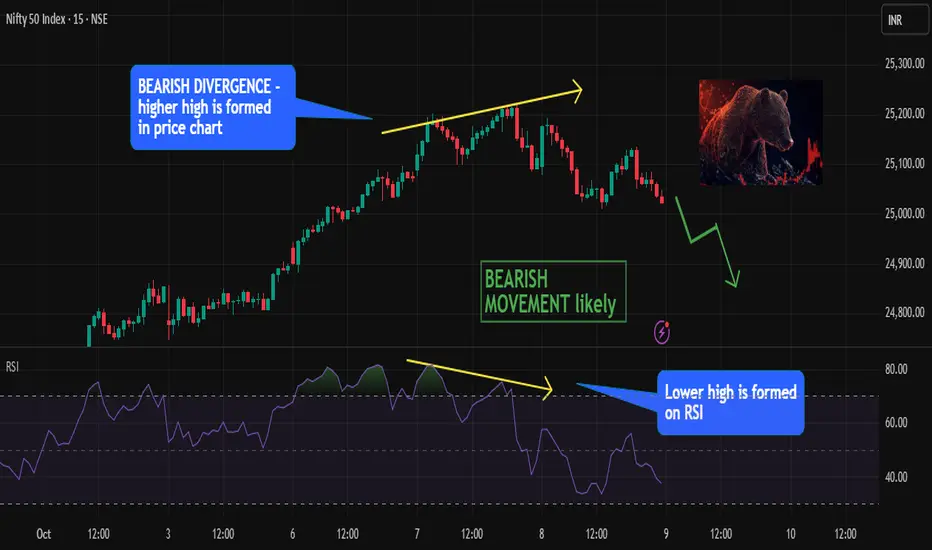
Nifty Showing Bearish Divergence — Potential Reversal Ahead!Nifty 50 (INDEX:NIFTY) is flashing a bearish divergence signal on the daily chart — a classic early warning of potential trend exhaustion.
📉 What’s Happening:
Price has made a higher high , reflecting continued bullish momentum on the surface.
However, the RSI (Relative Strength Index) has formed a lower high , showing weakening internal strength and momentum loss.
This bearish divergence between price and RSI often precedes a short-term reversal or correction phase .
🧩 Interpretation:
This setup suggests that even though price continues climbing, buying momentum is fading . Bulls may be losing strength, and bears could soon take control — especially if price fails to sustain above key resistance zones or shows a bearish confirmation candle in the coming sessions.
🎯 Target: 24,800
⛔ Stop Loss: 25,220
Choose Mutual Funds Smartly1. Understanding Mutual Funds
Before choosing mutual funds, it’s important to understand what they are.
Definition: A mutual fund is a pooled investment vehicle where money from multiple investors is collected and invested in a diversified portfolio of stocks, bonds, or other securities by professional fund managers.
Types of Mutual Funds:
Equity Funds: Invest primarily in stocks; higher risk, higher potential returns.
Debt Funds: Invest in bonds, government securities, and fixed-income instruments; lower risk, moderate returns.
Hybrid Funds: Mix of equity and debt; balance of risk and return.
Sectoral/Thematic Funds: Focus on specific sectors (like technology, pharma) or themes (like ESG investing).
Index Funds & ETFs: Track market indices; passive management; low expense ratio.
Key takeaway: Understanding the type of fund helps align investments with your financial goals and risk tolerance.
2. Define Your Investment Goals
Choosing mutual funds smartly begins with clarity about your financial objectives.
Short-term Goals (0–3 years): Emergency fund, vacation, buying a car. Focus on low-risk funds like debt or liquid funds.
Medium-term Goals (3–7 years): House down payment, higher education. Consider hybrid or balanced funds.
Long-term Goals (7+ years): Retirement, wealth creation. Equity funds or index funds are suitable for long-term growth.
Tip: Always match the fund’s investment horizon with your financial goal horizon.
3. Assess Your Risk Appetite
Risk tolerance is crucial for fund selection.
High-risk appetite: Can tolerate volatility for higher returns → Equity or sectoral funds.
Moderate-risk appetite: Comfortable with some fluctuations → Balanced or hybrid funds.
Low-risk appetite: Prefer stable returns → Debt funds or government securities.
Important: Assess your risk not just financially but emotionally. Some investors panic during market dips.
4. Analyze Fund Performance
Past performance is not a guarantee, but it indicates the fund manager’s skill.
Look for consistency: Check returns over 1, 3, 5, and 10 years.
Compare with benchmarks: A good equity fund should outperform its benchmark index.
Evaluate risk-adjusted returns: Use metrics like Sharpe Ratio or Standard Deviation.
Example: A fund that gives 12% annual return with moderate volatility is preferable to a 15% return fund with extreme fluctuations.
5. Evaluate the Fund Manager
A skilled fund manager can make a huge difference in returns.
Experience matters: Check the manager’s track record over different market cycles.
Fund house reputation: Trust established fund houses with strong research capabilities.
Fund manager tenure: Frequent changes may indicate instability.
Pro tip: A strong fund manager is particularly important in actively managed equity and sectoral funds.
6. Expense Ratio and Fees
Costs directly reduce your returns.
Expense Ratio: Annual fee charged by the fund for managing your money. Lower is better.
Exit Load: Fee for selling before a certain period. Avoid high exit loads if you plan to stay flexible.
Tip: Compare expense ratios across similar funds. Even a 1% difference compounds over long-term investments.
7. Tax Implications
Mutual fund investments are subject to taxes. Understanding them helps in smart planning.
Equity Funds:
Short-term capital gains (STCG) – 15% if held ≤1 year
Long-term capital gains (LTCG) – 10% on gains above ₹1 lakh if held >1 year
Debt Funds:
STCG – Taxed as per income slab if held ≤3 years
LTCG – 20% with indexation if held >3 years
ELSS Funds:
Equity-linked savings scheme; 3-year lock-in; tax-saving benefit under Section 80C
Smart strategy: Use tax-efficient funds to reduce liabilities and increase net returns.
8. Diversification and Portfolio Strategy
Diversification reduces risk without sacrificing returns.
Across Asset Classes: Mix equity, debt, and hybrid funds.
Within Equity: Invest in large-cap, mid-cap, and small-cap funds.
Geographic Diversification: Some funds invest globally, reducing dependence on a single economy.
Example: A portfolio with 50% large-cap equity, 20% mid/small-cap, 20% debt, and 10% international equity balances growth and stability.
9. Check the Fund’s Investment Style
Understanding the fund’s style helps anticipate performance in different markets.
Equity Funds: Growth vs. Value, Large-cap vs. Mid-cap vs. Small-cap
Debt Funds: Duration strategy – short-term, medium-term, or long-term
Hybrid Funds: Equity-Debt ratio and rebalancing frequency
Pro tip: Align the style with market conditions and your risk tolerance.
10. Review Fund Ratings and Research Reports
Independent fund ratings provide a quick insight into quality.
Agencies: CRISIL, Morningstar, Value Research
Ratings reflect: Past performance, volatility, fund manager expertise, and consistency
Use as a guide: Not a sole decision factor
11. Monitor and Rebalance Regularly
Investing smartly doesn’t end at selection.
Track Performance: Review quarterly or semi-annually
Rebalance Portfolio: Adjust allocation as goals, risk tolerance, or market conditions change
Avoid Emotional Decisions: Don’t panic during market downturns; focus on long-term goals
12. SIPs vs. Lump Sum Investment
Systematic Investment Plans (SIPs) are generally safer for new investors.
SIP: Regular, smaller investments; reduces impact of market volatility via rupee-cost averaging
Lump Sum: One-time investment; better if markets are undervalued or for experienced investors
Smart choice: For beginners or long-term wealth creation, SIPs in equity or hybrid funds are ideal.
13. Beware of Marketing Hype
Avoid choosing funds based on:
Short-term performance or “hot” recommendations
Celebrity endorsements or ads
Peer pressure
Smart investors: Focus on fundamentals, not hype.
14. Tools to Aid Smart Selection
Several online platforms can help in research:
Morningstar, Value Research, Moneycontrol: Fund performance, ratings, comparison
Robo-advisors: Personalized fund recommendations based on risk profile and goals
Mutual fund apps: For SIPs, monitoring, and portfolio tracking
15. Case Study: Smart vs. Hasty Choice
Investor A: Chose fund based on last year’s 40% return. Fund dropped 25% next year → panic sold → loss realized.
Investor B: Analyzed 5-year performance, fund manager experience, risk-adjusted returns → consistent 12–15% returns → held long-term → wealth accumulation.
Lesson: Smart selection focuses on consistency, not short-term gains.
16. Final Checklist Before Investing
Define your goal and time horizon
Assess risk tolerance
Understand fund type and strategy
Analyze past performance and fund manager
Compare expense ratios and fees
Evaluate tax implications
Ensure diversification
Start with SIP or lump sum wisely
Monitor periodically and rebalance
Conclusion
Choosing mutual funds smartly is less about luck and more about informed decision-making. By understanding your goals, assessing risk, analyzing funds carefully, and maintaining discipline, investors can achieve consistent returns and long-term wealth creation. Smart investors don’t chase hype—they focus on research, planning, and patience. Mutual funds, when selected and managed intelligently, are a powerful tool for financial freedom.
Mastering Trade with Volume: The Hidden Key to Market Precision1. Understanding Volume in Trading
Volume refers to the total number of units traded for a particular asset within a given time period. It is commonly displayed as a histogram at the bottom of price charts. Volume tells traders how strong a price move is, and can provide insights into market psychology:
High volume often confirms trends or signals the climax of a move.
Low volume indicates weak conviction or a potential pause in the market.
Volume spikes can mark key turning points or breakout areas.
Volume is a measure of liquidity. Highly liquid markets with large volume enable smoother trading, while thin volume markets may show exaggerated price swings.
2. Why Volume Matters in Trading
Volume analysis is not just about counting trades—it’s about interpreting market intent. Here’s why it matters:
Confirming Trends: A rising price with increasing volume validates the uptrend. Conversely, a rising price on declining volume suggests weakening momentum.
Identifying Reversals: Sudden volume spikes during downtrends or uptrends often precede reversals.
Breakouts and Fakeouts: Breakouts from key support or resistance levels are more reliable when confirmed by volume.
Market Sentiment: Volume reveals the psychology of participants—buyers and sellers—showing whether a trend is driven by genuine interest or speculation.
3. Key Volume-Based Trading Tools
Several technical tools leverage volume to improve trading accuracy:
Volume Bars: The simplest tool, showing traded quantity per time period.
Volume Moving Average (VMA): Helps identify unusual volume relative to average.
On-Balance Volume (OBV): Cumulative measure of volume flow to detect buying/selling pressure.
Volume Price Trend (VPT): Combines price and volume to measure the strength of moves.
Volume Profile: Displays volume distribution across price levels to identify key zones of support/resistance.
Each of these tools offers traders a unique perspective on market dynamics and provides high-probability trade setups.
4. Volume and Market Structure
To trade effectively with volume, it’s critical to combine it with market structure analysis:
Support and Resistance: High volume near support/resistance confirms strong buying or selling interest.
Breakouts: Breakouts accompanied by volume spikes indicate genuine moves, while low-volume breakouts are likely false.
Trend Continuation: In an uptrend, higher volume on rallies and lower volume on pullbacks suggests a healthy trend.
Trend Exhaustion: When volume decreases at the end of a trend, it signals potential reversal or consolidation.
By aligning volume with price action and market structure, traders can filter noise and focus on high-confidence trades.
5. Volume Trading Strategies
Volume trading is highly adaptable across time frames, from intraday to long-term investing. Here are some proven strategies:
a) Volume Breakout Strategy
Identify key support or resistance levels.
Enter trades when price breaks out with above-average volume.
Use volume spikes to confirm the legitimacy of breakouts.
b) Volume Reversal Strategy
Look for extreme volume spikes after prolonged trends.
Price action with unusual volume may indicate trend exhaustion.
Combine with candlestick patterns or indicators for confirmation.
c) Volume Divergence Strategy
Compare volume trends with price trends.
If price rises but volume falls, it suggests weakening buying pressure.
Similarly, falling prices with declining volume may indicate sellers are losing control.
d) Volume-Weighted Average Price (VWAP) Strategy
VWAP shows average price based on volume and is widely used by institutional traders.
Traders can align entry and exit points with VWAP levels for better trade execution.
6. Psychological Insights from Volume
Volume analysis provides insights into market psychology:
Fear and Greed: Sudden surges in volume often reflect panic selling or aggressive buying.
Institutional Activity: Large volume spikes may indicate accumulation or distribution by institutional players.
Herd Behavior: Retail traders often follow price blindly, but volume analysis reveals true market participation.
Understanding these psychological cues helps traders anticipate future price action rather than reacting to it.
7. Combining Volume with Other Indicators
Volume works best in combination with other technical tools:
With Moving Averages: Confirms trend strength.
With RSI/Stochastic: Volume validates overbought/oversold conditions.
With Price Patterns: Breakouts, triangles, and flags are more reliable with volume confirmation.
With Market Depth: Combines volume data with order book analysis for precision.
8. Common Mistakes in Volume Trading
Even experienced traders make errors:
Ignoring Relative Volume: Not all volume is meaningful; compare with average levels.
Overtrading on Volume Spikes: Volume spikes without context can lead to false signals.
Neglecting Trend Context: Volume must be analyzed within the current market structure.
Misreading Low-Liquidity Markets: Thinly traded instruments may produce misleading volume patterns.
Avoiding these mistakes ensures that volume becomes a powerful ally, not a misleading signal.
9. Practical Examples
Breakout Example: A stock breaks resistance at ₹150 with 3x average volume. Traders who wait for volume confirmation are more likely to profit.
Reversal Example: A prolonged downtrend shows a sudden surge in buying volume at ₹100. This often signals the bottoming phase.
Divergence Example: Nifty rises to new highs, but OBV falls. This warns of a weakening rally, prompting traders to tighten stops or take profits.
10. Conclusion
Volume is often called the “lifeblood of trading” for a reason. It tells the story behind the price, revealing the strength, conviction, and psychology of market participants. Traders who master volume analysis gain a critical edge—identifying high-probability trades, confirming trends, and spotting reversals early. By combining volume with price action, market structure, and other technical indicators, traders can transform their approach from guesswork to precision trading.
Ultimately, volume is not just a number—it is the pulse of the market, and learning to read it effectively is one of the most powerful skills a trader can acquire.
Intraday Trading vs Swing TradingIntroduction
Brief overview of trading in financial markets.
Importance of choosing the right trading style for profitability and risk management.
Statement of purpose: Compare intraday trading and swing trading across multiple dimensions such as time horizon, risk, capital requirements, strategy, and psychology.
1. Understanding Intraday Trading
1.1 Definition
Buying and selling financial instruments within the same trading day.
Positions are squared off before the market closes.
1.2 Characteristics
Short-term focus (minutes to hours).
High trade frequency.
Requires constant market monitoring.
1.3 Tools & Techniques
Technical indicators: RSI, MACD, moving averages, Bollinger Bands.
Chart patterns: Flags, triangles, head & shoulders.
Level 2 data, real-time market depth.
1.4 Advantages
Potential for high profits in a single day.
No overnight risk exposure.
Quick capital turnover.
1.5 Disadvantages
High stress due to rapid decision-making.
Significant brokerage and transaction costs.
Requires advanced knowledge and quick reflexes.
2. Understanding Swing Trading
2.1 Definition
Holding positions for several days to weeks to capture medium-term price movements.
2.2 Characteristics
Medium-term focus.
Fewer trades but larger profit potential per trade.
Less time-intensive compared to intraday trading.
2.3 Tools & Techniques
Technical analysis: Trendlines, support/resistance, moving averages.
Fundamental analysis: Earnings reports, sector trends, macroeconomic indicators.
Swing patterns: Breakouts, pullbacks, reversals.
2.4 Advantages
Less stressful than intraday trading.
More time to analyze and make informed decisions.
Lower transaction costs due to fewer trades.
2.5 Disadvantages
Exposure to overnight and weekend risks.
Capital is tied up longer.
Requires patience and disciplined risk management.
3. Time Horizon and Trading Frequency
Intraday: Trades last minutes to hours; multiple trades daily.
Swing: Trades last days to weeks; limited trades but larger exposure.
Impact on lifestyle: Intraday requires active screen time; swing allows more flexibility.
4. Capital Requirements
Intraday: Leverage is often used; margin requirements are smaller but risk is higher.
Swing: Requires more capital per trade due to longer holding periods and lower leverage.
Risk of capital erosion: Intraday mistakes can wipe out a day’s gains; swing mistakes can impact several days of profit potential.
5. Risk and Reward Dynamics
Intraday: High volatility can yield high rewards but also steep losses.
Swing: Moderate volatility, potential for larger cumulative gains, but exposure to overnight gaps.
Risk management strategies: Stop-loss orders, position sizing, diversification.
6. Trading Psychology
Intraday:
Requires quick decision-making and mental resilience.
Emotional discipline is crucial; fear and greed can destroy profits quickly.
Swing:
Patience is essential to ride trends.
Ability to handle temporary drawdowns without panic-selling.
7. Strategy and Analysis
Intraday Trading Strategies:
Scalping: Quick small gains.
Momentum trading: Riding strong price trends within the day.
Swing Trading Strategies:
Trend-following: Entering trades along prevailing trends.
Reversal trading: Buying dips and selling rallies.
Technical vs fundamental analysis balance: Swing trading often incorporates both; intraday is heavily technical.
8. Costs and Tax Implications
Intraday:
Higher brokerage and STT due to frequent trades.
Short-term gains taxed differently depending on jurisdiction.
Swing:
Lower trading costs.
Gains may qualify for medium/long-term capital gains benefits.
9. Suitability for Different Traders
Intraday: Best for active, risk-tolerant, experienced traders with fast decision-making skills.
Swing: Suitable for part-time traders, working professionals, and those seeking less stressful trading.
10. Technology and Tools
Intraday: Real-time charts, high-speed internet, advanced trading platforms.
Swing: Standard charting tools, technical analysis software, news alerts.
Algorithmic trading: Both can benefit but intraday relies more heavily on automated systems.
11. Performance Metrics
Intraday:
Profit per trade is smaller but cumulative daily gains can be significant.
Key metrics: Win rate, risk-reward ratio, drawdown percentage.
Swing:
Profit per trade larger due to capturing trends.
Key metrics: Holding period returns, average gain/loss, volatility capture.
12. Case Studies
Example of successful intraday trades: High-volume stocks, news-based spikes.
Example of successful swing trades: Trend-following in indices or sectoral stocks.
Comparison of returns, drawdowns, and effort required.
13. Hybrid Approaches
Combining intraday scalping with swing trading to diversify income streams.
Portfolio allocation between short-term and medium-term trades.
Pros and cons of hybrid trading.
14. Choosing Your Style
Assess your risk tolerance, time availability, capital, and psychological comfort.
Test both styles using paper trading before committing real capital.
Flexibility and adaptation to changing market conditions.
15. Conclusion
Recap of key differences: time horizon, risk, rewards, strategies, tools.
Emphasis on personal suitability over “best style.”
Encouragement to practice disciplined trading, regardless of style.

Consumption Trends in the Indian Trading Market1. Introduction
Consumption trends refer to the patterns and behaviors exhibited by consumers in terms of purchasing goods and services over time. In India, with a population exceeding 1.4 billion, consumption plays a pivotal role in driving economic growth. Retail, e-commerce, FMCG (Fast-Moving Consumer Goods), luxury goods, and digital services are some of the major sectors influenced by consumer spending patterns.
In recent years, consumption trends in India have shifted due to urbanization, rising disposable incomes, digital penetration, and changing lifestyles. Analyzing these trends provides valuable insights for traders and businesses to align their strategies with market demands.
2. Factors Driving Consumption Trends
Several macro and microeconomic factors influence consumption in India:
2.1 Rising Disposable Income
India’s growing middle class has more disposable income than ever before. With steady economic growth and higher employment rates, consumers are spending more on discretionary items like electronics, fashion, entertainment, and travel.
2.2 Urbanization
Rapid urbanization has created a surge in modern retail consumption. Tier-1 and Tier-2 cities have witnessed increased demand for branded products, premium services, and online retail platforms.
2.3 Digital Transformation
Digital technology has reshaped consumer behavior in India. E-commerce platforms such as Amazon, Flipkart, and Myntra have transformed the way people shop. Digital payments, mobile apps, and online promotions have contributed to convenience and impulse buying.
2.4 Lifestyle Changes
The younger generation, especially millennials and Gen Z, prioritize experiences over material goods. Their consumption patterns lean towards travel, wellness, fitness, and technology-driven products.
2.5 Government Policies
Government initiatives like Digital India, Make in India, and financial inclusion programs have increased accessibility to products and services across urban and rural regions, boosting overall consumption.
3. Consumption Patterns by Sector
3.1 FMCG (Fast-Moving Consumer Goods)
FMCG remains a cornerstone of Indian consumption. Staples like food, beverages, personal care products, and household goods dominate spending. Recent trends show a shift toward organic, health-oriented, and premium products.
Rising Health Awareness: Consumers prefer products with natural ingredients and low sugar/fat content.
E-commerce Impact: Online grocery shopping has surged, with platforms like BigBasket and Grofers leading the way.
3.2 E-commerce and Digital Consumption
E-commerce has revolutionized the Indian market, making products accessible beyond urban areas.
Growth of Mobile Commerce: Mobile apps drive more than 70% of e-commerce transactions.
Discount Culture: Festive sales and heavy discounts influence consumer behavior, leading to higher transaction volumes.
Niche Segments: Fashion, electronics, beauty products, and digital content subscriptions are seeing high online demand.
3.3 Luxury and Lifestyle Products
Luxury goods consumption has grown steadily among urban Indians, reflecting aspirations and status symbols.
Premium Brands: Demand for high-end automobiles, watches, and fashion brands is rising.
Experiential Consumption: People prefer experiences like fine dining, vacations, and wellness retreats over material possessions.
3.4 Technology and Electronics
Digital adoption drives significant consumption in electronics, including smartphones, laptops, and smart home devices.
Affordability: Competitive pricing of smartphones and appliances has widened consumer reach.
Integration with Lifestyle: Smart devices now complement entertainment, work, and fitness trends.
3.5 Rural Consumption
Rural India represents a massive consumption base, accounting for nearly half of total consumer spending.
Staple Goods: Food, FMCG, and agricultural products dominate.
Emerging Demand: Appliances, motorcycles, mobile phones, and digital services are becoming popular as connectivity improves.
4. Emerging Consumption Trends
4.1 Sustainability and Eco-consciousness
Consumers increasingly prefer sustainable and eco-friendly products. Brands focusing on packaging, renewable resources, and green initiatives gain trust.
4.2 Subscription-Based Models
Subscription services for streaming, meal kits, and curated products are gaining traction. Consumers appreciate convenience and customization.
4.3 Omni-channel Retail
Consumers expect a seamless experience across offline and online channels. Retailers offering click-and-collect, virtual try-ons, and personalized services are benefiting.
4.4 Experiential Spending
Experience-driven consumption, including travel, fitness, and leisure, is surpassing traditional material spending, especially among millennials.
4.5 Influence of Social Media
Social media platforms heavily influence purchasing decisions. Influencer marketing, short video apps, and online reviews have become key drivers of consumption.
5. Impact on Indian Trading Market
5.1 Growth of Retail and E-commerce
The retail sector is witnessing unprecedented growth due to changing consumption trends. Organized retail chains, supermarkets, and online platforms are expanding rapidly.
5.2 Increased Investor Interest
High consumption fuels business revenues, making sectors like FMCG, e-commerce, and technology attractive for investors. Stock performance of companies catering to changing consumer behavior is closely tied to these trends.
5.3 Supply Chain Evolution
Consumption trends are reshaping supply chain strategies. Efficient logistics, warehouse networks, and last-mile delivery are critical to meet demand.
5.4 Dynamic Pricing and Promotions
Companies adopt dynamic pricing and targeted promotions to influence buying patterns, particularly in e-commerce and FMCG sectors.
5.5 Product Innovation
Consumer expectations push companies to innovate continuously, focusing on personalization, convenience, and sustainability.
6. Challenges and Risks
Despite robust growth, consumption trends face challenges:
Economic Uncertainty: Inflation, interest rates, and global economic conditions can impact consumer spending.
Rural Penetration Barriers: Limited infrastructure and financial literacy may restrict rural consumption growth.
Regulatory Hurdles: Taxation and compliance requirements can affect pricing and margins.
Changing Preferences: Rapid shifts in consumer preferences may lead to inventory and investment risks for businesses.
7. Future Outlook
India’s consumption trends indicate a promising future for traders, investors, and companies. Key predictions include:
Rising Digital Consumption: Continued growth in e-commerce and online services.
Premiumization: Increased demand for premium, lifestyle, and health-oriented products.
Rural Market Expansion: Improved infrastructure and digital access will unlock rural consumption potential.
Sustainable Consumption: Brands focusing on eco-friendly products will capture long-term consumer loyalty.
Technology Integration: AI-driven personalization, AR/VR retail experiences, and smart devices will reshape buying patterns.
Overall, India’s consumption-driven market will remain a critical engine of economic growth, innovation, and global trading opportunities. Businesses and investors who anticipate these trends and adapt accordingly are likely to gain a significant competitive advantage.
8. Conclusion
The Indian trading market is evolving rapidly, with consumption trends at its core. From urban tech-savvy buyers to rural emerging consumers, the diversity of preferences demands that traders and companies remain agile. Understanding these trends enables businesses to innovate, investors to strategize, and policymakers to facilitate sustainable growth.
India’s consumption story is one of opportunity, fueled by demographic advantage, technological adoption, and a culture of aspiration. The next decade promises to redefine how goods and services are traded, consumed, and valued across the subcontinent.

Supercycle 2025: Metals, Energy, and PricesIntroduction
The global commodities market is experiencing a significant transformation in 2025, characterized by a resurgence in metal and energy prices. This phenomenon, often referred to as a "commodity supercycle," is driven by a confluence of factors including the energy transition, geopolitical tensions, and structural supply constraints. Understanding the dynamics of this supercycle is crucial for investors, policymakers, and industry stakeholders.
1. Understanding the Commodity Supercycle
Definition and Historical Context
A commodity supercycle refers to an extended period during which commodity prices remain well above their long-term trend, typically lasting several years or even decades. Historically, such supercycles have been driven by factors like industrialization, technological advancements, and shifts in global demand.
Current Drivers
In 2025, the supercycle is primarily fueled by:
Energy Transition: The global shift towards renewable energy sources is increasing demand for metals like copper, lithium, and nickel.
Geopolitical Instability: Conflicts and trade tensions are disrupting supply chains, leading to price volatility.
Supply Constraints: Limited investments in mining and energy infrastructure over the past decade are leading to supply shortages.
2. Metals: The Backbone of the Supercycle
Copper
Copper is at the forefront of the current supercycle. Its demand is surging due to its essential role in electric vehicles (EVs), renewable energy systems, and grid infrastructure. In 2025, copper prices have climbed to near-record levels, driven by a complex interplay of surging demand and significant supply disruptions. Analysts project a 30% increase in copper demand by 2040.
Lithium and Nickel
Lithium and nickel are critical for battery production. The rise of EVs and energy storage solutions is propelling their demand. However, supply is struggling to keep pace, leading to price increases.
Gold
Gold has emerged as a safe haven amid economic uncertainties. In October 2025, gold prices surpassed $4,000 per ounce for the first time, marking a 53% increase year-to-date. This rally is attributed to factors like anticipated interest rate cuts, a weak U.S. dollar, and geopolitical instability.
3. Energy: The Fuel of the Supercycle
Oil
The energy sector is witnessing a paradox. While global oil production is at record highs, oversupply concerns are leading to price declines. The U.S. Energy Information Administration (EIA) forecasts U.S. oil production to reach 13.53 million barrels per day in 2025, yet prices are expected to average $65 per barrel, down about 15% from the previous year.
Natural Gas
Natural gas prices are experiencing volatility due to fluctuating demand and supply disruptions. The transition to cleaner energy sources is also impacting its long-term outlook.
Renewable Energy
Investments in renewable energy infrastructure are driving demand for materials like steel, aluminum, and rare earth elements. The shift towards a materials-intensive energy system is reshaping global commodity markets.
4. Implications for Investors and Policymakers
Investment Opportunities
Metals and Mining Stocks: Companies like Tata Steel and Hindalco are benefiting from rising metal prices and increased demand.
Energy Infrastructure: Investments in renewable energy projects and related infrastructure are poised for growth.
Commodity ETFs: Funds like SPDR Gold Shares (GLD) and United States Oil Fund (USO) offer exposure to commodity markets.
Policy Considerations
Supply Chain Resilience: Policymakers must address vulnerabilities in commodity supply chains, especially concerning critical minerals.
Sustainable Mining Practices: Encouraging environmentally responsible mining can mitigate the ecological impact of increased extraction activities.
Energy Transition Strategies: Developing comprehensive plans for transitioning to renewable energy can ensure energy security and economic stability.
5. Conclusion
The commodity supercycle of 2025 presents both challenges and opportunities. While rising prices can benefit producers and investors, they also underscore the need for strategic planning and investment in sustainable practices. As the world continues its transition towards cleaner energy, the dynamics of commodity markets will play a pivotal role in shaping the global economic landscape.

Trends in the Equity Market1. Rise of Retail Participation
One of the most significant trends in recent years has been the surge of retail investors in the equity market. Traditionally dominated by institutional players, retail participation has grown due to:
Easy access through online trading platforms – Apps like Zerodha, Upstox, and Groww in India, and Robinhood in the US, have democratized investing.
Low brokerage fees and fractional investing – Small investors can now invest with minimal capital, diversifying their portfolios effectively.
Social media and community-driven investing – Platforms like Twitter, Reddit, and YouTube have fueled investment communities, leading to phenomena like meme stocks and coordinated retail rallies.
Impact: Retail participation increases market liquidity, adds volatility in certain stocks, and changes market sentiment faster than ever.
2. Technology-Driven Trading
Technological advancements have reshaped equity market operations, giving rise to new trading strategies:
Algorithmic trading: High-frequency trading (HFT) leverages algorithms to execute trades in milliseconds, impacting liquidity and price efficiency.
AI and machine learning: Predictive analytics and AI-driven stock recommendations help investors make data-backed decisions.
Blockchain and tokenized assets: Decentralized finance (DeFi) introduces tokenized stocks and fractional ownership, expanding access.
Impact: Technology accelerates decision-making, increases efficiency, and reduces human bias, but can also amplify sudden market moves during high volatility periods.
3. Sectoral Shifts and Investment Preferences
Equity markets evolve in response to macroeconomic cycles and technological innovation. Current sectoral trends include:
Technology and software: Cloud computing, AI, and fintech dominate investor attention.
Green energy and ESG: Renewable energy, electric vehicles, and ESG-compliant companies attract sustainable investment funds.
Consumer and healthcare: As disposable incomes rise and aging populations expand, consumer staples and healthcare continue to see robust growth.
Impact: Understanding sectoral shifts is crucial for portfolio diversification and identifying growth opportunities.
4. Global Influences on Domestic Markets
Equity markets no longer operate in isolation. Global factors significantly affect domestic equities:
Interest rate movements: Central bank policies in major economies influence capital flows and risk appetite.
Geopolitical developments: Conflicts, trade agreements, and sanctions can trigger sector-specific volatility.
Global economic cycles: Inflation, recessions, or commodity price swings can reshape equity valuations worldwide.
Impact: Investors must adopt a global perspective and hedge against systemic risks to protect portfolios.
5. Increased Focus on ESG Investing
Environmental, Social, and Governance (ESG) investing has moved from niche to mainstream:
Companies demonstrating strong ESG metrics often enjoy higher valuation premiums.
ESG-focused funds attract both retail and institutional money.
Regulatory frameworks in regions like Europe and India are increasingly mandating ESG disclosures.
Impact: ESG considerations now influence stock selection, corporate behavior, and long-term market trends.
6. Volatility and Market Sentiment
Equity markets are inherently volatile, but recent trends have amplified sentiment-driven fluctuations:
Behavioral finance influence: Fear, greed, and herd behavior can cause sudden price swings.
Events-driven volatility: Earnings surprises, policy changes, or economic shocks affect short-term trading patterns.
Use of derivatives: Options and futures increase market leverage, influencing volatility patterns.
Impact: Investors must combine technical analysis with market sentiment to navigate swings effectively.
7. Rise of Passive Investing and ETFs
Another major trend is the increasing dominance of passive investing:
Exchange-Traded Funds (ETFs) and index funds attract inflows due to low costs and broad market exposure.
Passive strategies reduce the influence of individual stock picking, shifting markets toward index-driven movements.
Institutional adoption of passive strategies has altered liquidity and valuation dynamics.
Impact: Passive investing has stabilized long-term returns but can lead to concentrated risk during market downturns.
8. Regulatory and Policy Trends
Government regulations play a critical role in shaping equity markets:
Capital market reforms: Simplified IPO processes, demat accounts, and trading technology have encouraged participation.
Tax incentives: Policies like long-term capital gains tax reforms influence investor behavior.
Global compliance: Regulations like MiFID II in Europe and SEBI guidelines in India ensure transparency and protect investors.
Impact: Regulatory trends influence market confidence, compliance costs, and investment strategies.
9. Market Integration and Cross-Border Investing
Investors increasingly diversify across geographies:
Mutual funds, global ETFs, and foreign portfolio investments enable exposure to international equities.
Correlation between global markets has increased; for instance, US Federal Reserve decisions affect Indian and Asian equities.
Currency fluctuations now directly impact returns for foreign investors.
Impact: Cross-border investing provides diversification but introduces currency and geopolitical risks.
10. Emerging Technologies and AI in Equity Analysis
The integration of AI and Big Data is transforming how equity markets operate:
Predictive analytics: Forecasting earnings, detecting anomalies, and assessing risk in real time.
Natural Language Processing (NLP): Analyzing news, earnings calls, and social media sentiment to predict market reactions.
Robo-advisors: Automated portfolio management using AI-driven insights.
Impact: AI reduces human error, enhances research efficiency, and allows more informed investment decisions.
11. Behavioral and Social Media Influences
Equity markets are increasingly influenced by social media trends:
Platforms like Reddit’s WallStreetBets can cause rapid price movements.
Viral investment stories often impact stocks without fundamental changes.
Public perception, amplified by social media, now drives trading behavior alongside traditional financial metrics.
Impact: Social-driven market movements highlight the importance of monitoring both fundamentals and sentiment indicators.
12. Future Outlook
The equity market continues to evolve:
Integration of technology and finance: AI, blockchain, and algorithmic trading will define market structure.
Sustainable investing: ESG and impact investing will guide corporate and investor decisions.
Global interconnectivity: Investors will increasingly need to monitor global macro trends, interest rates, and geopolitical developments.
Conclusion: Understanding trends in the equity market is crucial for successful investing. Retail participation, technological innovation, ESG focus, and global integration are reshaping how markets operate. Investors who adapt to these trends can position themselves for long-term growth while managing volatility and risk.

Algorithmic AI Trading SystemIntroduction
Algorithmic AI trading systems are transforming the financial markets by combining the power of algorithms, artificial intelligence (AI), and big data to make trading more efficient, precise, and profitable. Traditional trading relied heavily on human intuition and manual execution, which was slower and prone to errors. In contrast, AI-powered trading systems leverage complex mathematical models, machine learning, and real-time data analysis to execute trades automatically, often outperforming human traders in speed and accuracy.
The integration of AI in algorithmic trading has become crucial for institutions, hedge funds, and retail traders seeking competitive advantages in highly volatile and liquid markets.
1. Understanding Algorithmic Trading
Algorithmic trading, often called algo-trading, uses predefined rules and mathematical models to execute trades automatically. These rules are designed based on market data such as price, volume, and timing. The main features include:
Speed: Algorithms can execute orders in milliseconds, capitalizing on short-lived market opportunities.
Accuracy: Reduces human errors in execution, ensuring trades occur exactly as planned.
Cost Efficiency: Automation lowers operational costs and reduces slippage in high-frequency trades.
Types of Algorithmic Trading Strategies
Trend-Following Algorithms: Identify and follow market trends to generate profits.
Mean Reversion Algorithms: Trade based on the assumption that prices will return to their historical average.
Statistical Arbitrage: Exploit price inefficiencies between correlated assets.
High-Frequency Trading (HFT): Leverages milliseconds-level execution speed for arbitrage or market making.
While these strategies are effective, AI enhances them by incorporating machine learning and predictive analytics to adapt to changing market conditions.
2. Role of Artificial Intelligence in Trading
Artificial intelligence brings adaptability, predictive power, and self-learning capabilities to algorithmic trading. AI in trading generally involves:
Machine Learning (ML): Algorithms learn from historical and real-time data to predict future price movements.
Natural Language Processing (NLP): Analyzes news, earnings reports, and social media sentiment to inform trades.
Deep Learning: Identifies complex non-linear patterns in market data that traditional models might miss.
AI Applications in Trading
Predictive Analytics: AI models forecast asset price movements and volatility based on historical data.
Sentiment Analysis: NLP models assess market sentiment from financial news, tweets, or analyst reports.
Risk Management: AI continuously monitors market exposure, portfolio risks, and liquidity constraints.
Trade Execution Optimization: Machine learning adjusts order execution to minimize slippage and transaction costs.
By combining AI with algorithms, trading systems move from rule-based automation to adaptive intelligence, enabling smarter and faster decision-making.
3. Architecture of an AI Trading System
A robust AI trading system typically consists of four key components:
Data Acquisition Layer:
Gathers structured (price, volume) and unstructured data (news, social media).
Sources include market feeds, APIs, historical databases, and alternative datasets like satellite imagery or economic indicators.
Data Processing & Feature Engineering:
Cleans, normalizes, and transforms raw data into meaningful inputs for AI models.
Feature engineering is critical to highlight relevant signals for price prediction.
AI Modeling Layer:
Machine learning models such as Random Forests, Gradient Boosting, or LSTM neural networks predict price movements or detect anomalies.
Reinforcement learning can be used to optimize trading strategies over time based on rewards and penalties.
Execution & Monitoring Layer:
Converts AI-generated signals into actionable trades using low-latency order execution engines.
Continuously monitors market conditions, system performance, and risk exposures.
4. Benefits of Algorithmic AI Trading
Speed and Efficiency: AI systems process vast datasets and execute trades far faster than humans.
24/7 Market Monitoring: AI can continuously monitor multiple markets without fatigue.
Data-Driven Decisions: Eliminates emotional bias from trading, relying on objective, statistical analysis.
Adaptive Strategies: Machine learning allows strategies to evolve with changing market dynamics.
Risk Minimization: Predictive models and real-time monitoring help prevent major losses.
5. Challenges and Risks
Despite its advantages, algorithmic AI trading comes with risks:
Overfitting: AI models trained on historical data may fail in live market conditions.
Market Impact: High-frequency trades may inadvertently affect market prices.
Data Quality Issues: Inaccurate or incomplete data can lead to wrong trading decisions.
Cybersecurity Risks: AI systems are vulnerable to hacking or manipulation.
Regulatory Compliance: Algorithmic and AI-driven trades are under strict regulatory scrutiny in many markets.
Traders must balance innovation with caution, ensuring robust risk management and compliance protocols.
6. Popular AI Trading Strategies
Reinforcement Learning for Portfolio Optimization:
AI agents learn to maximize portfolio returns while minimizing risk using reward-based learning.
Sentiment-Based Trading:
NLP algorithms analyze news and social media sentiment to predict price trends.
Algorithmic Arbitrage:
AI identifies temporary price discrepancies across exchanges for profit.
Predictive Modeling for Volatility:
AI forecasts market volatility, enabling traders to hedge positions effectively.
Hybrid Models:
Combines technical indicators, fundamental data, and sentiment analysis for holistic decision-making.
7. Case Studies and Real-World Applications
Hedge Funds and Investment Banks:
Firms like Renaissance Technologies and Goldman Sachs use AI-driven strategies to outperform traditional market approaches.
Retail Trading Platforms:
AI-powered trading bots for retail investors provide automated signal generation and trade execution.
Cryptocurrency Markets:
AI systems exploit the high volatility of crypto markets to generate consistent returns.
Alternative Data Utilization:
AI can analyze satellite imagery, weather data, or shipping patterns to predict commodity prices or stock movements.
8. The Future of AI in Trading
The AI trading landscape is evolving rapidly:
Explainable AI: Traders demand transparency in AI-driven decisions to trust automated systems.
Cross-Asset Integration: AI systems will increasingly manage multi-asset portfolios, including stocks, crypto, and derivatives.
Quantum Computing: May accelerate AI algorithms, enabling near-instantaneous market analysis.
Regulatory Evolution: Regulators are developing frameworks to monitor and manage AI-driven trading risks.
The future points toward AI-driven systems that are smarter, faster, more adaptive, and capable of operating across global markets seamlessly.
Conclusion
Algorithmic AI trading systems represent a paradigm shift in financial markets. By combining computational speed, adaptive intelligence, and vast data processing capabilities, these systems are setting new benchmarks for efficiency, profitability, and risk management. While challenges like overfitting, cybersecurity risks, and regulatory hurdles exist, the potential benefits for investors and institutions are immense.
AI in trading is not just about automation; it is about building systems that think, learn, and adapt—ushering in a new era where data-driven intelligence shapes the future of finance.

NIFTY - CE or PEFollow the link for history/continuation
Recap:
💡 View shared on 6th Oct 2025:
📌 LTP: 25,077
🔻 R: 25,156 - 25,205
🔺 S: 25,052-24930
💡 View:
Because Nifty closed above our crucial roadblock 🚧 of 25,052, there is a strong chance of a Gap up opening & a high probability of Nifty moving towards the 25,200 mark.
Tomorrow being the 1st expiry of the month, let me share a few scenarios that can guide your trades:
1) Gap up opening & moving further north → Chance of Short Covering taking it higher.
2) Nifty approaching 25,200 → Possible Profit Booking.
3) Gap Down opening → It’d be buy on dips unless Nifty spot breaks & sustains below 24,980.
4) Range-bound session during the day with some +ve bias towards close.
📌 Now the big question: Will it be Profit Booking or Short Covering (or both)?
👉 Time will unfold this mystery.
Key Levels to Watch: 24,980 / 25,155 / 25,205 / 25,255
✅ Strength above 25256
❌ Weakness below 24,935
⚠️ Keep Churning as per Trend
Actual on 7th Oct 2025
We witnessed Nifty moving exactly in the same manner as per our shared view & detailed scenarios Point # 1 & 2
it went on to touch a high of 25203 & retraced till 25099 again moved till 25220 & finally closing @ 25,108
Overall, it matched all the Key levels shared yesterday
OHLC
25,085
25,220
25,076
25,108
08/10/2025 Nifty View
📌 LTP: 25,108
🔻 R: 25,156 - 25,205
🔺 S: 25,052-24930
💡 View:
As mentioned, we saw Profit booking exactly at our given level of 25,205 & 25,255.
I wish to draw your attention to a Technical aspect — a Gravestone Doji has been formed in Nifty on the Daily Time Frame, and that usually indicates a Trend Reversal.
Tomorrow, we might see a Gap down opening followed by an uptrend.
However, if Nifty Spot breaks & sustains below 24,980–24,930, then BEARS might take control.
Else, everything looks good.
Earlier Crucial Roadblock 🚧 of 25,052 Now consider it Crucial Support zone.
Key Levels to Watch: 24,980 / 25,155 / 25,205 / 25,255
✅ Strength above 25256
❌ Weakness below 24,935
⚠️ Keep Churning as per Trend
👉 Do you find these daily views useful and want to receive them regularly?
If yes, show 👍
Your support motivates us to share more
For more insights & trade ideas,
📲 Visit my profile and hit Follow
Warm regards,
Naresh G
SEBI Registered Research Analyst
💬 Comment below if you want me to analyse any stock for you 🔍

ETHUSD: Where Price Could Go?4h tf
ETHUSD has bounced back strongly from around $3,826 after completing an A-B-C wave pattern. Right now, the price is testing resistance near $4,756. It could drop a little to around $4,440 before moving higher again. If the uptrend continues, the next target levels are $4,955, $5,300, and $5,500.
Stay tuned!
Thank you,
@Money_Dictators

Nifty Intraday Analysis for 07th October 2025NSE:NIFTY
Index has resistance near 25200 – 25250 range and if index crosses and sustains above this level then may reach near 25350 – 25400 range.
Nifty has immediate support near 24950 – 24900 range and if this support is broken then index may tank near 24750 – 24700 range.
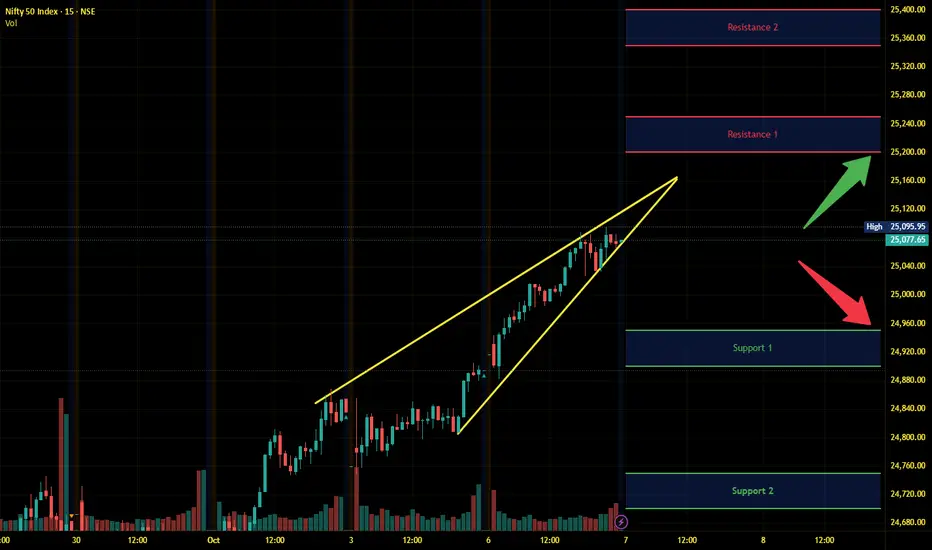
BNB 400% up from our Entry People laughed when I said CRYPTOCAP:BNB will hit $2000–$3000.
but people still doubt my $2000–$3000 targets? 🤔
From 1st Entry of this bull run: +400% ( TP1 ✅ )
From $500 re-entry: +120%
You can doubt targets, but not momentum.
Just don’t forget — book profits.
Because trading without a safe zone = casino mode.
Not Financial Advice

Market Swings, Inflation, and Interest Rates1. Market Swings: The Pulse of Financial Markets
Market swings, also known as market volatility, refer to the rapid and sometimes unpredictable fluctuations in asset prices. These swings can occur in stock markets, bond markets, commodities, or foreign exchange markets. They are driven by a combination of factors including economic data, geopolitical events, corporate earnings, investor sentiment, and macroeconomic policies.
Volatility is a natural part of financial markets. While minor fluctuations are expected, extreme swings often signal underlying instability or heightened uncertainty. For instance, a sudden drop in stock prices may be triggered by negative employment data, unexpected changes in central bank policies, or geopolitical tensions. Conversely, rapid upward swings can result from strong economic indicators, corporate profitability, or liquidity injections by central banks.
Understanding market swings requires recognizing that they are often a reflection of investor psychology as much as economic fundamentals. Fear and greed can amplify price movements, creating feedback loops that exacerbate market volatility.
2. Inflation: The Erosion of Purchasing Power
Inflation is the rate at which the general level of prices for goods and services rises, thereby eroding purchasing power. It is a critical macroeconomic variable because it directly impacts consumer behavior, corporate profitability, and investment decisions. Moderate inflation is considered healthy for the economy, as it encourages spending and investment. However, high inflation can destabilize markets, reduce real returns on investments, and create uncertainty about future economic conditions.
Inflation is measured using indices such as the Consumer Price Index (CPI) and the Producer Price Index (PPI). Persistent increases in these indices indicate that the cost of living is rising, which can lead to tighter monetary policy. For investors, rising inflation often leads to higher volatility in equities, bonds, and commodities. Certain sectors, like consumer staples and utilities, may perform relatively better during inflationary periods due to consistent demand, while growth-oriented sectors may suffer.
3. Interest Rates: The Cost of Money
Interest rates, determined primarily by central banks, represent the cost of borrowing money. They influence every aspect of the economy, from corporate investments to consumer spending. When central banks increase interest rates, borrowing becomes more expensive, which can slow economic activity. Conversely, lower interest rates encourage borrowing and investment but can also contribute to higher inflation.
Interest rates are closely tied to market swings and inflation. For example, when inflation rises unexpectedly, central banks may increase interest rates to cool down the economy. This can lead to sudden market adjustments, especially in interest-sensitive sectors such as real estate, banking, and technology. Conversely, during economic slowdowns, central banks often reduce interest rates to stimulate growth, which can drive equity markets higher.
4. The Interplay Between Market Swings, Inflation, and Interest Rates
The relationship between market swings, inflation, and interest rates is complex and cyclical. Inflation often drives central banks’ interest rate decisions, which in turn impact market volatility.
Inflation → Interest Rate Adjustment → Market Reaction: Rising inflation typically prompts central banks to increase interest rates to curb spending. This often results in market sell-offs, as higher rates increase borrowing costs for businesses and reduce consumer spending, impacting corporate profits.
Interest Rates → Market Liquidity → Market Swings: Lower interest rates generally increase liquidity in the market, encouraging investments in riskier assets like stocks and real estate. Conversely, higher interest rates can reduce liquidity, leading to increased volatility as investors reassess risk and reallocate assets.
Market Swings → Inflation Expectations → Policy Decisions: Significant market swings can influence inflation expectations. For instance, a sudden spike in commodity prices can heighten inflation fears, prompting central banks to intervene with policy adjustments.
5. Case Studies of Market Swings Influenced by Inflation and Interest Rates
The 1970s Stagflation: During the 1970s, the U.S. experienced high inflation combined with stagnant economic growth. Interest rates were raised to control inflation, leading to significant market volatility and prolonged economic uncertainty.
The 2008 Global Financial Crisis: Preceding the crisis, low-interest rates encouraged excessive borrowing and speculative investments. When the housing bubble burst, market swings were amplified, and inflationary pressures emerged briefly in certain sectors.
COVID-19 Pandemic Market Reactions: In 2020, global markets experienced extreme swings due to the pandemic. Central banks reduced interest rates to near-zero levels, injecting liquidity into markets. Inflation remained low initially but surged in 2021–2022, causing renewed volatility as central banks adjusted rates upward.
6. Sectoral Impact of Inflation and Interest Rate Changes
Different sectors respond uniquely to market swings driven by inflation and interest rates:
Technology and Growth Stocks: Highly sensitive to interest rate hikes because future earnings are discounted more heavily.
Consumer Staples and Utilities: Typically resilient during inflationary periods due to consistent demand.
Financials: Benefit from higher interest rates through improved net interest margins but may suffer if higher rates reduce loan demand.
Commodities: Often act as a hedge against inflation, but can experience volatility due to geopolitical risks and supply-demand imbalances.
7. Strategies for Investors Amid Market Swings
Investors can employ several strategies to navigate the intertwined effects of market swings, inflation, and interest rates:
Diversification: Spreading investments across sectors and asset classes reduces exposure to volatility.
Hedging: Using derivatives or inflation-protected securities to mitigate risks.
Monitoring Central Bank Signals: Paying close attention to monetary policy statements and inflation data to anticipate interest rate changes.
Value vs. Growth Balancing: Allocating between growth and value stocks based on interest rate and inflation trends.
Commodities and Real Assets: Incorporating gold, real estate, or commodities as a hedge against inflation.
8. Global Implications and Policy Considerations
The interplay of market swings, inflation, and interest rates is not confined to a single country. Global capital flows, trade dynamics, and foreign exchange markets amplify these effects across borders. For instance, interest rate hikes in the U.S. can lead to capital outflows from emerging markets, triggering currency depreciation and local market swings. Policymakers must balance inflation control with growth objectives, often navigating difficult trade-offs.
9. The Role of Technology and AI in Predicting Market Movements
Advances in technology, data analytics, and AI are helping investors and institutions better anticipate market swings. By analyzing inflation trends, interest rate projections, and historical market reactions, AI-driven models can provide probabilistic forecasts, aiding in more informed investment decisions. These tools, however, cannot eliminate risk entirely, especially during unprecedented shocks or black swan events.
10. Conclusion
Market swings, inflation, and interest rates are inseparable forces shaping the global financial landscape. Their interaction determines the rhythm of markets, influencing investment strategies, economic growth, and financial stability. For investors and policymakers, understanding these dynamics is crucial to navigating volatility and making strategic decisions. While the future is inherently uncertain, careful monitoring of inflationary trends, interest rate policies, and market signals can provide a roadmap for managing risk and capitalizing on opportunities in a complex economic environment.

AI Trading Profits: Unlocking the Future of Smart Market Gains1. Understanding AI Trading
AI trading refers to the use of machine learning, natural language processing, and advanced algorithms to make trading decisions. Unlike traditional trading, which relies on human intuition, AI trading analyzes massive datasets in real-time, identifies patterns, and executes trades with precision. AI systems are capable of learning from historical data, adapting to changing market conditions, and continuously improving their performance.
Key components include:
Data acquisition: Collecting historical and real-time financial data.
Pattern recognition: Using machine learning to identify profitable trends.
Execution algorithms: Automatically placing trades based on AI predictions.
Risk management: Monitoring positions and adjusting strategies dynamically.
2. Sources of AI Trading Profits
AI trading profits come from multiple sources, often simultaneously:
a. Arbitrage Opportunities
AI can identify price discrepancies across markets faster than humans. For example, slight differences in currency pairs or stock prices between exchanges can be exploited within milliseconds, yielding small but highly consistent profits.
b. Predictive Market Analysis
AI models can forecast price movements using historical data, news sentiment, macroeconomic indicators, and social media trends. By predicting short-term or long-term trends, traders can enter and exit positions at optimal moments.
c. High-Frequency Trading (HFT)
AI enables high-frequency trading, executing thousands of trades per second. This leverages micro-movements in asset prices to generate cumulative profits over time.
d. Sentiment Analysis
Modern AI models analyze news articles, social media, and financial reports to gauge market sentiment. Positive or negative sentiment can trigger AI-based trading strategies that anticipate market reactions.
3. AI Trading Strategies That Drive Profits
AI trading profits are heavily influenced by the strategies employed:
Trend-Following Algorithms: AI detects upward or downward price trends and automatically adjusts positions.
Mean Reversion Models: Identifying when an asset is overbought or oversold and betting on a return to the mean.
Reinforcement Learning Systems: AI learns optimal trading actions through trial-and-error simulations.
Neural Network Predictive Models: Deep learning models analyze complex data patterns to predict future price movements.
Portfolio Optimization Algorithms: AI balances risk and return by continuously reallocating assets across diverse instruments.
4. Advantages of AI in Trading Profits
Speed and Accuracy: AI can analyze vast data in milliseconds, far faster than human traders.
Emotionless Trading: AI removes emotional biases that often lead to trading mistakes.
24/7 Market Monitoring: AI can operate continuously in global markets.
Adaptive Learning: Machine learning models improve over time, refining strategies.
Scalability: AI can simultaneously trade multiple markets and instruments.
5. Challenges and Risks in AI Trading
While AI offers significant profit potential, risks remain:
Data Quality Issues: Poor or biased data can lead to incorrect predictions.
Overfitting: AI models may perform well in simulations but fail in live markets.
Market Volatility: Sudden market shocks can overwhelm AI systems.
Regulatory Constraints: Certain jurisdictions impose rules on automated trading.
Ethical Concerns: AI-driven market manipulation risks exist if not properly monitored.
6. Case Studies of AI Trading Profits
Hedge Funds: Quantitative hedge funds like Renaissance Technologies and Two Sigma generate billions annually using AI-driven strategies.
Retail Traders: Platforms using AI-assisted trading tools allow retail traders to capture profitable signals.
Cryptocurrency Markets: AI is used extensively in crypto trading to exploit high volatility and sentiment-driven price swings.
7. Future Outlook of AI Trading Profits
The future of AI trading promises even greater profitability as technology advances:
Integration of Alternative Data: Satellite imagery, social trends, and IoT data will refine AI predictions.
AI-Driven Risk Management: Advanced AI models will optimize risk-adjusted returns.
Global Market Connectivity: AI will seamlessly trade across borders, currencies, and asset classes.
Hybrid Human-AI Models: Traders will increasingly use AI as an assistant, combining human intuition with machine precision.
Conclusion
AI trading profits represent a paradigm shift in financial markets. By leveraging speed, accuracy, predictive capabilities, and advanced strategies, AI transforms how profits are generated. However, success depends on high-quality data, robust algorithms, and continuous monitoring. For traders, institutions, and investors, AI is no longer optional—it is the key to achieving consistent, scalable, and intelligent market gains.