Trading Breakouts and Fakeouts: An In-Depth Analysis1. Understanding Breakouts
A breakout occurs when the price of an asset moves beyond a defined support or resistance level with increased volume. These levels act as psychological barriers where buyers or sellers have historically exerted control. A breakout signals a potential new trend and can present a lucrative trading opportunity.
Support Level: A price level where buying interest is strong enough to prevent further decline.
Resistance Level: A price level where selling pressure exceeds buying interest, preventing further ascent.
Breakouts indicate that the equilibrium between supply and demand has shifted, creating a momentum-driven price movement. Traders look for these opportunities as the market often continues moving in the breakout direction, at least in the short term.
Types of Breakouts
Upside Breakout: Occurs when the price moves above a resistance level. Often seen as a bullish signal indicating further upward movement.
Downside Breakout: Happens when the price falls below a support level. This is a bearish signal suggesting continued downward pressure.
Volatility Breakout: Happens when price moves beyond a consolidation range, indicating increased volatility.
Pattern-Based Breakout: Triggered by the completion of chart patterns such as triangles, head-and-shoulders, flags, or rectangles.
2. Factors Driving Breakouts
Breakouts are not random; several market factors contribute to their formation:
Fundamental Drivers: News releases, earnings reports, economic data, geopolitical events, or monetary policy announcements can trigger a breakout.
Technical Triggers: Long-term resistance or support levels, trendlines, and chart patterns attract attention from technical traders, amplifying price movements.
Volume Confirmation: A genuine breakout is usually accompanied by a significant increase in trading volume, signaling strong market interest and conviction.
Market Sentiment: Collective trader psychology plays a role. Fear and greed can accelerate breakouts as traders rush to capitalize on perceived opportunities.
3. Breakout Trading Strategies
Effective breakout trading relies on proper timing, risk management, and confirmation. Below are widely used strategies:
A. Entry Techniques
Wait for Close Beyond Level: Traders often wait for the price to close beyond the support/resistance level rather than reacting to intraday spikes.
Volume Confirmation: Look for above-average trading volume to confirm the breakout's strength.
Breakout Pullback: Sometimes, prices retest the breakout level. Entering after a successful retest can reduce false signals.
B. Risk Management
Stop Loss Placement: Place stop-loss orders slightly below the breakout point for long positions and above for short positions.
Position Sizing: Limit exposure to reduce the impact of sudden reversals.
Target Projection: Measure the height of the previous consolidation range to project price targets post-breakout.
C. Timeframe Consideration
Breakout signals vary across timeframes. Higher timeframes (daily, weekly) tend to offer more reliable breakouts, whereas intraday breakouts (5-min, 15-min charts) are more prone to fakeouts.
4. Understanding Fakeouts
A fakeout is a false breakout where the price moves beyond a key level but quickly reverses direction. Fakeouts can trap traders who enter positions prematurely, leading to losses. Recognizing fakeouts is essential to avoid falling into “breakout traps.”
Why Fakeouts Happen
Liquidity Hunting: Large institutional players may push prices beyond levels temporarily to trigger stop-loss orders of retail traders, then reverse.
Market Manipulation: In illiquid markets, price can be deliberately pushed to create misleading breakouts.
Psychological Reactions: Traders’ overconfidence can lead to impulsive entries, resulting in fakeout scenarios.
Lack of Volume: Breakouts without sufficient volume often fail to sustain, reverting to previous levels.
Common Fakeout Patterns
False Break Above Resistance: Price breaches resistance, but selling pressure soon overwhelms buyers.
False Break Below Support: Price dips below support, only to rebound as buying interest returns.
Wicks or Shadows: Candlestick charts often show long upper or lower shadows indicating rejection at breakout levels.
5. Identifying Fakeouts vs Genuine Breakouts
Differentiating between fakeouts and genuine breakouts requires careful observation:
Volume Analysis: Genuine breakouts are typically supported by strong volume. Low volume breakouts are more likely fakeouts.
Price Action Confirmation: Wait for consecutive closes beyond the level to confirm strength.
Market Context: Analyze broader trends and sentiment. Breakouts in alignment with trends are more reliable.
Indicators: Technical indicators such as RSI, MACD, and Bollinger Bands can provide clues. Divergence or overbought/oversold conditions may hint at potential fakeouts.
Timeframe Cross-Check: Confirm breakouts across multiple timeframes to ensure authenticity.
6. Psychological Aspects of Breakouts and Fakeouts
Trader psychology plays a pivotal role in breakouts and fakeouts:
Herd Mentality: Traders tend to follow momentum blindly, contributing to breakout acceleration or fakeout formation.
Fear and Greed: Overreaction to news or technical signals can trigger impulsive trades.
Confirmation Bias: Traders may convince themselves a breakout is genuine despite contrary signals, increasing susceptibility to fakeouts.
Patience and Discipline: Waiting for confirmation rather than entering prematurely is critical to successful breakout trading.
7. Risk Management Techniques for Breakout Trading
Breakout trading carries inherent risk. Effective strategies include:
Stop Loss Discipline: Placing stop-loss orders near the breakout point prevents large losses.
Diversification: Avoid overexposure to a single asset or breakout signal.
Trailing Stops: Protect profits by moving stops in the breakout direction.
Scaling In and Out: Gradually increase position size as the breakout proves itself, and consider partial exits at price targets.
8. Practical Examples
Example 1: Upside Breakout
Suppose a stock repeatedly tests resistance at $50. One day, it closes at $52 with high volume. Traders who enter the trade expect a continued upward trend. If the breakout is genuine, the price may climb to $60, with stop-losses placed just below $50.
Example 2: Fakeout
The same stock tests $50, briefly spikes to $52, but then falls back below $50 within hours. Traders who entered during the spike are trapped. Observing low volume and short-lived candlestick patterns could have prevented this loss.
9. Tools to Enhance Breakout Trading
Volume Indicators: On-Balance Volume (OBV), Volume Oscillator.
Trend Indicators: Moving Averages, MACD.
Volatility Indicators: Bollinger Bands, ATR (Average True Range).
Chart Patterns: Triangles, Flags, Pennants, Rectangles.
Candlestick Patterns: Engulfing patterns, Pin Bars, Doji formations.
10. Combining Breakout Trading with Other Strategies
Momentum Trading: Breakouts often align with momentum strategies. Combining them can enhance success rates.
Trend Following: Breakouts within strong trends are more likely genuine, offering high-probability trades.
Swing Trading: Breakout and fakeout analysis helps swing traders identify optimal entry and exit points.
Scalping: Intraday traders can exploit small breakout movements but must remain vigilant for fakeouts.
11. Common Mistakes in Breakout Trading
Entering Too Early: Jumping in before confirmation increases exposure to fakeouts.
Ignoring Volume: Trading breakouts without volume analysis often leads to losses.
Overleveraging: Using high leverage on breakouts can amplify losses during reversals.
Failure to Adjust Stops: Not trailing stop-losses or adjusting targets can erode profits.
Neglecting Market Context: Breakouts against the trend are riskier and more likely to fail.
12. Conclusion
Breakout and fakeout trading are fundamental concepts in technical analysis that offer lucrative opportunities when approached strategically. Breakouts signal market shifts and potential trend formations, while fakeouts remind traders of the risks associated with premature or misinformed entries. Successful trading requires a combination of:
Technical skills (chart analysis, pattern recognition, volume study)
Psychological discipline (patience, fear management, avoiding herd behavior)
Risk management (stop-loss placement, position sizing, diversification)
By understanding market mechanics, observing price and volume behavior, and integrating breakout and fakeout strategies with other trading techniques, traders can navigate financial markets more confidently and minimize the pitfalls of false signals. Ultimately, mastering breakouts and fakeouts equips traders with a sharper lens through which to interpret market movements and maximize returns.
Contains image
Derivative Trading Secrets: The Power of Financial Instruments1. Understanding Derivatives: The Foundation of Trading
At its core, a derivative is a financial instrument whose value depends on the price of an underlying asset. This underlying asset could be a stock, commodity, currency, interest rate, or even another derivative. Derivatives allow traders to speculate on price movements, hedge existing positions, and optimize portfolios.
The most common types of derivatives include:
Futures Contracts: Agreements to buy or sell an asset at a predetermined price at a specific future date. Futures are standardized and traded on exchanges.
Options Contracts: Contracts that give the buyer the right, but not the obligation, to buy (call option) or sell (put option) an underlying asset at a specified price before or on a specific date.
Swaps: Agreements to exchange cash flows or other financial instruments between parties, often used for interest rates or currencies.
Forwards: Similar to futures but are customized contracts traded over-the-counter (OTC) instead of on an exchange.
Secret Insight #1: The true power of derivatives lies not in the instruments themselves but in understanding their relationship with the underlying asset. Every option or futures contract is essentially a tool to manage risk or leverage opportunity—but misuse can magnify losses.
2. Leverage: A Double-Edged Sword
One of the most enticing aspects of derivatives is leverage. By putting down a fraction of the asset’s value, traders can control large positions. For instance, with a futures contract, you might control $100,000 worth of stock by investing just $10,000 as margin.
However, leverage is a double-edged sword. While profits can multiply, losses do too. Understanding the margin requirements, initial margin, and maintenance margin is critical. Secretly successful derivative traders treat leverage as a tool for precision, not speculation.
Secret Insight #2: The best traders use leverage conservatively and adjust it dynamically based on market volatility, rather than maximizing exposure blindly.
3. Hedging: Risk Management is the Hidden Key
While derivatives are often associated with speculation, professional traders primarily use them to hedge risk. Hedging involves taking a position in a derivative to offset potential losses in the underlying asset.
Example: A portfolio manager holding a large number of tech stocks may buy put options to protect against a market downturn. If stocks fall, the profit from the put options offsets the loss.
Cross-Hedging: Traders sometimes hedge using derivatives of a correlated asset when a direct hedge is unavailable.
Secret Insight #3: The most powerful secret in derivative trading is that you don’t always need to predict market direction to profit. Proper hedging ensures survival, which is the real foundation of consistent trading success.
4. Options: The Playground of Strategic Trading
Options offer unmatched flexibility, and understanding advanced options strategies separates amateurs from pros. Some commonly used strategies include:
Covered Call: Holding the underlying stock and selling call options to earn premiums while slightly limiting upside.
Protective Put: Buying a put option to protect an existing long position.
Straddles and Strangles: Betting on volatility rather than direction, buying calls and puts simultaneously to profit from big price swings.
Spreads: Using multiple options with different strike prices or expirations to limit risk while maintaining potential profit.
Secret Insight #4: Options are not just instruments for speculation; they are precision tools to tailor your risk-reward profile. Successful traders often combine multiple strategies to create synthetic positions that mimic market exposure while controlling risk.
5. Timing and Volatility: The Invisible Forces
A critical, often underappreciated, aspect of derivative trading is timing. Unlike stocks, the value of options and futures is heavily influenced by time decay (theta) and implied volatility (IV).
Time Decay: Options lose value as expiration approaches, a phenomenon most novice traders underestimate.
Implied Volatility: Options pricing depends on expected future volatility. Traders who anticipate shifts in IV can profit even if the underlying price remains steady.
Secret Insight #5: Mastering derivatives is largely about mastering the clock and the market’s emotional state. High volatility periods are opportunities for premium collection, while calm markets favor directional bets.
6. Arbitrage and Mispricing: The Professional Edge
Arbitrage opportunities arise when derivatives are mispriced relative to their underlying assets. For instance, a futures contract trading below its theoretical fair value creates a cash-and-carry arbitrage opportunity. Similarly, options mispricing can be exploited via synthetic positions.
Secret Insight #6: Most retail traders compete to predict price direction, while professionals often profit from inefficiencies and mispricings. Knowing when the market is wrong can be more profitable than knowing when it is right.
7. The Psychology of Derivative Trading
A secret often hidden in textbooks is that derivative trading is as much psychological as technical. The leverage and speed of derivatives amplify emotions—fear and greed can lead to catastrophic losses. Successful traders exhibit:
Discipline: Strict adherence to trading plans and risk limits.
Patience: Waiting for high-probability setups rather than chasing the market.
Adaptability: Adjusting positions dynamically based on market conditions rather than stubbornly sticking to predictions.
Secret Insight #7: Emotional intelligence is a derivative trader’s secret weapon. The market always offers opportunities, but controlling yourself ensures survival and long-term profitability.
8. Risk Management: Protect First, Profit Later
Perhaps the most critical secret in derivative trading is risk management. Traders often focus on potential profit while neglecting potential losses. Key principles include:
Position Sizing: Never risk more than a small percentage of total capital on a single trade.
Stop Losses: Automated or mental exit points prevent small losses from becoming catastrophic.
Portfolio Hedging: Diversifying exposure across different assets, sectors, or derivative types.
Margin Monitoring: Avoid over-leverage, which can trigger margin calls in volatile markets.
Secret Insight #8: The goal is not to win every trade but to avoid ruin. Derivative trading secrets favor survival and compounding small wins over chasing high-risk “big wins.”
9. Insider Tools and Data: The Market Edge
Advanced traders gain an edge by leveraging tools that provide insight into market positioning:
Open Interest and Volume Analysis: Tracking changes in futures and options can reveal market sentiment.
Implied Volatility Surfaces: Understanding IV across strikes and expirations helps spot mispricing.
Correlation and Greeks Analysis: Delta, gamma, theta, vega, and rho metrics allow traders to quantify sensitivity to market changes.
Secret Insight #9: Successful derivative traders treat data as fuel. Knowing how the market is positioned can help anticipate moves before they happen.
10. Continuous Learning: The Lifelong Secret
Derivatives are dynamic; markets evolve, instruments get more complex, and strategies shift with regulatory and economic changes. Traders who stay ahead are lifelong students, constantly refining:
Market models
Pricing techniques
Strategy combinations
Risk management rules
Secret Insight #10: The single most reliable secret of derivative trading is humility. Accepting that the market can always surprise you ensures you remain flexible and avoid catastrophic losses.
11. Practical Takeaways for Aspiring Traders
Start Small: Begin with simulated or small-size trades to master instruments.
Focus on One Market: Specialize in one type of derivative—options, futures, or swaps—before diversifying.
Document Every Trade: Learn from successes and failures to refine strategies.
Avoid Over-Leverage: Leverage magnifies losses as much as gains; control it carefully.
Master Volatility: Understand how time decay and implied volatility impact pricing.
Hedge Thoughtfully: Protecting capital is more important than chasing profits.
Conclusion
Derivative trading is not just about predicting market direction. It is about mastering risk, timing, leverage, and psychology. Professionals profit by understanding mispricings, managing exposure, and exploiting volatility intelligently. The secrets of derivatives lie in subtlety—small edges, disciplined risk management, and continuous learning compound over time into substantial returns.
Success in derivative trading is less about luck and more about precision, patience, and protection. Those who master these principles can unlock the true potential of derivatives—an opportunity to control risk, amplify gains, and thrive in even the most volatile markets.
Option Trading StrategiesIntroduction
Option trading is one of the most dynamic and flexible segments of the financial markets. Unlike traditional stock trading, which involves buying or selling shares outright, options provide traders the right but not the obligation to buy or sell an asset at a predetermined price on or before a specified date. This flexibility makes options powerful tools for hedging, speculation, and income generation. However, they require a deep understanding of pricing, volatility, and market behavior. In this essay, we’ll explore the foundations of option trading, key strategies for different market conditions, risk management principles, and how professional traders use options to optimize returns.
Understanding Options: The Basics
Options are derivatives—financial instruments that derive their value from an underlying asset such as stocks, indices, commodities, or currencies. There are two primary types of options:
Call Options:
A call option gives the holder the right to buy the underlying asset at a specific price (called the strike price) before or on the expiration date.
Put Options:
A put option gives the holder the right to sell the underlying asset at the strike price before or on the expiration date.
When traders buy options, they pay a premium—the cost of acquiring the option. Sellers (also called writers) receive this premium and take on the obligation to fulfill the contract if exercised.
Key Concepts in Option Trading
Before diving into strategies, it’s essential to understand the factors influencing option prices and risk:
Intrinsic Value: The actual value if exercised immediately. For a call, it’s the difference between the current price and the strike price (if positive).
Time Value: Reflects the potential for the option to gain value before expiration. Longer expiries usually mean higher time value.
Volatility: Measures how much the underlying asset’s price fluctuates. Higher volatility typically increases option premiums.
The Greeks: Metrics that quantify risk and sensitivity.
Delta: Measures how much the option price moves per unit change in the underlying asset.
Gamma: Tracks the rate of change of delta.
Theta: Represents time decay—how much value an option loses daily as expiration nears.
Vega: Sensitivity to changes in volatility.
Rho: Measures sensitivity to interest rate changes.
Understanding these metrics helps traders manage positions strategically rather than speculatively.
Option Trading Strategies
Option trading strategies can be broadly categorized into bullish, bearish, neutral, and volatility-based approaches. Below is a breakdown of the most commonly used strategies for each scenario.
1. Bullish Strategies
When traders expect prices to rise, they can use bullish strategies to profit while managing risk.
a. Long Call
Objective: Profit from a significant upward move.
Structure: Buy one call option.
Risk: Limited to the premium paid.
Reward: Theoretically unlimited as the price rises.
This is a simple directional play where the trader benefits if the underlying asset moves well above the strike price before expiration.
b. Bull Call Spread
Objective: Moderate bullish view with reduced cost.
Structure: Buy a call at a lower strike and sell a call at a higher strike (same expiration).
Risk: Limited to the net premium paid.
Reward: Capped at the difference between strikes minus cost.
This strategy reduces the upfront premium compared to a long call while capping the maximum gain.
c. Cash-Secured Put
Objective: Acquire stock at a discount or earn income.
Structure: Sell a put while holding enough cash to buy the stock if assigned.
Risk: Potential loss if the stock falls sharply.
Reward: Premium received.
Traders use this to generate steady income while positioning to buy quality stocks at lower prices.
2. Bearish Strategies
When the outlook is negative, traders adopt bearish strategies to profit from falling prices.
a. Long Put
Objective: Profit from a significant downward move.
Structure: Buy one put option.
Risk: Limited to the premium paid.
Reward: Substantial, as the underlying approaches zero.
A long put acts like shorting a stock but with defined risk.
b. Bear Put Spread
Objective: Moderate bearish expectation with cost efficiency.
Structure: Buy a put at a higher strike and sell another at a lower strike.
Risk: Limited to the net cost.
Reward: Limited to the difference between strikes minus cost.
This strategy benefits from moderate price declines and reduces premium outlay.
c. Covered Call (Bearish to Neutral Adjustment)
Objective: Generate income when holding a stock expected to stay flat or slightly decline.
Structure: Own the stock and sell a call option.
Risk: Downside exposure from stock ownership.
Reward: Premium plus any stock appreciation up to strike.
3. Neutral Strategies
When traders expect little price movement, they can capitalize on time decay or stable prices.
a. Iron Condor
Objective: Profit from low volatility.
Structure: Combine a bull put spread and a bear call spread.
Risk: Limited to the difference between strikes minus total premium received.
Reward: Limited to the net premium received.
Iron condors work best when the underlying trades within a defined range, allowing both sides to expire worthless.
b. Butterfly Spread
Objective: Profit from a stable underlying price.
Structure: Buy one call (or put) at a lower strike, sell two at a middle strike, and buy one at a higher strike.
Risk: Limited to cost.
Reward: Maximum at the middle strike at expiration.
This is a precision strategy ideal for range-bound markets.
c. Calendar Spread
Objective: Benefit from time decay differences.
Structure: Sell a near-term option and buy a longer-term option at the same strike.
Risk: Limited to initial cost.
Reward: Profit from slower time decay of the long option.
Calendar spreads exploit differing decay rates between short-term and long-term options.
4. Volatility-Based Strategies
These strategies focus on changes in volatility rather than price direction.
a. Straddle
Objective: Profit from large movements either up or down.
Structure: Buy one call and one put at the same strike and expiration.
Risk: Combined premium paid.
Reward: Unlimited potential on one side.
Straddles are useful before major news events or earnings announcements.
b. Strangle
Objective: Similar to straddle but cheaper.
Structure: Buy a call and put with different strike prices.
Risk: Lower premium cost.
Reward: Unlimited upside or significant downside.
This strategy works when a trader expects major volatility but is unsure of direction.
c. Vega Trading (Volatility Arbitrage)
Objective: Trade volatility itself.
Structure: Long or short volatility via options, regardless of direction.
Risk/Reward: Based on volatility change rather than price.
Professional traders often hedge such positions using futures or underlying shares.
Advanced and Professional Option Strategies
Experienced traders and institutions often employ complex, multi-leg strategies:
Ratio Spreads: Involves buying one option and selling multiple of another to benefit from small directional moves with volatility decay.
Box Spread (Arbitrage): A risk-free structure exploiting mispriced options to lock in small profits.
Protective Collar: Own stock, buy a put, and sell a call to limit downside while capping upside.
Delta-Neutral Trading: Balancing positions so overall delta equals zero, allowing profits from volatility and time decay rather than direction.
These advanced methods require constant adjustment (known as dynamic hedging) and deep knowledge of the Greeks.
Risk Management in Option Trading
Options can magnify both profit and loss. Effective traders prioritize risk management over speculation:
Position Sizing: Never risk more than a small percentage of capital per trade.
Stop-Loss and Adjustment: Closing or adjusting losing trades early prevents large drawdowns.
Volatility Awareness: Avoid selling naked options in highly volatile environments.
Diversification: Spread exposure across sectors, strikes, and expiration dates.
Greeks Monitoring: Keeping delta, gamma, and theta balanced helps maintain controlled exposure.
Psychology of Option Trading
Emotional discipline is as important as technical skill. Traders must avoid:
Overleveraging based on short-term profits.
Chasing volatile trades without understanding volatility pricing.
Ignoring the impact of time decay (theta burn).
Successful option traders approach the market with a probabilistic mindset—thinking in terms of risk-reward ratios, probability of profit, and expected value rather than absolute certainty.
Option Trading in the Global and Indian Markets
Globally, option markets such as the CBOE (Chicago Board Options Exchange) and Eurex dominate institutional trading volumes. In India, the NSE (National Stock Exchange) has become one of the largest options markets, with the NIFTY and BANKNIFTY options leading in liquidity.
Indian retail participation has surged due to low capital requirements and technological ease. However, many traders misunderstand the risks of selling naked options or holding positions till expiry, where time decay accelerates.
Regulators like SEBI have emphasized investor education, margin discipline, and transparency to ensure sustainable participation.
Advantages of Option Trading
Flexibility: Profit in any market condition—up, down, or sideways.
Leverage: Control large positions with small capital.
Defined Risk: Losses are predetermined in most strategies.
Hedging Tool: Protect portfolios against adverse movements.
Income Generation: Through premium collection in neutral markets.
Disadvantages and Challenges
Complexity: Requires deep knowledge of pricing models and Greeks.
Time Decay: Erodes option value quickly near expiry.
Volatility Risk: Sudden volatility drops can cause losses.
Liquidity Issues: Some strikes have wide bid-ask spreads.
Psychological Pressure: High leverage can lead to emotional trading.
Conclusion
Option trading is a sophisticated and versatile component of modern financial markets. It empowers traders and investors to customize risk, hedge portfolios, and generate income across all market conditions. However, it demands education, discipline, and a structured approach. Successful traders master both the art and science of options—balancing technical analysis, volatility insights, and emotional control.
In essence, options are not just speculative instruments—they are strategic tools. Whether one uses them to hedge against uncertainty, generate consistent income, or speculate on directional moves, mastering option trading strategies opens doors to deeper understanding, higher efficiency, and sustainable profitability in the financial markets.

Part 2 Ride The Big Moves American vs. European Options
Options can be American-style or European-style. American options can be exercised any time before expiry, while European options can be exercised only on the expiry date. In India, stock options are American, while index options are European.
In-the-Money, At-the-Money, and Out-of-the-Money
These terms describe an option’s relationship to the current market price:
In-the-Money (ITM): Option has intrinsic value.
At-the-Money (ATM): Strike price equals the current price.
Out-of-the-Money (OTM): Option has no intrinsic value yet.

Part 1 Ride The Big Moves American vs. European Options
Options can be American-style or European-style. American options can be exercised any time before expiry, while European options can be exercised only on the expiry date. In India, stock options are American, while index options are European.
In-the-Money, At-the-Money, and Out-of-the-Money
These terms describe an option’s relationship to the current market price:
In-the-Money (ITM): Option has intrinsic value.
At-the-Money (ATM): Strike price equals the current price.
Out-of-the-Money (OTM): Option has no intrinsic value yet.

PCR Trading Strategies Option Greeks – Risk Indicators
“Greeks” like Delta, Gamma, Theta, Vega, and Rho measure how sensitive an option’s price is to factors such as the underlying asset’s price, volatility, time decay, and interest rates. They help traders assess risk precisely.
Strategies and Combinations
Traders combine calls and puts to create option strategies such as straddles, strangles, spreads, and iron condors. These allow profit from different market conditions—rising, falling, or even sideways trends.

Part 1 Support and Resistance Option Buyers vs. Sellers
Buyers have limited risk (only the premium paid) but unlimited profit potential.
Sellers (writers) have limited profit (the premium received) but potentially unlimited loss, especially in uncovered positions.
Leverage and Capital Efficiency
Options allow traders to control large positions with a small investment. This leverage magnifies both profits and losses, making options powerful but risky tools for speculation or hedging.

Part 2 Support and Resistance Intrinsic and Time Value
An option’s price consists of two parts:
Intrinsic Value: The actual profit if exercised now.
Time Value: The extra value based on time left until expiry and volatility expectations.
Hedging and Risk Management
Investors use options to hedge against adverse price movements. For example, holding puts can protect a stock portfolio from market declines—similar to buying insurance.

Part 2 Candle Stick PatternStrike Price and Expiry Date
Every option has a strike price (the agreed-upon price for buying/selling) and an expiry date (the last date the option can be exercised). These two factors determine an option’s time value and overall profitability.
Premium – The Cost of the Option
The premium is the price paid by the buyer to the seller (writer) of the option. It represents the maximum loss for the buyer and potential profit for the seller if the option expires worthless.

Part 1 Candle Stick PatternDefinition of Options
Options are financial contracts that give traders the right, but not the obligation, to buy or sell an underlying asset (like stocks, indices, or commodities) at a predetermined price within a specific time frame. They are a type of derivative since their value depends on the price of another asset.
Types of Options – Call and Put
There are two main types:
Call Option: Gives the right to buy the asset at a fixed price.
Put Option: Gives the right to sell the asset at a fixed price.
Traders use calls when expecting prices to rise and puts when expecting prices to fall.

The Role of Futures Trading in India:Futures Trading Role in India
Futures trading, a vital component of financial markets, has gradually carved a significant niche in India’s economic landscape. It is a type of derivative instrument where two parties agree to buy or sell an asset at a predetermined price at a specified future date. These instruments play an essential role in risk management, price discovery, and enhancing market liquidity. India, being a rapidly growing economy with increasing integration into global financial markets, has seen substantial evolution in its futures trading segment over the last two decades.
1. Historical Context of Futures Trading in India
Futures trading in India dates back to the pre-independence era, primarily focused on agricultural commodities. Traditional forward contracts existed informally among farmers, traders, and merchants. However, with modernization and regulatory oversight, formal commodity futures markets emerged. The establishment of the Forward Markets Commission (FMC) in 1953 marked the beginning of a regulated framework for futures trading. Initially, trading was largely concentrated in agricultural commodities like cotton, jute, and grains.
The 1990s economic liberalization in India marked a turning point. Financial sector reforms, introduction of electronic trading, and liberal policies facilitated the growth of derivative instruments, particularly stock and index futures. The Securities and Exchange Board of India (SEBI) allowed the introduction of futures and options (F&O) on equities in 2000, providing investors and traders new avenues to hedge risk and speculate on price movements. Today, both commodity and financial futures markets are integral parts of India’s capital markets ecosystem.
2. Structure of Futures Markets in India
India has a well-defined framework for futures trading governed by SEBI for financial derivatives and previously FMC for commodity derivatives (now merged with SEBI in 2015). Futures contracts are traded on recognized exchanges like:
National Stock Exchange (NSE)
Bombay Stock Exchange (BSE)
Multi Commodity Exchange (MCX)
National Commodity & Derivatives Exchange (NCDEX)
Futures contracts in India cover various asset classes including equities, indices, commodities (metals, energy, agricultural products), and currencies. Standardized contracts ensure uniformity in terms of quantity, quality, delivery dates, and settlement procedures. Such regulation reduces counterparty risk, a critical factor in promoting investor confidence.
3. Functions and Role of Futures Trading
Futures trading serves several important functions in India’s financial ecosystem:
a. Risk Management and Hedging
One of the primary roles of futures trading is risk management. Businesses, farmers, manufacturers, and investors face price volatility in commodities and financial instruments. Futures contracts allow them to hedge against adverse price movements. For instance:
Agricultural Producers: Farmers can lock in a price for crops such as wheat or soybean months before harvest to protect against price drops.
Industrial Users: Companies reliant on raw materials (like metals or oil) use futures contracts to manage cost fluctuations.
Investors and Portfolio Managers: Equity futures allow investors to hedge stock positions against market downturns.
Hedging through futures reduces uncertainty, stabilizes income, and enables better planning for businesses and investors alike.
b. Price Discovery
Futures markets play a critical role in price discovery. The interaction of buyers and sellers, reflecting supply-demand dynamics, expectations, and global trends, helps establish a transparent market price for assets. Indian futures markets, particularly for commodities like crude oil, gold, and agricultural produce, provide real-time pricing signals, enabling market participants to make informed decisions.
c. Liquidity Provision
Futures trading enhances market liquidity. By attracting a wide array of participants—including speculators, hedgers, and arbitrageurs—the volume and turnover increase. This liquidity ensures smoother transactions and narrower bid-ask spreads. It also allows smaller traders to enter markets without impacting prices significantly.
d. Investment and Speculation
While hedging is a primary motive, futures markets also attract speculators seeking profit from price movements. Speculators, by providing liquidity and taking on risk, play a crucial role in market efficiency. Their participation ensures continuous trading and contributes to price discovery mechanisms.
e. Economic Significance
Futures trading has broader economic implications. It encourages capital formation, efficient allocation of resources, and reduces wastage in commodities markets by providing reliable pricing mechanisms. For agricultural commodities, futures markets help minimize distress sales by farmers, leading to better income stability.
4. Key Futures Products in India
a. Equity and Index Futures
Equity futures are contracts to buy or sell shares of companies at a predetermined price on a future date. Index futures, on the other hand, are based on market indices like Nifty 50 or Sensex, allowing investors to hedge or speculate on the broader market movement. These derivatives have grown exponentially, with NSE being one of the largest derivative exchanges globally by volume.
b. Commodity Futures
Commodity futures in India cover agricultural products (like wheat, soybean, cotton), metals (gold, silver, copper), and energy (crude oil, natural gas). Exchanges like MCX and NCDEX facilitate transparent trading, helping farmers, traders, and industries manage risks associated with price volatility.
c. Currency Futures
Currency futures involve trading in INR against major currencies like USD, EUR, GBP, and JPY. These contracts are crucial for exporters, importers, and multinational companies to hedge foreign exchange risk. NSE and BSE provide active platforms for currency derivatives trading.
5. Regulatory Framework
The Securities and Exchange Board of India (SEBI) oversees all financial futures and commodity derivatives markets, ensuring investor protection, transparency, and integrity. Key regulatory measures include:
Mandatory margin requirements to reduce counterparty risk.
Strict position limits to avoid market manipulation.
Settlement guarantee mechanisms to ensure contract fulfillment.
Surveillance and monitoring to prevent insider trading and speculative excesses.
This robust regulatory framework has increased investor confidence and contributed to the growth of India’s futures markets.
6. Advantages of Futures Trading in India
Risk Mitigation: Futures provide a tool to hedge against price volatility and protect investments.
Transparent Price Discovery: Open trading ensures fair market prices, reflecting real-time supply-demand conditions.
Market Efficiency: High liquidity and participation reduce inefficiencies and arbitrage opportunities.
Economic Planning: Predictable pricing helps businesses and policymakers make informed decisions.
Investment Opportunities: Futures markets allow both institutional and retail investors to diversify portfolios and potentially earn profits from short-term price movements.
7. Challenges and Risks
Despite its benefits, futures trading carries certain risks:
Leverage Risk: Futures involve high leverage, which can amplify both profits and losses.
Speculative Excess: Excessive speculation may cause volatility, particularly in commodity markets.
Limited Awareness: Many retail investors lack proper understanding of derivative instruments, leading to potential losses.
Regulatory Complexity: Compliance and monitoring requirements can be challenging for new entrants and small traders.
8. Recent Developments and Technological Impact
The last decade has witnessed significant modernization in Indian futures markets. Electronic trading platforms, algorithmic trading, and mobile trading apps have made futures more accessible to retail investors. Advanced risk management tools, real-time analytics, and margin calculators have increased transparency and reduced operational risks. Moreover, SEBI’s initiatives to promote commodity futures among small farmers have enhanced market participation and economic inclusion.
9. Future Outlook
India’s futures trading market is poised for substantial growth due to:
Economic Growth: Expanding industrialization and agricultural modernization increase demand for hedging instruments.
Global Integration: Rising participation in global markets necessitates efficient derivatives to manage cross-border risks.
Financial Literacy: Awareness campaigns and investor education programs encourage participation from retail investors.
Technological Advancement: AI-driven analytics, blockchain-based settlement, and improved trading platforms will increase efficiency and trust.
Policy Support: Government initiatives to promote agricultural and industrial hedging are likely to expand futures market adoption.
Futures trading, therefore, is expected to play an even larger role in stabilizing prices, managing risk, and contributing to India’s economic growth in the coming years.
10. Conclusion
Futures trading in India has evolved from a small, commodity-focused market to a sophisticated ecosystem encompassing equities, indices, commodities, and currencies. Its primary roles—hedging, risk management, price discovery, and liquidity provision—make it an indispensable component of modern financial markets. With growing investor awareness, technological innovation, and regulatory support, futures markets are expected to continue expanding, driving efficiency and stability in India’s economy. While risks and challenges remain, the benefits—both for individual investors and the broader economy—underscore the critical role of futures trading in shaping India’s financial landscape.
News Impact on Trading Decisions1. Introduction to News-Based Trading
News-based trading, often referred to as event-driven trading, is a strategy where market participants react to new information to anticipate and profit from price movements. News can include economic releases, corporate announcements, geopolitical developments, central bank communications, or even unexpected global events such as natural disasters or pandemics. The rationale behind news trading is simple: markets tend to adjust quickly when new information alters the perceived value of an asset.
Traders often categorize news into two main types: scheduled news and unscheduled news.
Scheduled News: These are events known in advance, such as central bank interest rate decisions, quarterly earnings reports, employment data, inflation figures, and GDP releases. Since the timing and nature of these releases are anticipated, traders can prepare strategies in advance, such as setting stop-loss levels, entry points, or hedging positions.
Unscheduled News: These are unexpected events that can have immediate and dramatic market consequences. Examples include political upheavals, terrorist attacks, regulatory announcements, or sudden corporate scandals. Because these events are unanticipated, they often trigger rapid market reactions and higher volatility.
2. The Psychological and Behavioral Impact of News
Market reactions to news are not always purely rational. Behavioral finance suggests that human psychology, including emotions like fear, greed, and overconfidence, heavily influences trading decisions. News can amplify these psychological responses in several ways:
Fear and Panic: Negative news, such as economic recessions or corporate scandals, often triggers panic selling. Traders may exit positions quickly to limit losses, causing sharp downward price movements.
Greed and Optimism: Positive news, such as strong earnings or favorable government policies, can create FOMO (Fear of Missing Out), prompting traders to buy aggressively. This can push prices above their intrinsic value in the short term.
Herd Behavior: Traders often mimic the actions of others during major news events. If influential market players act decisively on news, others tend to follow, amplifying the market reaction.
Understanding these psychological responses allows traders to anticipate short-term price movements and manage their positions more effectively.
3. Types of News and Their Market Impact
News can influence trading decisions differently depending on its type and significance:
a) Economic News
Economic indicators such as inflation, unemployment rates, consumer confidence, and industrial production affect traders’ perception of a country’s economic health. For example, higher-than-expected inflation might trigger fears of interest rate hikes, causing bond prices to fall and the local currency to strengthen. Traders often use economic calendars to track such announcements and position themselves accordingly.
b) Corporate News
Corporate announcements, including earnings reports, dividend declarations, mergers and acquisitions, or management changes, directly impact individual stocks. A company reporting higher-than-expected profits may see its stock rise, while a profit warning could lead to rapid sell-offs. Institutional traders often analyze these reports in detail, considering not only the headline numbers but also guidance and forward-looking statements.
c) Political and Geopolitical News
Elections, government policy changes, trade negotiations, and conflicts can influence market sentiment. For instance, news of favorable trade agreements may boost market optimism, while geopolitical tensions may increase risk aversion, benefiting safe-haven assets like gold or government bonds.
d) Market Rumors and Speculative News
Even unverified news can influence markets, especially in the short term. Social media and financial news portals often disseminate rumors that create temporary price swings. Traders using algorithmic systems may react within milliseconds, leading to sudden spikes or drops.
4. News Trading Strategies
Traders adopt various strategies to capitalize on news events. These strategies range from reactive to proactive, depending on the trader’s risk appetite and time horizon.
a) Event-Driven Trading
Event-driven traders specifically target scheduled or unscheduled events that are likely to create significant market volatility. For example, a trader may position themselves ahead of a central bank meeting, expecting a certain interest rate outcome.
b) Momentum Trading
News often initiates momentum trends. Traders may follow the initial price movement triggered by news, entering positions in the direction of the trend. The idea is to ride the wave of market sentiment until signs of reversal appear.
c) Contrarian Trading
Contrarian traders take positions opposite to the initial market reaction to news. They may believe that markets overreact to certain news, creating opportunities to profit from price corrections.
d) Algorithmic and High-Frequency Trading
Modern trading relies heavily on technology to react to news at lightning speed. Algorithms scan news feeds, social media, and economic releases to execute trades in milliseconds. High-frequency traders capitalize on the brief windows of price inefficiencies caused by news.
5. Challenges of Trading Based on News
While news trading can be profitable, it comes with significant challenges:
Market Volatility: News events often create rapid price fluctuations, increasing the risk of slippage and triggering stop-loss orders.
Information Overload: Traders face an overwhelming amount of news daily. Distinguishing between material and trivial news is critical.
Unpredictable Reactions: Market responses are not always intuitive. Positive news may lead to selling if investors had anticipated even better outcomes, and vice versa. This phenomenon is often referred to as “buy the rumor, sell the news.”
Time Sensitivity: News impact is usually short-lived. Traders must act quickly to capitalize on opportunities, which requires constant monitoring and decision-making.
Manipulation Risks: Some market participants may attempt to manipulate prices through false or misleading news, making it essential for traders to verify information before acting.
6. Case Studies Illustrating News Impact
a) Economic Announcements
For example, in 2023, when the U.S. Federal Reserve unexpectedly signaled a pause in interest rate hikes, the stock market surged, while bond yields fell. Traders who anticipated or quickly reacted to this news profited from the immediate price movements.
b) Corporate Earnings
Apple Inc.’s quarterly earnings often move not only its stock but also the broader technology sector. A higher-than-expected revenue report can create a ripple effect across indices, influencing related stocks and ETFs.
c) Geopolitical Events
During the Russia-Ukraine conflict, oil and gas prices surged due to supply concerns. Traders who positioned themselves correctly benefited from rapid price appreciation, while those unprepared faced substantial losses.
7. Tools and Techniques for News-Based Trading
Successful news trading relies on timely and reliable information. Traders use a combination of tools:
News Feeds: Services like Bloomberg, Reuters, and Dow Jones provide real-time news updates.
Economic Calendars: Platforms like Forex Factory list scheduled economic releases, allowing traders to prepare.
Social Media Monitoring: Twitter, Reddit, and financial forums often disseminate early information, which some traders use for short-term positioning.
Sentiment Analysis Tools: Algorithms and AI-driven tools analyze market sentiment from news articles, social media, and press releases to gauge potential market reactions.
Trading Platforms: Advanced platforms allow for instant order execution, essential for capitalizing on news-driven price moves.
8. Risk Management in News Trading
Given the volatility associated with news, risk management is crucial. Traders use several techniques:
Stop-Loss Orders: Automatically exit positions when prices reach a predefined level to limit losses.
Position Sizing: Adjusting the size of trades to reduce exposure during high-volatility events.
Hedging: Using options, futures, or other derivatives to offset potential losses.
Diversification: Avoid concentrating on a single asset or market to spread risk.
9. The Future of News Impact on Trading
As technology evolves, the impact of news on trading will continue to grow. Artificial intelligence, machine learning, and natural language processing allow traders to parse news faster and more accurately than ever before. Algorithmic trading systems that respond in milliseconds are likely to dominate, making timely access to verified news an even more critical factor. Additionally, social media platforms are becoming increasingly influential, amplifying the speed and reach of news-driven market reactions.
However, human judgment will remain vital. Understanding context, market psychology, and the nuances of geopolitical and corporate developments can give traders an edge that pure automation may not fully replicate.
10. Conclusion
News is a powerful force in financial markets, shaping investor behavior, influencing asset prices, and creating both opportunities and risks for traders. Understanding the types of news, market psychology, and appropriate trading strategies is essential for capitalizing on information-driven price movements. While technology and algorithms provide speed and efficiency, successful news trading requires careful analysis, risk management, and a nuanced understanding of market dynamics.
Ultimately, traders who can effectively interpret news and act decisively are better positioned to navigate the ever-changing landscape of financial markets. Whether trading equities, currencies, commodities, or derivatives, recognizing the profound impact of news is a cornerstone of informed and strategic trading.
Controlling Trading Risk Factors1. Understanding Trading Risk
Before discussing control measures, it is crucial to understand what trading risk is. Trading risk refers to the potential for financial loss arising from market movements, operational errors, or external factors. Risk can be divided into several types:
Market Risk – The possibility that the market moves against your position. For example, a sudden drop in stock prices affects long positions.
Liquidity Risk – The risk of not being able to exit a trade at a desired price due to insufficient market activity.
Leverage Risk – Using borrowed funds amplifies both potential gains and potential losses.
Operational Risk – Mistakes in trade execution, technology failures, or system errors.
Psychological Risk – Emotional trading due to fear or greed can lead to impulsive decisions.
Event Risk – Unexpected events, such as geopolitical issues, economic crises, or corporate announcements, can create volatility.
Understanding these risks helps traders implement strategies to mitigate potential losses.
2. Establishing a Risk Management Plan
A risk management plan is a trader’s blueprint for controlling exposure to risk. Without a plan, trading becomes speculative gambling rather than a calculated activity. A well-defined risk management plan should include the following elements:
a. Define Your Risk Tolerance
Risk tolerance refers to the amount of loss a trader is willing to accept on a trade or overall portfolio. Factors influencing risk tolerance include:
Financial capacity: How much capital can you afford to lose without affecting your livelihood?
Trading style: Day traders generally accept smaller losses per trade, while long-term investors may tolerate temporary volatility.
Psychological resilience: Emotional strength is key to sticking with a strategy during losing streaks.
Practical Tip: Limit risk per trade to a small percentage of total capital—commonly 1-2%. This ensures that a few bad trades do not wipe out your account.
b. Set Clear Objectives
Traders must define their financial goals and time horizon. Risk control strategies vary based on whether you aim for short-term profits, steady income, or long-term wealth accumulation. Clear objectives help avoid overtrading and speculative behavior.
c. Use Position Sizing
Position sizing is the method of determining how much capital to allocate to a particular trade based on your risk tolerance. Proper position sizing reduces the risk of catastrophic losses.
Example:
If a trader has $50,000 and is willing to risk 2% per trade ($1,000), and the stop-loss distance is $5 per share, the position size = $1,000 ÷ $5 = 200 shares.
Position sizing ensures that losses are proportional to your risk tolerance.
3. Stop-Loss and Take-Profit Orders
The most fundamental tools in risk management are stop-loss and take-profit orders.
Stop-Loss: Automatically closes a trade when it reaches a specified loss level. This prevents small losses from turning into catastrophic ones.
Take-Profit: Automatically closes a trade when it reaches a target profit. This locks in gains and prevents greed-driven reversals.
Best Practices:
Place stop-loss orders at strategic technical levels, such as support or resistance, rather than arbitrary amounts.
Adjust stop-loss levels as the trade moves in your favor to lock in profits (trailing stops).
4. Diversification
Diversification is a core principle in reducing risk. It involves spreading capital across multiple assets, sectors, or markets to avoid exposure to a single source of loss.
Examples of diversification strategies:
Investing in different asset classes: stocks, bonds, commodities, and currencies.
Trading multiple industries or sectors to reduce company-specific risks.
Combining long and short positions to hedge market movements.
Caution: Over-diversification may dilute profits. Balance diversification with focus.
5. Leverage Management
Leverage magnifies both profits and losses. Excessive leverage is one of the fastest ways traders destroy their capital. Controlling leverage is critical to risk management.
Guidelines:
Use conservative leverage ratios, especially for beginners.
Calculate potential loss before opening a leveraged position.
Understand margin requirements and liquidation risks.
Leverage is a double-edged sword; disciplined use can enhance gains, but careless use can wipe out accounts.
6. Monitoring and Controlling Market Volatility
Market volatility increases risk, as prices may swing dramatically within short periods. Traders can control volatility risk through:
Volatility Stop-Loss: Adjust stop-loss distances according to market volatility. Higher volatility requires wider stops.
Avoid Trading During Extreme Events: Avoid trading during major announcements, elections, or geopolitical crises unless part of a specific high-risk strategy.
Use Options and Hedging: Options contracts and futures can hedge positions against unexpected price swings.
Volatility management is about balancing opportunity with protection.
7. Regular Risk Assessment
Risk is dynamic; it evolves with changing market conditions. Traders should continuously assess exposure to risk using:
Value at Risk (VaR): Estimates the maximum potential loss in a portfolio over a specified period.
Stress Testing: Simulates extreme market conditions to evaluate how positions perform under stress.
Risk/Reward Ratio: Aims for trades with favorable ratios, e.g., 1:2 risk/reward, meaning potential gains exceed potential losses.
Regular assessment ensures traders adapt strategies before losses escalate.
8. Controlling Psychological Risk
Emotions are among the most dangerous risk factors. Fear and greed often override rational analysis, leading to impulsive trading.
Techniques to control psychological risk:
Follow a Trading Plan: Predefined rules for entry, exit, and risk prevent emotional decisions.
Maintain a Trading Journal: Document trades, decisions, and emotional state to identify patterns of bias.
Accept Losses: Avoid revenge trading to recover losses; stick to risk limits.
Mindfulness and Discipline: Practices like meditation, exercise, and scheduled breaks can improve decision-making under stress.
Emotional control is as important as technical analysis in trading.
9. Technology and Risk Management
Modern trading relies heavily on technology, but it introduces operational risks. Traders should mitigate these risks by:
Using reliable trading platforms with robust backup systems.
Regularly updating software and security protocols.
Setting alerts for significant market moves.
Implementing automated risk controls, such as algorithmic stop-loss or position size adjustments.
Technology, when used responsibly, enhances risk control.
10. Continuous Education and Market Awareness
Markets evolve constantly. Regulatory changes, technological developments, and global events impact risk. Traders should:
Stay informed about macroeconomic indicators and news.
Continuously learn new risk management techniques.
Review past trades and strategies to identify mistakes and successes.
Education reduces the risk of being blindsided by unforeseen market events.
11. Advanced Risk Control Techniques
For experienced traders, advanced techniques can further reduce risk exposure:
Hedging: Using derivative instruments like options, futures, or CFDs to offset potential losses.
Correlation Analysis: Understanding how assets move relative to each other to avoid unintended concentration of risk.
Scaling In and Out: Entering or exiting positions in stages to manage exposure.
Algorithmic Risk Controls: Automated trading systems can enforce discipline and minimize human error.
These strategies require knowledge and practice but can significantly enhance risk management.
12. Building a Risk-Resilient Trading Mindset
The ultimate defense against trading risk is a resilient mindset. A trader must:
Accept that losses are inevitable; success comes from managing them.
Focus on long-term consistency rather than short-term wins.
Combine technical and fundamental analysis with disciplined risk strategies.
View risk management as a proactive process, not a reactionary one.
The mindset shift from “maximizing profits” to “minimizing losses” is key to sustainable trading.
Conclusion
Trading risk is unavoidable, but it is controllable. Effective risk management encompasses strategic planning, disciplined execution, emotional control, and continuous learning. By defining risk tolerance, using stop-losses, managing leverage, diversifying portfolios, and applying advanced techniques, traders can protect their capital while pursuing profits.
Ultimately, controlling trading risk is not about eliminating it—this is impossible—but about managing it in a calculated, disciplined manner. Traders who master risk control enjoy longevity in the markets, preserve capital, and create a foundation for consistent, sustainable growth.
Retail vs. Institutional Trading1. Definitions
Retail trading refers to trading activities conducted by individual investors using their personal capital. Retail traders typically operate through brokers or online trading platforms and are often motivated by personal financial goals such as wealth accumulation, retirement planning, or short-term profits. Retail traders generally have smaller capital compared to institutional traders and face different challenges in market access and resources.
Institutional trading, on the other hand, refers to trades executed by large organizations such as hedge funds, mutual funds, pension funds, insurance companies, and investment banks. Institutional traders operate with substantial capital, professional teams, and sophisticated technologies to influence market prices and execute high-volume transactions. They are considered major market movers due to the size and frequency of their trades.
2. Participants in Retail and Institutional Trading
Retail Traders
Retail traders are often individual investors who trade for personal financial goals. They include:
Day traders who buy and sell securities within a single trading day.
Swing traders who hold positions for several days to weeks.
Long-term investors who invest for years, such as those saving for retirement.
Retail traders usually access the market through:
Online brokerages (e.g., Zerodha, Robinhood, E*TRADE)
Mobile trading apps
Advisory services for trade recommendations
Institutional Traders
Institutional traders are professional entities managing large pools of capital. They include:
Hedge funds: Seek high returns through aggressive and often leveraged strategies.
Mutual funds: Invest on behalf of retail or institutional clients, focusing on long-term growth.
Pension funds: Invest large sums to meet future obligations.
Investment banks: Engage in proprietary trading and market-making.
Insurance companies: Manage investment portfolios to match policyholder obligations.
Institutional traders have access to:
Proprietary trading algorithms
Direct market access
Extensive research teams
High-frequency trading systems
3. Capital and Market Influence
A defining difference between retail and institutional traders is the size of capital. Retail traders typically operate with small to moderate amounts of personal money. While individual trades rarely impact the market, retail sentiment can create short-term volatility in smaller stocks, particularly in emerging sectors or thinly traded securities.
Institutional traders, however, manage millions to billions in assets. A single trade from a large hedge fund or mutual fund can move stock prices, especially in mid- or small-cap markets. Their trades often influence market trends and liquidity, making them crucial participants in price discovery.
Example:
In 2021, retail traders coordinated via online platforms like Reddit’s r/WallStreetBets to push stocks like GameStop (GME) dramatically higher. However, institutional hedge funds still held significant influence, with short positions and market-making abilities that shaped the ultimate outcomes.
4. Access to Resources and Information
Retail Traders
Retail traders are limited by:
Smaller research budgets
Dependence on publicly available news and analysis
Standard trading tools provided by brokers
Despite these limitations, technological advancements have empowered retail traders with:
Real-time market data
Technical analysis software
Community-driven insights through social media and forums
Institutional Traders
Institutional traders enjoy extensive resources:
Proprietary research teams analyzing market fundamentals and technical indicators
Real-time news feeds and analytics (e.g., Bloomberg Terminal, Refinitiv)
Advanced trading algorithms for high-frequency and quantitative strategies
Access to dark pools for executing large trades without moving market prices visibly
This resource gap often gives institutional traders a significant edge in identifying opportunities and managing risk.
5. Trading Strategies
Retail Trading Strategies
Retail traders typically rely on:
Technical analysis: Using charts, indicators, and patterns to predict price movements.
Fundamental analysis: Evaluating company earnings, balance sheets, and macroeconomic data.
Momentum trading: Riding trends in popular stocks or sectors.
Swing trading: Capturing medium-term price fluctuations.
Scalping: Executing frequent, small-profit trades during intraday market movements.
Retail traders may also follow copy trading or social trading platforms to mimic strategies of more experienced traders.
Institutional Trading Strategies
Institutional traders employ advanced strategies, often inaccessible to retail traders:
Arbitrage: Exploiting price differences across markets or securities.
Algorithmic trading: Automated execution of trades based on complex models.
High-frequency trading (HFT): Making thousands of trades per second to exploit tiny price differentials.
Hedging and derivatives strategies: Using options, futures, and swaps to mitigate risk or leverage positions.
Portfolio optimization: Balancing risk and returns across a massive portfolio of assets.
Block trades: Executing large-volume trades to minimize market impact.
Institutional strategies often rely on risk management systems and liquidity analysis, which are generally beyond the reach of individual traders.
6. Costs and Fees
Retail traders face:
Broker commissions
Exchange fees
Bid-ask spreads (cost of buying at the ask and selling at the bid)
Taxes and capital gains liabilities
Institutional traders benefit from:
Lower per-trade costs due to bulk negotiations
Reduced spreads through direct market access
Sophisticated tax optimization strategies
Lower funding costs for leveraged positions
This cost advantage allows institutional traders to execute high-volume strategies that would be inefficient or prohibitively expensive for retail participants.
7. Risk Exposure and Management
Retail traders:
Often face higher relative risk due to smaller portfolios
May lack advanced risk management tools
Can be significantly affected by market volatility
Are more susceptible to emotional trading and behavioral biases
Institutional traders:
Implement risk management frameworks using Value at Risk (VaR), stress testing, and hedging
Diversify across asset classes and geographies
Can absorb short-term losses due to long-term investment horizons
Manage liquidity risk, counterparty risk, and operational risk
8. Regulatory Environment
Both retail and institutional traders are subject to regulatory oversight, though the rules differ:
Retail traders are primarily governed by rules protecting investors, such as mandatory disclosures, anti-fraud regulations, and investor education requirements.
Institutional traders face stricter compliance, including capital adequacy requirements, reporting large trades, insider trading laws, and fiduciary duties toward clients.
Regulators monitor institutional trading more closely due to the potential systemic impact of large trades.
9. Advantages and Disadvantages
Retail Trading
Advantages:
Flexibility to choose strategies and trading styles
Ability to invest based on personal goals
Lower minimum capital requirements
Freedom from complex reporting obligations
Disadvantages:
Limited access to advanced tools and research
Higher relative costs
Greater exposure to behavioral biases
Smaller influence on market trends
Institutional Trading
Advantages:
Access to advanced research, data, and technology
Lower costs per trade and favorable execution
Ability to execute large-volume trades
Professional risk management systems
Disadvantages:
Highly regulated, limiting some strategies
High operational costs
Market impact of large trades can be a challenge
Subject to public scrutiny and fiduciary obligations
10. Impact on Market Dynamics
Retail and institutional traders interact in ways that shape markets:
Liquidity: Institutions provide deep liquidity, allowing retail traders to enter and exit positions efficiently.
Volatility: Retail traders can sometimes cause short-term volatility, particularly in thinly traded stocks, while institutional trades generally smooth price movements due to hedging and diversification.
Price Discovery: Institutional traders often lead in establishing fair market value due to superior research, but retail sentiment can temporarily influence pricing.
Innovation: Retail traders increasingly adopt online platforms and community-driven insights, influencing how institutions engage with markets.
11. The Evolving Relationship
The line between retail and institutional trading is blurring:
Retail democratization: Platforms like Robinhood, Zerodha, and eToro give retail traders access to markets and tools once exclusive to institutions.
Institutional retail influence: Institutions now monitor social media trends, sentiment analysis, and retail behavior to anticipate market movements.
Hybrid strategies: Some individuals participate in institutional-style strategies via ETFs, mutual funds, or algorithmic trading platforms.
12. Conclusion
The distinction between retail and institutional trading lies in capital, resources, access, strategy, and market influence. Retail traders represent the individual investor, motivated by personal goals and operating with smaller capital and fewer resources. Institutional traders are professional, resource-rich, and wield considerable influence on market dynamics.
Despite these differences, both groups coexist symbiotically. Retail traders benefit from institutional liquidity and price efficiency, while institutions monitor retail trends to gauge sentiment. Technological advancements continue to narrow the gap, offering retail traders tools and opportunities that were once the exclusive domain of institutions. Understanding these differences is crucial for developing effective trading strategies, managing risks, and navigating financial markets successfully.
In summary, retail and institutional trading are distinct yet interconnected parts of the financial ecosystem. Their differences shape market behavior, risk profiles, and opportunities, making financial markets both dynamic and inclusive.
How Professional Traders Trade Smartly Introduction
Professional traders operate in highly competitive and dynamic markets, where success requires a combination of technical expertise, psychological discipline, risk management, and continuous learning. Unlike casual or retail traders, pros approach trading systematically, treating it as a business rather than a hobby. Their strategies focus not just on making profits but on preserving capital, optimizing risk-adjusted returns, and adapting to ever-changing market conditions. This essay explores how professional traders trade smartly and grow their trading business.
1. Developing a Strong Trading Mindset
The foundation of professional trading lies in psychology. Market behavior is often unpredictable, driven by collective human emotions such as fear, greed, and uncertainty. Pro traders cultivate a mindset that allows them to stay rational and disciplined even in volatile conditions.
Emotional Discipline: Professionals avoid impulsive decisions. They follow their trading plan strictly, resisting the temptation to chase losses or over-leverage positions.
Patience and Consistency: They understand that profitable trades come from patience, waiting for high-probability setups rather than forcing trades.
Acceptance of Losses: Losses are inevitable. Pros treat them as a cost of doing business and focus on minimizing them rather than trying to eliminate them entirely.
2. Comprehensive Market Knowledge
Professional traders have deep knowledge of the markets they trade in, whether equities, commodities, forex, or crypto.
Market Structure Awareness: They understand order flows, liquidity zones, support and resistance levels, and macroeconomic factors influencing prices.
Asset-Specific Knowledge: A trader specializing in tech stocks, for instance, studies earnings reports, industry trends, and regulatory impacts.
Global Economic Awareness: Professionals track global news, monetary policies, geopolitical events, and market correlations that can affect their trades.
This deep understanding enables them to make informed decisions and anticipate market movements rather than reacting blindly.
3. Strategic and Technical Approach
Professional traders rely on structured strategies to increase their probability of success.
Technical Analysis: They use charts, patterns, indicators, and volume analysis to identify entry and exit points. Tools like moving averages, RSI, MACD, and Fibonacci retracements help in precise decision-making.
Fundamental Analysis: Long-term traders evaluate financial statements, economic indicators, and company performance to assess the intrinsic value of assets.
Algorithmic and Quantitative Strategies: Some professionals leverage algorithmic trading and quantitative models to automate trades, reduce emotional bias, and exploit market inefficiencies.
Diversification of Strategies: Pros rarely depend on one strategy. They maintain multiple strategies suitable for trending, range-bound, or volatile markets.
4. Risk Management Mastery
Risk management separates successful traders from amateurs. Professionals prioritize capital preservation over chasing high returns.
Position Sizing: They calculate the exact size of each trade to ensure no single loss can drastically affect their portfolio.
Stop-Loss and Take-Profit Orders: Smart traders define exit points before entering a trade, ensuring losses are limited and profits are systematically captured.
Risk-Reward Ratios: They target trades with favorable risk-reward ratios (e.g., risking $1 to gain $3), improving long-term profitability.
Hedging: Advanced traders use options, futures, or other instruments to hedge positions against market volatility.
Effective risk management allows them to survive losing streaks and remain consistent over time.
5. Technology and Tools Utilization
Professional traders leverage modern technology to enhance decision-making and execution efficiency.
Trading Platforms: High-speed platforms provide real-time data, charting tools, and fast execution capabilities.
Market Scanners: Tools to identify trade setups based on pre-defined criteria save time and increase efficiency.
News Feeds and Economic Calendars: Real-time news helps traders react to events before the market fully adjusts.
Backtesting Software: Professionals test strategies on historical data to evaluate performance before committing real money.
6. Continuous Learning and Adaptation
Financial markets are dynamic, requiring traders to adapt constantly.
Learning from Past Trades: They maintain trading journals, reviewing winning and losing trades to identify patterns, mistakes, and improvements.
Education: Pro traders invest in courses, mentorship, and seminars to stay updated with new strategies and market trends.
Adapting Strategies: When market conditions change (e.g., low volatility, high inflation, or geopolitical uncertainty), professional traders adjust their strategies to remain profitable.
7. Networking and Market Intelligence
Trading is not only about charts; it’s also about information.
Professional Networks: Pros connect with other traders, analysts, and mentors to exchange ideas and insights.
Market Sentiment Analysis: Understanding crowd psychology and institutional behavior allows professionals to anticipate major market moves.
Information Advantage: Being aware of earnings reports, policy changes, or macroeconomic data before the market reacts can provide an edge.
8. Building Capital and Growing Professionally
Smart trading is also about business growth, not just trading skill.
Compounding Gains: Profits are reinvested systematically, using compounding to grow capital over time.
Scaling Trading Strategies: Successful strategies are scaled gradually to handle larger capital without increasing risk disproportionately.
Diversifying Income Streams: Professionals may expand into multiple markets, asset classes, or even start advisory services.
Brand and Reputation: Long-term success allows pros to manage external funds, run hedge funds, or attract institutional clients.
9. Avoiding Common Pitfalls
Professional traders are aware of mistakes that can destroy accounts.
Overtrading: Trading too frequently or with excessive leverage reduces profitability.
Emotional Biases: Greed, fear, overconfidence, and revenge trading are avoided through discipline and pre-defined rules.
Following the Crowd Blindly: Pros make independent decisions based on data, not hype or rumors.
Ignoring Risk Management: Even a few careless trades without proper stops can offset months of gains.
10. Case Studies of Professional Trading
Examining successful traders provides insight into smart trading practices.
Paul Tudor Jones: Focused on macroeconomic trends and disciplined risk management.
George Soros: Known for his speculative strategies with clear exit plans and risk control.
Ed Seykota: Advocated trend-following and strict discipline in trading systems.
Modern Algo Traders: Use high-frequency algorithms to capture small inefficiencies across multiple markets, showing how technology amplifies traditional strategies.
These examples highlight that consistent success comes from discipline, intelligence, and adaptation rather than luck.
Conclusion
Professional traders succeed by combining knowledge, strategy, psychology, risk management, and technology. They treat trading as a disciplined business, not a gamble, focusing on capital preservation, high-probability setups, and long-term growth. Through continuous learning, adaptation, and networking, they stay ahead in competitive markets. Smart trading is thus a blend of science and art—where skill, patience, and discipline turn opportunities into sustainable profits. By leveraging these practices, traders can steadily grow both their capital and professional stature, building a resilient and profitable trading career.
Trading Volume Spiking: Understanding Market Dynamics1. Causes of Trading Volume Spikes
Trading volume spikes are generally triggered by market-moving events, investor psychology, or technical market dynamics. These causes can be grouped into several categories:
a) Fundamental News Events
Fundamental news is one of the primary reasons for sudden spikes in trading volume. Market participants react to new information about a company, industry, or economy, leading to increased buying and selling activity. Key examples include:
Earnings Reports: When a publicly traded company releases quarterly or annual earnings, deviations from market expectations can trigger heavy trading. A strong earnings beat may cause buying volume to surge, while disappointing earnings can provoke panic selling.
Corporate Announcements: Mergers, acquisitions, dividends, or stock splits can trigger spikes as traders adjust positions based on anticipated impacts.
Economic Data Releases: Broader economic indicators such as unemployment rates, GDP growth, or inflation numbers can impact trading volume across sectors.
Policy Changes: Central bank rate announcements, government regulations, or geopolitical developments can also induce sudden spikes.
b) Technical Triggers
Many traders rely on technical analysis, using charts, indicators, and historical price patterns to make decisions. Certain price movements or indicator signals often trigger high-volume trades:
Breakouts and Breakdowns: When the price breaks through significant resistance or support levels, it often triggers a rush of orders from both retail and institutional traders.
Moving Averages and Indicators: Crossing key technical levels, such as the 50-day or 200-day moving average, can prompt automated or algorithmic trading to enter or exit positions.
Volume Confirmation Signals: Traders often look for volume spikes as confirmation of trend strength. A price move accompanied by unusually high volume is considered more reliable.
c) Market Sentiment and Psychology
Human behavior plays a large role in volume spikes. Fear, greed, and herd behavior can amplify trading activity:
Panic Selling or Buying Frenzy: Market participants may act collectively during periods of fear or exuberance, creating sudden surges in volume.
Speculation and Rumors: Even unverified news or market rumors can prompt significant spikes, as traders try to capitalize on potential opportunities.
d) Algorithmic and High-Frequency Trading
Modern markets are heavily influenced by algorithmic trading, which can amplify volume spikes. High-frequency trading (HFT) algorithms react in milliseconds to market signals, leading to bursts of buying or selling activity that may not reflect fundamental changes.
2. Interpreting Trading Volume Spikes
Volume spikes are not merely numerical anomalies; they carry deep implications for market participants. Understanding what a volume spike signifies is crucial for strategy development.
a) Confirmation of Price Movement
A spike in volume often confirms the strength of a price movement. For example:
A price surge with high volume indicates strong buying interest, suggesting the uptrend may continue.
Conversely, a price drop with high volume reflects strong selling pressure and can indicate a genuine downtrend.
Without significant volume, price movements may lack conviction and can be more prone to reversals.
b) Potential Trend Reversals
While high volume can confirm trends, extreme spikes can sometimes indicate trend exhaustion:
A rapid surge in volume after a prolonged price move may suggest that the market is overextended.
In some cases, this leads to a reversal, as traders take profits and new participants step in to bet against the trend.
c) Liquidity Insights
Volume spikes provide insight into market liquidity:
Higher volume generally improves liquidity, allowing larger trades to execute without significant price slippage.
Low volume during a spike, however, may indicate market thinness and volatility, making it riskier to trade large positions.
d) Institutional Activity
Unusually high volume often reflects institutional participation, such as hedge funds, mutual funds, or pension funds entering or exiting positions. These large trades can significantly influence price levels, especially in less liquid stocks.
3. Strategies for Traders During Volume Spikes
Traders and investors can use volume spikes strategically. Here are key approaches:
a) Momentum Trading
Momentum traders thrive on high-volume moves. A sudden increase in volume coupled with a breakout or breakdown can signal a strong directional trade opportunity. Traders often enter in the direction of the volume surge, expecting follow-through.
b) Volume-Based Confirmation
Technical analysts often use volume spikes as confirmation tools. For example:
Breakout Confirmation: A breakout above resistance accompanied by higher-than-average volume is more likely to sustain.
Trend Validation: Sustained trends confirmed by rising volume tend to be stronger and more reliable.
c) Contrarian Approach
Contrarian traders may interpret extreme volume spikes as signals of market exhaustion. After intense buying or selling, the market may be ripe for a pullback. This approach requires careful risk management.
d) Risk Management Adjustments
Volume spikes often coincide with higher volatility. Traders should adjust stop-loss levels, position sizes, and entry points to accommodate rapid price swings. Ignoring volume-related risk can result in significant losses.
4. Tools and Indicators for Monitoring Volume Spikes
Modern trading platforms provide a range of volume indicators to detect spikes and guide decisions:
Volume Bars: Basic histogram bars show volume per period and highlight anomalies relative to average volume.
On-Balance Volume (OBV): OBV measures cumulative buying and selling pressure, helping identify accumulation or distribution trends.
Volume Moving Averages: Traders often compare current volume against a 10-day or 20-day average to spot unusual spikes.
Volume-Price Trend (VPT): VPT combines volume and price changes to assess whether volume supports the direction of the trend.
These tools help traders distinguish between meaningful volume spikes and random market noise.
5. Case Studies of Trading Volume Spikes
Historical examples illustrate the significance of volume spikes:
Tech Stocks during Earnings Season: Companies like Apple or Microsoft often experience 3–5x average daily volume on earnings days, reflecting investor reaction to profits, guidance, or product announcements.
Market Crashes: During the 2020 COVID-19 market crash, trading volumes surged as investors panicked, providing liquidity but also amplifying volatility.
Cryptocurrency Market Events: Cryptocurrencies like Bitcoin often experience volume spikes during regulatory news or large institutional trades, resulting in rapid price swings.
6. Potential Pitfalls and Misinterpretations
While volume spikes are useful, traders must avoid over-reliance:
False Signals: Not all spikes indicate a trend continuation; some are caused by short-term speculative activity.
Thin Markets: Volume spikes in low-liquidity markets can exaggerate price moves and mislead traders.
Algorithmic Distortions: HFT can generate temporary spikes without any fundamental significance.
Proper analysis requires combining volume with other indicators such as price action, moving averages, and market news.
7. Conclusion
A trading volume spike is a key market signal reflecting a surge in trading activity, often triggered by fundamental events, technical movements, market sentiment, or institutional participation. For traders, volume spikes provide vital insights into the strength, liquidity, and sustainability of price movements. High volume confirms trends, signals potential reversals, and highlights institutional activity. However, spikes also bring risks due to higher volatility and potential market noise.
By integrating volume analysis into trading strategies, using technical indicators, and monitoring market news, traders can make more informed, strategic decisions. Whether you are a momentum trader, contrarian investor, or risk-conscious portfolio manager, understanding volume spikes is essential for navigating modern financial markets effectively.
Exploring Financial Market Types1. Money Market
The money market is a segment of the financial market that deals with short-term borrowing and lending of funds, usually with maturities of one year or less. It is primarily used by corporations, financial institutions, and governments to manage short-term liquidity needs.
Key Instruments in the Money Market:
Treasury Bills (T-Bills): Short-term debt instruments issued by governments to raise funds. They are considered risk-free and highly liquid.
Commercial Papers (CPs): Unsecured promissory notes issued by corporations to meet short-term funding needs. They generally have maturities ranging from a few days to nine months.
Certificates of Deposit (CDs): Time deposits issued by banks that pay a fixed interest upon maturity.
Repurchase Agreements (Repos): Short-term borrowing agreements where securities are sold and later repurchased at a predetermined price.
Functions:
Liquidity Management: Provides short-term funds to banks, corporations, and governments.
Efficient Allocation: Facilitates smooth functioning of the banking system.
Monetary Policy Transmission: Central banks use the money market to implement monetary policy through instruments like repos and T-bills.
The money market is characterized by low risk and relatively lower returns compared to long-term markets. Its efficiency ensures that the economy maintains liquidity and stability.
2. Capital Market
Capital markets deal with long-term funds, generally with maturities exceeding one year. They are crucial for economic growth as they enable corporations and governments to raise funds for investments in infrastructure, expansion, and other productive activities. Capital markets are broadly divided into primary markets and secondary markets.
a. Primary Market:
Also known as the new issue market, it is where new securities are issued and sold to investors.
Initial Public Offerings (IPOs): Companies raise equity by offering shares to the public for the first time.
Bond Issuance: Governments and corporations raise debt funds by issuing bonds.
b. Secondary Market:
Once securities are issued in the primary market, they are traded in the secondary market. Examples include stock exchanges like the New York Stock Exchange (NYSE), NASDAQ, and Bombay Stock Exchange (BSE).
Functions of Capital Markets:
Capital Formation: Enables businesses to raise funds for long-term growth.
Investment Opportunities: Provides a platform for individuals and institutions to invest their savings in productive assets.
Price Discovery: Helps determine the market value of securities through supply-demand dynamics.
Liquidity: Secondary markets allow investors to buy and sell securities easily, ensuring liquidity.
Participants in Capital Markets:
Retail investors
Institutional investors (mutual funds, pension funds)
Investment banks and brokers
Regulatory authorities (SEBI, SEC)
Capital markets are more volatile than money markets but offer higher potential returns due to the long-term nature of investments.
3. Derivative Markets
Derivative markets are financial markets where instruments derived from underlying assets are traded. The underlying assets can include stocks, bonds, currencies, commodities, or market indices. Common derivatives include futures, options, forwards, and swaps.
Purpose of Derivatives:
Hedging: Investors use derivatives to manage or mitigate risk associated with price fluctuations.
Speculation: Traders aim to profit from price movements in the underlying asset.
Arbitrage: Derivatives allow traders to exploit price differences across markets.
Types of Derivative Instruments:
Futures: Contracts obligating the purchase or sale of an asset at a predetermined price on a specific future date.
Options: Contracts that give the buyer the right, but not the obligation, to buy or sell an asset at a set price within a certain period.
Forwards: Customized contracts between two parties to buy or sell an asset at a specified future date and price.
Swaps: Agreements to exchange cash flows or other financial instruments between parties.
Derivative markets play a vital role in financial risk management but are complex and may involve significant leverage, making them riskier than money or capital markets.
4. Foreign Exchange Market (Forex)
The foreign exchange market, or Forex, is where currencies are bought and sold. It is the largest financial market globally, with trillions of dollars traded daily. Forex facilitates international trade, investment, and tourism by providing liquidity in different currencies.
Key Features:
Decentralized Market: Operates 24/7 without a central exchange.
Participants: Banks, corporations, central banks, hedge funds, and retail traders.
Major Instruments: Spot transactions, forwards, futures, and options in currencies.
Functions:
Currency Conversion: Enables businesses to transact internationally.
Hedging Exchange Rate Risk: Companies can hedge against fluctuations in currency values.
Speculation: Traders profit from currency movements.
Global Liquidity: Supports global trade and investment flows.
The Forex market is highly liquid and volatile, influenced by macroeconomic factors, geopolitical events, and central bank policies.
5. Commodity Markets
Commodity markets are where raw materials and primary products are traded. These markets include energy, metals, and agricultural commodities. Trading can occur through physical markets or financial instruments such as futures and options.
Types of Commodities:
Agricultural Products: Wheat, rice, coffee, sugar.
Metals: Gold, silver, copper, platinum.
Energy: Crude oil, natural gas, coal.
Functions of Commodity Markets:
Price Discovery: Determines the fair market value of commodities through supply and demand.
Risk Management: Producers and consumers hedge against price volatility.
Investment Opportunities: Investors diversify portfolios by including commodities.
Economic Indicator: Commodity prices reflect economic trends and inflation expectations.
Commodity markets can be highly volatile due to weather conditions, geopolitical events, and global demand-supply dynamics.
6. Other Financial Market Segments
In addition to the major market types, several specialized financial markets exist:
Insurance Market: Provides risk management solutions against unforeseen events.
Pension Funds Market: Manages retirement savings and invests in long-term securities.
Credit Market: Focuses on lending and borrowing of debt instruments.
Venture Capital and Private Equity Markets: Provides funding to startups and private companies.
These specialized markets complement traditional markets by addressing specific financial needs and enhancing overall market efficiency.
Conclusion
Financial markets are diverse, dynamic, and interconnected. They are crucial for economic growth, providing platforms for capital formation, liquidity, risk management, and investment. Each market type—money, capital, derivatives, forex, and commodities—serves unique functions and caters to different investor needs. Participants range from retail investors to multinational corporations and central banks, collectively shaping the global financial ecosystem. Understanding these markets enables investors, policymakers, and businesses to make informed decisions, manage risks effectively, and optimize returns. As the world becomes increasingly globalized and technologically driven, financial markets continue to evolve, creating new opportunities and challenges in the pursuit of economic growth and financial stability.
How to Grow Your Business in the Trading Market1. Understanding the Trading Market Landscape
Before attempting to grow a trading business, it is crucial to understand the market dynamics. The trading market operates in a global ecosystem influenced by economic trends, geopolitical events, corporate performance, and investor sentiment. Key segments include:
Equities (Stocks): Companies raise capital through stock markets, offering investors a chance to participate in profits.
Commodities: Trading in raw materials such as gold, oil, and agricultural products, which are highly sensitive to global supply and demand.
Forex: The largest and most liquid market, involving currency pairs, influenced by interest rates, inflation, and macroeconomic data.
Derivatives: Financial contracts such as options and futures that derive value from underlying assets, useful for hedging and speculation.
Cryptocurrencies: Emerging digital assets driven by decentralized technologies, regulatory uncertainty, and market volatility.
Understanding these market segments allows a business to identify opportunities, anticipate trends, and tailor its offerings.
2. Establishing a Clear Business Model
Growth begins with a well-defined business model. There are several models in the trading sector:
Brokerage Services: Acting as intermediaries between buyers and sellers, earning through commissions or spreads.
Trading Platforms/Software: Providing technology infrastructure for traders, including analytics, charts, and automated trading systems.
Investment Advisory: Offering research, insights, and portfolio management services for retail or institutional clients.
Proprietary Trading: Using internal capital to trade, aiming to generate profits directly rather than earning commissions.
Choosing the right model depends on resources, expertise, and target clientele. Many successful businesses combine models, for instance, offering a trading platform along with educational and advisory services.
3. Building a Strong Technological Infrastructure
In modern trading, technology is a critical enabler of growth. Key technological elements include:
Trading Platforms: A reliable, fast, and secure platform attracts and retains clients. It should support multiple asset classes, real-time data, and customizable interfaces.
Algorithmic Trading: Automated strategies using algorithms can optimize execution, reduce human error, and handle large volumes efficiently.
Data Analytics: Access to market data and predictive analytics helps in decision-making, risk management, and personalized client services.
Mobile Access: With the rise of retail trading, mobile-friendly platforms ensure clients can trade anytime, anywhere, boosting engagement and revenue.
Investment in technology not only enhances operational efficiency but also differentiates a business in a highly competitive market.
4. Risk Management and Compliance
Trading inherently involves risk, and sustainable growth requires robust risk management practices:
Financial Risk: Hedging strategies, stop-loss orders, and portfolio diversification minimize losses.
Operational Risk: Internal processes, cybersecurity measures, and reliable infrastructure prevent disruptions.
Regulatory Compliance: Adhering to local and international regulations is critical. Non-compliance can result in fines, reputational damage, or license revocation.
Client Protection: Ensuring transparent policies, segregated accounts, and secure transactions builds trust and long-term client loyalty.
A business that prioritizes risk management gains credibility and positions itself as a trusted market participant.
5. Marketing and Client Acquisition
Growth in trading relies heavily on attracting and retaining clients. Effective strategies include:
Digital Marketing: SEO, social media, and content marketing can generate leads and enhance brand visibility.
Educational Programs: Hosting webinars, workshops, and tutorials not only educates potential clients but also establishes authority in the field.
Referral Programs: Incentivizing existing clients to refer new users accelerates growth organically.
Partnerships: Collaborations with financial influencers, fintech firms, or institutional investors expand reach and credibility.
Customer Experience: Seamless onboarding, responsive support, and intuitive interfaces improve client retention and lifetime value.
In a saturated market, marketing combined with trust-building is a key differentiator.
6. Diversification of Products and Services
Relying on a single revenue source can limit growth. Diversifying offerings allows businesses to tap into multiple market segments:
New Asset Classes: Expanding from stocks to derivatives, commodities, or crypto attracts a wider audience.
Portfolio Management: Offering managed accounts or robo-advisory services caters to clients seeking convenience.
Research and Insights: Subscription-based research reports, trading signals, or educational content create additional revenue streams.
Margin and Leverage Services: For experienced traders, providing margin trading enhances engagement and profitability.
Diversification mitigates risk while opening new channels for revenue generation.
7. Leveraging Strategic Partnerships and Networking
Networking and partnerships play a crucial role in scaling a trading business:
Institutional Partnerships: Collaborating with banks, funds, or brokerage houses provides access to large client bases and advanced trading infrastructure.
Technology Vendors: Partnerships with tech providers ensure the platform remains competitive and secure.
Educational Institutions: Partnering with universities and financial schools can attract aspiring traders and interns.
Global Expansion: Strategic alliances in other countries enable entry into new markets while navigating regulatory challenges.
Building a strong network creates opportunities for business growth and market penetration.
8. Continuous Learning and Market Adaptation
The trading market is dynamic, with constant technological, regulatory, and behavioral changes. Successful businesses embrace continuous learning:
Market Trends: Monitoring global economic indicators, industry reports, and emerging sectors helps anticipate opportunities.
Technological Innovation: Adopting blockchain, AI-driven analytics, and machine learning can improve trading performance and operational efficiency.
Customer Feedback: Understanding client needs, pain points, and preferences allows iterative improvements.
Competitor Analysis: Observing competitors’ strategies ensures the business remains competitive and innovative.
Adaptability is essential; firms that fail to evolve risk obsolescence.
9. Branding and Reputation Management
In trading, trust is currency. A strong brand communicates reliability and expertise:
Transparency: Open communication about fees, risks, and performance builds credibility.
Corporate Social Responsibility: Ethical trading, community engagement, and sustainable practices enhance reputation.
Thought Leadership: Publishing market analysis, insights, and white papers positions the firm as an industry authority.
Client Testimonials and Case Studies: Showcasing success stories reinforces trust and attracts new clients.
A reputable brand fosters loyalty, encourages referrals, and differentiates a business from competitors.
10. Scaling Operations Efficiently
Finally, as the business grows, operational efficiency ensures sustainability:
Automated Processes: Automating back-office operations, trade reconciliation, and reporting reduces costs.
Talent Acquisition: Hiring skilled traders, analysts, and technology experts strengthens core capabilities.
Scalable Infrastructure: Cloud-based systems and modular platforms accommodate growth without major overhauls.
Performance Metrics: Monitoring KPIs such as client acquisition cost, trading volume, and retention rate helps identify improvement areas.
Efficient scaling transforms incremental growth into long-term success.
Conclusion
Growing a business in the trading market requires a multifaceted approach combining strategy, technology, risk management, marketing, and operational excellence. Understanding market dynamics, building a robust platform, diversifying offerings, and prioritizing client trust are fundamental steps. Strategic partnerships, continuous learning, and reputation management further accelerate growth. By implementing these strategies thoughtfully and consistently, a trading business can not only survive but thrive in the competitive and ever-evolving financial markets.
In essence, growth in the trading market is not just about making profits—it is about creating a sustainable, innovative, and trusted ecosystem that adapts to change, attracts clients, and leverages technology effectively. Those who succeed are the ones who balance strategic foresight with operational discipline, constantly evolving to meet the demands of a dynamic global market.
Crypto Assets Secrets: The Hidden Dynamics of Digital WealthIntroduction
Over the past decade, crypto assets have transformed from a fringe experiment in digital money into a multitrillion-dollar financial ecosystem that challenges the traditional boundaries of economics, finance, and technology. Bitcoin’s mysterious emergence in 2009 under the pseudonym Satoshi Nakamoto sparked a global phenomenon, laying the foundation for an entirely new asset class known as crypto assets or digital assets. While the world has widely discussed cryptocurrencies like Bitcoin and Ethereum, the secrets behind crypto assets—how they derive value, operate, and influence financial systems—remain misunderstood by many.
This essay unveils the hidden dimensions of crypto assets, exploring their technological foundations, economic mechanisms, market dynamics, investment secrets, and the strategic shifts they are inducing in global finance.
1. Understanding Crypto Assets
A crypto asset is a digital representation of value that operates on blockchain technology and uses cryptography for security, verification, and transaction validation. Unlike fiat currencies, crypto assets are decentralized, meaning they are not issued or controlled by central banks or governments. They rely instead on distributed networks of computers (nodes) that collectively maintain the integrity of the ledger.
Crypto assets can be broadly divided into three main categories:
Cryptocurrencies – digital currencies used primarily as a medium of exchange (e.g., Bitcoin, Litecoin).
Utility tokens – tokens granting access to services within blockchain ecosystems (e.g., Ethereum’s ETH for gas fees).
Security and asset-backed tokens – representing ownership or rights to assets like equity, real estate, or commodities (e.g., tokenized stocks or gold).
Behind these classifications lies a deeper secret: the tokenization of value. Blockchain allows almost any form of asset—tangible or intangible—to be represented, traded, and fractionalized digitally, unlocking unprecedented liquidity and accessibility in global finance.
2. The Secret of Blockchain Technology
At the heart of every crypto asset lies blockchain technology, a decentralized digital ledger that records transactions in immutable “blocks.” The blockchain’s transparency, security, and decentralization are its core strengths.
The secret behind blockchain’s power is its consensus mechanism—the process by which distributed participants agree on the state of the ledger. Common mechanisms include:
Proof of Work (PoW) – miners solve complex mathematical puzzles to validate transactions (used by Bitcoin).
Proof of Stake (PoS) – validators lock up coins (“stake”) to earn the right to confirm transactions (used by Ethereum 2.0).
Delegated Proof of Stake (DPoS) and Proof of Authority (PoA) – more energy-efficient models emphasizing speed and scalability.
These consensus methods ensure that no single entity can alter records, creating a trustless system where integrity is mathematically guaranteed rather than institutionally enforced. This underpins the revolutionary concept of decentralized trust, which is one of the most powerful secrets of crypto assets.
3. Value Creation and Scarcity: The Economic Secret
Traditional assets derive value from underlying cash flows, commodities, or sovereign guarantees. Crypto assets, however, derive value from mathematical scarcity and network utility.
For example, Bitcoin’s total supply is capped at 21 million coins, making it a deflationary asset. This digital scarcity mimics the rarity of gold, positioning Bitcoin as “digital gold” and a hedge against inflation. Ethereum’s value, meanwhile, stems from its programmable utility—its blockchain powers thousands of decentralized applications (dApps) and smart contracts.
The economic secret is that crypto assets merge scarcity with utility. A token that is both scarce and useful tends to appreciate in value as network adoption grows—a phenomenon described by Metcalfe’s Law, which states that the value of a network is proportional to the square of its number of users.
4. The Secret Power of Decentralization
One of the most revolutionary aspects of crypto assets is decentralization—the removal of intermediaries like banks, brokers, or governments. In decentralized finance (DeFi), users can lend, borrow, trade, or invest directly using smart contracts without third-party oversight.
This system operates 24/7, globally, with transparent and automated processes. The secret advantage of decentralization is permissionless innovation: anyone can build or access financial services without seeking institutional approval. This democratizes finance and opens opportunities to billions of unbanked individuals worldwide.
However, decentralization comes with challenges—governance disputes, code vulnerabilities, and regulatory uncertainty—which form part of the hidden risks behind the promise of crypto wealth.
5. Crypto Market Dynamics: Secrets of Volatility and Manipulation
Crypto markets are notoriously volatile. Prices can rise or fall by double digits in a single day. This volatility is often misunderstood as pure speculation, but it also reflects deeper structural characteristics:
Low liquidity compared to traditional markets.
High leverage in derivatives and margin trading.
Whale activity—large holders who can manipulate prices.
News-driven sentiment amplified by social media and influencer culture.
A lesser-known secret is the role of algorithmic trading and market-making bots, which dominate exchanges and create rapid micro-fluctuations. Additionally, because crypto operates globally without a centralized regulator, price discovery is influenced by multiple fragmented exchanges.
To navigate this landscape, experienced investors rely on on-chain analysis, which examines blockchain data—wallet activity, token flows, and network metrics—to anticipate market trends beyond traditional charting methods.
6. Secrets of Crypto Investing and Portfolio Strategy
Successful crypto investing requires understanding not just price trends but fundamental blockchain metrics, including transaction volume, developer activity, tokenomics, and governance models.
Key strategies and their underlying “secrets” include:
HODLing – Long-term holding of high-conviction assets like Bitcoin or Ethereum, based on belief in their future dominance.
Staking – Earning passive income by locking coins to secure networks in PoS systems.
Yield farming – Lending or providing liquidity to DeFi protocols in exchange for rewards; highly profitable but risky.
NFT and metaverse investing – Speculating on digital ownership and virtual real estate.
Diversification – Allocating across blockchains, stablecoins, and DeFi projects to mitigate volatility.
Another secret is tokenomics, the economic design of a crypto project—how tokens are distributed, used, burned, or minted. Projects with transparent, sustainable tokenomics tend to outperform those with inflationary or centralized token supplies.
7. Hidden Risks and Security Secrets
While the crypto revolution promises freedom and profits, it hides complex security risks. Common vulnerabilities include:
Exchange hacks – centralized platforms holding billions in user assets are frequent targets.
Smart contract exploits – coding bugs that allow attackers to drain funds.
Phishing and social engineering – scams exploiting user ignorance or greed.
Private key loss – once lost, access to crypto wallets is permanently gone.
The security secret lies in self-custody—owning and protecting private keys through hardware wallets and multi-signature security models. Decentralized exchanges (DEXs) also enhance safety by allowing users to retain control of their assets during trading.
Another layer of defense is zero-knowledge proofs (ZKPs), a cryptographic innovation enabling transactions to be verified without revealing sensitive data. This technology is paving the way for privacy-preserving and scalable blockchains.
8. The Regulatory Secret: Balancing Innovation and Control
Governments worldwide are grappling with how to regulate crypto assets. The tension lies between fostering innovation and preventing financial crimes like money laundering or tax evasion.
The secret insight is that regulation is inevitable but potentially beneficial. Clear frameworks attract institutional investors who previously avoided crypto due to legal uncertainty. Countries like Singapore, Switzerland, and the UAE have leveraged crypto-friendly regulations to become global blockchain hubs.
Meanwhile, central banks are experimenting with Central Bank Digital Currencies (CBDCs)—state-issued digital currencies that adopt blockchain principles without decentralization. This reveals a paradoxical secret: the technology that began as a rebellion against centralization may ultimately reshape central banking itself.
9. The Institutional and Technological Shift
The entry of institutional players—hedge funds, asset managers, and public corporations—marks a new phase in crypto maturity. Companies like MicroStrategy, Tesla, and BlackRock have integrated Bitcoin into their balance sheets or fund offerings. This institutional endorsement signals that crypto is evolving from speculative trading to a legitimate asset class.
Behind the scenes, major innovations such as layer-2 scaling, interoperability protocols (Polkadot, Cosmos), and tokenized real-world assets (RWA) are redefining the boundaries of blockchain utility. These technologies aim to solve scalability bottlenecks and connect fragmented blockchains, enabling a seamless decentralized financial ecosystem.
The secret lesson here is convergence—the merging of traditional finance (TradFi) and decentralized finance (DeFi) into a hybrid model known as “CeDeFi”, where institutions adopt blockchain efficiencies while retaining regulatory compliance.
10. The Psychological Secret of Crypto Adoption
Crypto markets are not driven purely by technology—they are driven by belief and psychology. The phenomenon of community-driven growth, often seen in projects like Dogecoin or Shiba Inu, demonstrates how narratives and memes can mobilize collective sentiment into market capitalization worth billions.
The psychological secret lies in network belief—the idea that value in crypto is sustained by the confidence of its holders. When enough participants believe a token has worth, it self-validates through market demand. This blend of behavioral finance and digital community dynamics gives crypto its cultural power.
11. Environmental and Ethical Secrets
Critics argue that proof-of-work mining consumes enormous energy, raising concerns about sustainability. However, the hidden side of this debate is technological evolution. Newer blockchains are adopting energy-efficient consensus models, and Bitcoin mining is increasingly powered by renewable energy sources.
Moreover, the crypto industry is becoming a driver of green innovation—through tokenized carbon credits, renewable energy financing, and blockchain-based ESG tracking. Thus, the secret lies not in rejecting crypto’s environmental footprint but in harnessing it for sustainability solutions.
12. The Future Secrets of Crypto Assets
The future of crypto assets will be shaped by several converging trends:
Tokenization of real-world assets – turning stocks, real estate, and commodities into blockchain tokens for global access.
AI-driven smart contracts – merging artificial intelligence with blockchain for self-optimizing systems.
Cross-chain interoperability – seamless transfer of assets across different networks.
Decentralized identity (DID) – enabling privacy-preserving authentication and digital citizenship.
Institutional-grade custody and compliance – bridging crypto with traditional finance infrastructure.
The deeper secret is that crypto assets represent more than an investment trend—they are the foundation of a new digital economy built on transparency, inclusivity, and programmable trust.
Conclusion
The secrets of crypto assets lie not in hidden codes or mysterious markets, but in the profound reimagining of how humans define, exchange, and secure value. From decentralized trust and mathematical scarcity to programmable finance and tokenized ownership, crypto assets are revolutionizing global systems at every level.
Yet, with this transformation comes both opportunity and responsibility. Understanding these secrets allows investors, policymakers, and technologists to participate wisely in shaping a future where financial power is distributed, transparent, and resilient. As blockchain innovation continues to unfold, the true secret may be this: crypto assets are not just changing finance—they are redefining the very architecture of trust in the digital age.
XAUUSD Forms a Cup and Handle PatternOANDA:XAUUSD has been steadily rising, maintaining strong and consistent upward momentum. If you’ve been following my previous analyses, you’ll notice a familiar pattern developing on the chart — the classic Cup and Handle formation.
Looking closer, the left side of the chart reveals a strong supply zone, forming the cup. Then, we see the market building a potential handle on the right, indicating that the price is accumulating strength for the next move.
Now, here’s where things get interesting: if buying pressure aligns with Dow Theory waves and the Fibonacci retracement levels at 0.786 and 0.618 hold steady, with the price breaking through the neckline, this setup could push gold to 4500 USD.
However, if selling pressure comes in stronger than expected, the pattern may fail, and we could see a price pullback.

#xuausd Make or Break - Gold Analysis🥇 GOLD (XAU/USD) - Technical Analysis & Outlook
Timeframe: 4H & Daily Charts
Current Price: 2,718.99
Market Structure Analysis
Gold is currently in a **strong uptrend** and will maintain its bullish bias until it forms a clear lower low. The recent consolidation near all-time highs suggests a potential for either continuation or a sideways movement phase.
Key Price Levels
Support Zones
- Immediate Support: 4,218.99 - 4,240.00
- Major Support: 4,185.91 (0 Fibonacci - Recent Low)
- Critical Support: 4,160.00 - 4,180.00 zone
Resistance Zones
- Immediate Resistance: 4,253.97 (Current High)
- Next Resistance: 4,280.00 - 4,300.00
- Target Extension: 4,320.00 - 4,360.00
- Major Target: 4,380.99 (Fibonacci Extension)
Technical Scenarios
- Continuation of the current uptrend expected
- Any pullback to support zones presents buying opportunities
- Target: 4,280 - 4,360 zone
- Extended Target: 4,380+ levels
Consolidation Scenario (Secondary)
Condition: Sideways movement similar to the 3,400 consolidation phase
- Gold may enter a ranging phase at current elevated levels
- Watch for sideways movement between 4,200 - 4,280
- Accumulation pattern before next leg up
- Patience required during this phase
🔴 Bearish Scenario (Alternative)
Condition: Only if price breaks and closes below 4,185
- Bearish only on confirmed break of structure
- Potential retracement to $4,160 or lower
- Wait for clear reversal signals before shorting
RSI Analysis (Daily Chart)
- RSI Position: Near trendline support (around 62)
- Signal: RSI holding above trendline support indicates continued bullish momentum
- Watch For: RSI breakdown below trendline would signal weakening momentum
- Strength: RSI still in bullish territory, no divergence observed
Key Observations
1. **Strong Uptrend Intact:** No lower lows formed yet, trend remains bullish
2. **Fibonacci Levels:** Price respecting key Fibonacci retracement zones
3. **Consolidation Pattern:** Similar behavior to previous $3,400 consolidation
4. **Volume Profile:** Accumulation visible near support zones
5. **Daily RSI:** Holding trendline support, maintaining bullish structure
Critical Points to Monitor
🔸 22/10/2025 Close: Will provide clearer direction
🔸 Support Level: 4,218 - Must hold for bullish continuation
🔸 RSI Trendline: Break would signal momentum shift
🔸 Volume: Watch for increasing volume on moves
🔸 Global Events: Fed policy, geopolitical tensions, USD strength
🎓 #Trading Wisdom
"The #trend is your friend until it bends. #Gold will remain #bullish until it makes a #lowerlow. Stay patient, follow the structure, and let the market show its hand."*
Risk Disclaimer
This analysis is for educational purposes only and should not be considered financial advice. Always manage your risk appropriately, use stop losses, and never risk more than you can afford to lose. Past performance does not guarantee future results.
Like and Follow for Daily Gold Analysis!
#Gold #XAUUSD #GoldTrading #TechnicalAnalysis #ForexTrading #PreciousMetals #TradingView #MarketAnalysis
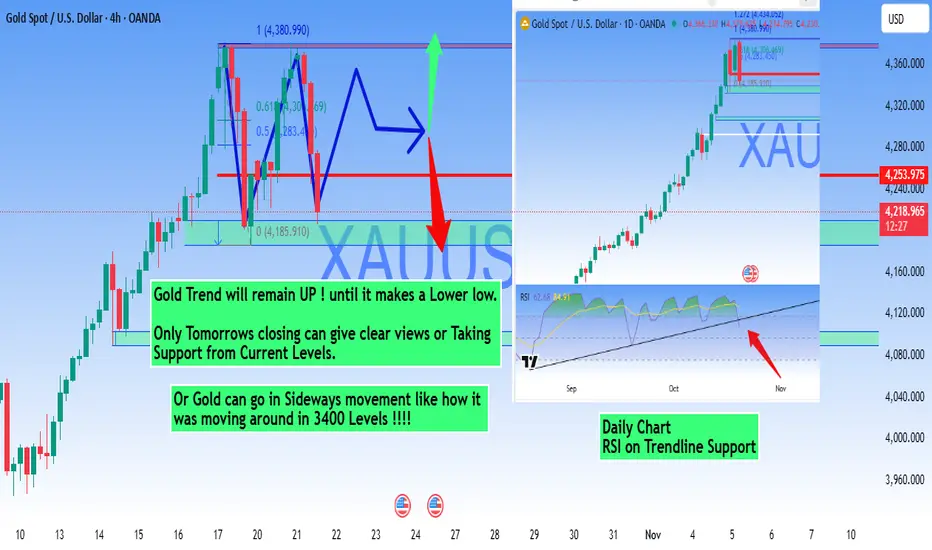
Divergence SecretsOption Greeks: Measuring Sensitivity
The Option Greeks are metrics that measure how different factors affect an option’s price. The key Greeks include:
Delta: Change in option price relative to the underlying asset’s price.
Theta: Time decay effect.
Vega: Sensitivity to volatility changes.
Gamma: Rate of change of Delta.
Rho: Sensitivity to interest rates.
These Greeks help traders understand risk exposure and manage positions scientifically. For example, a trader might use Theta to manage time decay in short-term options or Vega to hedge against volatility spikes. Mastery of Greeks is crucial for professional option traders who aim for consistency and precision.

Option Trading Leverage and Speculation in Option Trading
Options provide leverage, allowing traders to control large positions with small investments. For instance, buying a single call option can represent ownership of 100 shares, magnifying both profits and losses. Speculators use this leverage to capitalize on short-term market moves. However, leverage also increases risk—if the market moves against the position, the entire premium can be lost. Successful speculators use strict risk management, combining analysis of volatility, momentum, and time decay to optimize entries and e
