Part 1 Ride The Big Moves Part 1: Introduction to Option Trading
Option trading is a cornerstone of modern financial markets, offering traders and investors the flexibility to manage risk, speculate on price movements, and generate income. At its core, an option is a financial derivative—a contract that derives its value from an underlying asset, which can include stocks, indices, commodities, currencies, or ETFs. Unlike owning the underlying asset directly, an option provides the right—but not the obligation—to buy or sell that asset at a predetermined price within a specific time frame.
There are two primary types of options:
Call Options: Grant the buyer the right to purchase the underlying asset at a specific price, known as the strike price, before or on the option’s expiration date.
Put Options: Grant the buyer the right to sell the underlying asset at the strike price within a specified period.
The price paid to acquire an option is called the premium. This premium reflects the market’s perception of the likelihood that the option will end up profitable (in the money). Premiums are influenced by various factors, including the asset’s current price, strike price, time to expiration, volatility, interest rates, and dividends.
Option trading serves several purposes:
Hedging: Investors use options to protect existing positions against adverse price movements. For instance, owning put options can act as insurance against a decline in stock prices.
Speculation: Traders seeking profit from short-term price movements can leverage options to gain higher exposure with limited capital compared to buying the underlying asset outright.
Income Generation: Writing (selling) options allows investors to collect premiums, thereby generating income. Covered call strategies, for example, are widely used to earn consistent returns on long stock holdings.
Options differ from futures contracts in key ways. Futures obligate the buyer to purchase (or the seller to sell) the underlying asset at a future date, regardless of market conditions. Options, conversely, provide a choice without mandatory execution, giving traders more strategic flexibility. This asymmetry between risk and reward makes option trading unique and complex, requiring a strong grasp of market behavior, probability, and timing.
The evolution of option markets has been significant. Initially, options were traded over-the-counter (OTC), with bespoke contracts negotiated privately. With the establishment of standardized exchanges like the Chicago Board Options Exchange (CBOE) in 1973, options trading became more accessible, liquid, and regulated, paving the way for retail participation and complex strategies.
Part 2: Key Concepts and Terminologies
Understanding option trading requires familiarity with several fundamental concepts and terms:
Strike Price: The fixed price at which the underlying asset can be bought (call) or sold (put). It is central to determining whether an option is profitable at expiration.
Expiration Date: The date on which the option contract ceases to exist. Options are classified based on their lifespan:
Short-term options: Expire in days to weeks.
Long-term options: Also known as LEAPS, they can extend up to three years.
In the Money (ITM), At the Money (ATM), Out of the Money (OTM):
ITM: Option has intrinsic value (e.g., a call option’s strike price is below the current stock price).
ATM: Strike price equals the underlying asset’s current price.
OTM: Option lacks intrinsic value but may have time value.
Intrinsic and Extrinsic Value: Intrinsic value reflects the real, immediate value of an option (profit if exercised today). Extrinsic value is the premium over intrinsic value, factoring in time, volatility, and market conditions.
Volatility: A measure of price fluctuations of the underlying asset. Higher volatility increases option premiums due to greater potential for profit.
Option Greeks: These are critical tools to quantify risks and potential rewards:
Delta: Sensitivity of option price to changes in the underlying asset price.
Gamma: Rate of change of delta.
Theta: Time decay, or how an option’s value decreases as expiration nears.
Vega: Sensitivity to volatility changes.
Rho: Sensitivity to interest rate changes.
Additionally, American vs. European options is an important distinction. American options can be exercised anytime until expiration, whereas European options can only be exercised at expiration. While this sounds straightforward, it profoundly affects pricing and strategy.
Option contracts are standardized in terms of quantity, strike prices, and expiration cycles on exchanges. This standardization allows traders to combine options in sophisticated strategies such as spreads, straddles, and butterflies.
Contains image

Turning a Small Account into Big Gains1. Understanding the Reality of Small Accounts
1.1. Challenges of Small Accounts
Small accounts, typically under $10,000 (or equivalent in local currency), face specific hurdles:
Limited risk buffer: A few losing trades can quickly wipe out capital.
Higher transaction cost impact: Brokerage, slippage, and fees hit smaller accounts proportionally harder.
Psychological pressure: Each trade carries a heavier emotional load.
1.2. Advantages of Small Accounts
Flexibility: Small accounts can adapt faster than large ones in volatile markets.
Learning opportunity: Mistakes are less costly if proper risk control is applied.
High growth potential: With consistent strategy, small accounts can compound quickly.
2. Setting Realistic Goals
2.1. Understand Your Expectations
Small accounts cannot double overnight without extreme risk. Unrealistic expectations lead to impulsive trading and large drawdowns.
2.2. Focus on Percentage Gains, Not Absolute Gains
A small account should focus on achieving 1–3% gains per week rather than aiming for “make a fortune tomorrow” trades. For example, turning $1,000 into $1,500 over a few months is far more sustainable than risking 50% in one trade.
2.3. Define Clear Targets and Milestones
Break down goals into:
Daily: Small, achievable targets (e.g., 0.5–1% per day)
Weekly: Slightly larger accumulation targets (e.g., 2–3% per week)
Monthly: Milestones for compounding growth (e.g., 8–12% per month)
3. Choosing the Right Market and Instruments
3.1. High-Liquidity Markets
Small accounts benefit from trading instruments with high liquidity:
Stocks with high average volume
Futures contracts like Nifty, Bank Nifty, or E-mini S&P
Forex pairs with tight spreads
3.2. Avoid Illiquid or Exotic Instruments
Low-volume stocks or rare derivatives can spike unpredictably, which can wipe out small positions.
3.3. Leverage with Caution
Margin trading can amplify gains but also losses.
Use leverage sparingly. For small accounts, 2–3x leverage is generally safer than 10x or more.
4. Risk Management is Non-Negotiable
4.1. Position Sizing
Risk no more than 1–2% of your capital per trade.
For example, if you have $1,000, risk $10–$20 per trade. This protects you from catastrophic losses.
4.2. Stop Losses and Take Profits
Always use stop-loss orders to protect capital.
Define your risk-to-reward ratio. Ideally, aim for 1:2 or 1:3 risk/reward setups.
4.3. Avoid Overtrading
Trading too frequently leads to high costs and emotional mistakes.
Focus on high-quality setups, not quantity.
5. Developing a Proven Trading Strategy
5.1. Technical Analysis Strategies
Trend following: Identify stocks or indices with clear trends and ride them.
Breakout trading: Enter when price breaks key support/resistance levels.
Swing trading: Hold positions for days or weeks to capture medium-term trends.
5.2. Fundamental Analysis
For small accounts, fundamental investing (buying undervalued assets) can complement short-term trading.
Focus on high-quality companies or ETFs for slower, steady growth.
5.3. Algorithmic or Rule-Based Trading
Small accounts can use simple rules-based strategies to minimize emotional trading.
Example: Buy when a 20-day moving average crosses above the 50-day moving average, with a strict stop-loss of 2%.
6. Compounding Gains
6.1. The Power of Compounding
Compounding is the process of reinvesting profits to generate additional returns.
Example: $1,000 with 5% weekly growth can become over $3,300 in 12 weeks if profits are reinvested.
6.2. Avoid Taking Excessive Risk While Compounding
Resist the temptation to increase trade size aggressively.
Incremental growth is safer than risking the entire account on one “big” trade.
7. Trading Psychology
7.1. Emotional Discipline
Fear and greed are your biggest enemies.
Use journaling to track emotions, trade decisions, and outcomes.
7.2. Handling Losses
Accept losses as part of trading.
Avoid revenge trading or trying to “win back” losses immediately.
7.3. Patience and Consistency
Small accounts grow slowly at first.
Patience is crucial to avoid impulsive trading.
8. Leveraging Technology and Tools
8.1. Trading Platforms
Choose platforms with low fees, good charting tools, and fast execution.
Examples: Zerodha, Upstox, Interactive Brokers.
8.2. Alerts and Automation
Set price alerts for breakout levels or trend reversals.
Automation helps small accounts act quickly without constantly monitoring charts.
8.3. Data Analysis Tools
Volume profile, moving averages, and relative strength indicators can identify high-probability trades.
Keep strategies simple; avoid overcomplicating small account trading.
9. Learning from Mistakes
9.1. Maintaining a Trade Journal
Record every trade with entry/exit, rationale, outcome, and emotions.
Analyze patterns to refine your strategy.
9.2. Continuous Education
Read books, follow market news, and study technical/fundamental analysis.
Attend webinars or courses focused on small account trading.
9.3. Adapt and Evolve
Market conditions change; your strategy should adapt.
Avoid sticking rigidly to a losing approach.
10. Case Studies of Small Account Growth
10.1. Example 1: Trend Following in Stock Markets
Initial capital: $2,000
Average weekly return: 2%
Account after 6 months: ~$2,600
Key factors: Discipline, risk management, and trend identification
10.2. Example 2: Swing Trading Futures
Initial capital: $5,000
Targeted risk per trade: 1%
Consistent wins with 1:2 risk/reward ratio
Compounded gains turned account into ~$7,500 in 4 months
11. Common Mistakes to Avoid
Chasing losses – Increases risk of blowing the account.
Over-leveraging – Small accounts cannot sustain high leverage.
Ignoring transaction costs – Commissions and fees can eat up small gains.
Overcomplicating strategies – Simplicity beats complexity in small accounts.
Neglecting psychology – Emotional decisions destroy small accounts faster than bad strategies.
12. Mindset for Success
Patience: Small accounts grow slowly but steadily.
Discipline: Stick to rules, stop-losses, and risk management.
Adaptability: Be ready to change strategies if market conditions shift.
Resilience: Accept losses without derailing your plan.
Learning-oriented: Every trade, win or lose, is a lesson.
Conclusion
Turning a small account into big gains is not about finding a “get-rich-quick” scheme. It’s about combining strategy, risk management, discipline, and psychology to consistently grow capital. Small accounts have the advantage of agility and the potential for rapid compounding if approached correctly. By understanding the market, choosing the right instruments, and adhering to a strict set of rules, even modest capital can be transformed into substantial wealth over time.
Small account trading is a marathon, not a sprint. Consistent growth, patience, and learning from mistakes will ultimately separate successful traders from those who burn out early. With the right mindset and approach, big gains are not just possible—they are a natural result of disciplined trading.
Trading Platforms and Software Innovations1. Evolution of Trading Platforms
1.1 Traditional Trading Methods
Before the advent of electronic platforms, trading was conducted manually on exchange floors. Key features of traditional trading included:
Open outcry system: Traders would shout bids and offers in trading pits.
Manual record-keeping: Orders were recorded by hand or using simple ledger systems.
Limited access: Only brokers and institutional traders had direct access to the market.
Despite its effectiveness at the time, traditional trading was slow, prone to errors, and lacked transparency.
1.2 Emergence of Electronic Trading
The late 1970s and 1980s marked the beginning of electronic trading. The introduction of computers and telecommunication networks allowed exchanges to digitize order matching. Key milestones included:
NASDAQ (1971): One of the first electronic stock markets, allowing automated quotes.
Electronic Communication Networks (ECNs): Platforms like Instinet facilitated electronic trading between institutions.
Automated order routing: Brokers could send client orders directly to exchanges electronically.
This shift significantly improved speed, transparency, and accessibility.
1.3 Rise of Online Retail Trading
The 1990s and early 2000s saw the democratization of trading due to the internet. Retail investors gained direct access to markets via online trading platforms. Features included:
Real-time market quotes.
Portfolio tracking tools.
Commission-based trading at lower costs.
Interactive charts and research tools.
Companies like E*TRADE, TD Ameritrade, and Interactive Brokers played pivotal roles in popularizing retail online trading.
2. Components of Modern Trading Platforms
Modern trading platforms integrate multiple functionalities to serve the needs of diverse market participants. Key components include:
2.1 User Interface (UI) and User Experience (UX)
A well-designed UI/UX allows traders to navigate the platform efficiently. Features include:
Customizable dashboards: Displaying watchlists, orders, charts, and news.
Drag-and-drop tools: Simplifying order placement and portfolio management.
Mobile access: Smartphone apps ensure trading on-the-go.
2.2 Market Data Integration
Accurate and real-time market data is crucial for decision-making. Platforms typically provide:
Live quotes: Stock, commodity, forex, and crypto prices.
Depth of market: Showing bid-ask spreads and liquidity levels.
News and analytics feeds: Financial news, macroeconomic data, and research reports.
2.3 Order Execution and Routing
Efficient order execution is the heart of any trading platform. Innovations include:
Direct market access (DMA): Enables traders to send orders directly to exchanges.
Smart order routing (SOR): Automatically finds the best price across multiple exchanges.
Algorithmic order execution: Minimizes market impact and slippage.
2.4 Risk Management Tools
Modern platforms provide tools to monitor and mitigate trading risks:
Stop-loss and take-profit orders: Automatic risk control measures.
Margin and leverage tracking: Ensuring compliance with regulatory requirements.
Real-time P&L analysis: Assessing profitability and exposure.
3. Types of Trading Platforms
3.1 Broker-Hosted Platforms
These platforms are offered by brokerage firms and allow traders to access various markets. Examples include:
Interactive Brokers’ Trader Workstation (TWS): Known for advanced tools and global market access.
TD Ameritrade’s thinkorswim: Focused on derivatives and technical analysis.
3.2 Direct Market Access Platforms
DMA platforms provide institutional traders with direct connection to exchanges. Features include:
High-speed execution.
Access to multiple liquidity pools.
Customizable algorithmic trading strategies.
3.3 Algorithmic and Quantitative Platforms
Algorithmic trading platforms are designed for automated trading strategies. Features include:
Backtesting modules: Simulate strategies using historical data.
Execution algorithms: VWAP, TWAP, and iceberg orders.
Integration with programming languages: Python, R, and C++ for strategy development.
3.4 Cryptocurrency Trading Platforms
The rise of digital assets has led to specialized crypto trading platforms:
Centralized exchanges (CEX): Binance, Coinbase, Kraken.
Decentralized exchanges (DEX): Uniswap, PancakeSwap.
Features include crypto wallets, staking, lending, and advanced charting tools.
4. Software Innovations in Trading
4.1 High-Frequency Trading (HFT)
HFT uses ultra-fast algorithms to execute trades in milliseconds or microseconds. Innovations include:
Colocation services: Servers placed near exchange data centers for speed.
Latency optimization: Minimizing delays in data transmission.
Statistical arbitrage: Exploiting tiny price discrepancies.
HFT has transformed equity, forex, and derivatives markets by increasing liquidity but also raising regulatory concerns.
4.2 Artificial Intelligence and Machine Learning
AI-driven trading platforms analyze large datasets to detect patterns and make predictions:
Predictive analytics: Forecasting price trends and volatility.
Natural language processing (NLP): Extracting insights from news, earnings reports, and social media.
Reinforcement learning: Adaptive algorithms learning from market behavior in real-time.
4.3 Cloud-Based Platforms
Cloud technology has made trading platforms more scalable and accessible:
Remote accessibility: Traders can access platforms from anywhere without local installation.
Scalable computing resources: Handle large datasets and backtesting efficiently.
Lower operational costs: Eliminates the need for expensive on-premise infrastructure.
4.4 Social Trading and Copy Trading
Social trading platforms allow users to follow and replicate trades of successful traders:
Interactive features: Chat, news feeds, and performance rankings.
Copy trading automation: Replicates trades in real-time.
Community-driven insights: Encourages collaboration and learning.
4.5 Mobile and App-Based Innovations
Mobile platforms have made trading instantaneous:
Push notifications for market alerts.
Touch-based order execution.
Integration with digital wallets and payment gateways.
5. Security and Compliance Innovations
With the growth of online trading, security and regulatory compliance have become critical. Innovations include:
5.1 Encryption and Secure Authentication
Two-factor authentication (2FA): Adds extra layer of security.
End-to-end encryption: Protects sensitive data.
Biometric verification: Fingerprint and facial recognition.
5.2 Regulatory Technology (RegTech)
Platforms integrate tools to monitor compliance with global regulations.
Automated reporting and audit trails for regulators.
Anti-money laundering (AML) and Know Your Customer (KYC) protocols.
5.3 Fraud Detection and Risk Analytics
Real-time monitoring of suspicious trading activities.
AI-driven anomaly detection.
Protection against insider trading and market manipulation.
6. Impact of Trading Platform Innovations
The innovations in trading software have profoundly impacted the financial markets:
Increased Market Efficiency: Faster execution reduces arbitrage opportunities.
Democratization of Trading: Retail investors gain access to tools previously reserved for institutions.
Enhanced Risk Management: Automated tools minimize human errors and manage exposure.
Global Market Access: Traders can operate across multiple time zones and asset classes.
Data-Driven Decision Making: Advanced analytics empower informed trading strategies.
7. Challenges and Future Trends
7.1 Challenges
Despite advancements, trading platforms face challenges:
Cybersecurity threats: Constantly evolving attacks.
Regulatory hurdles: Different jurisdictions impose varying requirements.
Market volatility risks: Algorithmic errors can exacerbate market swings.
Technology costs: High-speed trading infrastructure is expensive for small traders.
7.2 Future Trends
Integration of AI and Quantum Computing: Ultra-fast predictive models and optimization.
Expansion of DeFi and Blockchain Platforms: Transparent, decentralized trading systems.
Personalized Trading Experiences: AI-driven insights tailored to individual traders.
Sustainable and ESG Trading Platforms: Tracking environmentally and socially responsible investments.
Virtual Reality (VR) Trading: Immersive trading environments for enhanced visualization and analysis.
Conclusion
Trading platforms and software innovations have transformed financial markets by enhancing speed, accessibility, and efficiency. From the manual open-outcry systems to AI-driven, cloud-based, and mobile platforms, technology has democratized trading and empowered traders with unprecedented tools and insights. As technological advances continue, the future of trading platforms promises even greater integration of AI, blockchain, and personalized experiences, shaping a new era of intelligent and efficient financial markets.
The evolution of trading platforms underscores the symbiotic relationship between technology and finance, where innovations drive market growth, risk management, and accessibility for participants across the globe.
Introduction and Types of Trading RiskIntroduction to Trading Risk
Trading in financial markets—whether equities, commodities, forex, or derivatives—offers the potential for significant profits, but it also exposes participants to various risks. Understanding trading risk is fundamental for any trader or investor, as it determines the potential for loss, the strategies to manage it, and the overall approach to financial decision-making.
At its core, trading risk is the possibility of losing some or all of the invested capital due to unpredictable market movements, operational failures, or external events. Unlike long-term investing, trading typically involves shorter time horizons, which often magnifies the exposure to volatility and uncertainty.
Why Understanding Trading Risk Is Important
Capital Preservation: Without understanding risk, traders may face catastrophic losses that can wipe out their trading accounts.
Strategic Planning: Identifying the type of risk helps traders plan positions, leverage usage, and stop-loss levels.
Psychological Preparedness: Awareness of risk helps manage emotional reactions, such as fear and greed, which often drive irrational trading decisions.
Compliance and Governance: For professional traders, understanding and documenting risk is crucial for regulatory compliance and reporting.
Trading risk is multidimensional. While some risks are inherent to the market itself, others are related to human behavior, operational inefficiencies, and broader economic factors. To navigate trading successfully, one must not only acknowledge these risks but also actively mitigate them through strategies, tools, and disciplined risk management practices.
Types of Trading Risk
Trading risk can be broadly classified into several categories. Each type has unique characteristics, causes, and mitigation strategies. Understanding these categories allows traders to make informed decisions and develop robust risk management plans.
1. Market Risk (Systematic Risk)
Definition: Market risk, also known as systematic risk, is the risk of losses due to overall market movements. It affects all securities in the market to some degree and cannot be entirely eliminated through diversification.
Key Characteristics:
Affects entire markets or market segments.
Driven by macroeconomic factors, geopolitical events, or global crises.
Unpredictable and largely unavoidable.
Examples:
Stock market crash due to an economic recession.
Interest rate changes impacting bond prices.
Currency devaluation affecting forex positions.
Subtypes of Market Risk:
Equity Risk: Risk of decline in stock prices.
Interest Rate Risk: Risk of losses from fluctuating interest rates.
Currency Risk: Risk arising from foreign exchange rate movements.
Commodity Risk: Risk of price changes in commodities like gold, oil, or wheat.
Mitigation Strategies:
Use of hedging instruments such as options and futures.
Diversification across asset classes.
Limiting exposure to highly volatile sectors.
2. Credit Risk (Counterparty Risk)
Definition: Credit risk is the possibility that a counterparty in a trade may default on their obligations. This is common in over-the-counter (OTC) markets, derivatives trading, and margin trading.
Key Characteristics:
Directly linked to the financial health of the counterparty.
Often overlooked by retail traders but critical for institutional trading.
Examples:
A forex broker failing to honor withdrawal requests.
A company defaulting on bond payments.
Counterparties in a derivatives contract not meeting their obligations.
Mitigation Strategies:
Conduct thorough due diligence before trading.
Use regulated and reputable brokers or exchanges.
Limit counterparty exposure and utilize collateral agreements.
3. Liquidity Risk
Definition: Liquidity risk is the risk of not being able to buy or sell a security quickly at the desired price due to insufficient market activity.
Key Characteristics:
More pronounced in thinly traded markets or exotic assets.
Can lead to significant losses if positions cannot be exited efficiently.
Examples:
Selling a large block of stocks in a small-cap company may drastically lower the price.
Difficulty liquidating positions during market closures or crises.
Forex pairs with low trading volume causing slippage.
Mitigation Strategies:
Trade only in liquid markets and assets.
Limit the size of positions relative to average market volume.
Use limit orders to control entry and exit prices.
4. Operational Risk
Definition: Operational risk arises from failures in internal processes, systems, or human error rather than market movements.
Key Characteristics:
Often underestimated by individual traders.
Includes errors in order execution, technical glitches, or fraudulent activity.
Examples:
System downtime preventing timely execution of trades.
Misplacing stop-loss orders due to human error.
Broker technical failure during high-volatility sessions.
Mitigation Strategies:
Implement reliable trading platforms and backup systems.
Automate risk management tools like stop-loss and take-profit.
Train staff or oneself in proper operational procedures.
5. Legal and Regulatory Risk
Definition: Legal risk is the possibility of losses due to changes in laws, regulations, or non-compliance issues.
Key Characteristics:
Particularly relevant for institutional traders or those trading internationally.
Can impact market access, trading costs, or tax liabilities.
Examples:
Regulatory changes restricting derivatives trading.
Introduction of new taxes on financial transactions.
Penalties for non-compliance with market regulations.
Mitigation Strategies:
Stay informed about regulatory developments.
Consult legal and compliance experts for guidance.
Ensure all trading activities comply with local and international laws.
6. Psychological Risk (Behavioral Risk)
Definition: Psychological risk refers to losses resulting from human emotions, biases, or irrational decision-making.
Key Characteristics:
Rooted in behavioral finance.
Affects both novice and experienced traders.
Examples:
Overtrading due to fear of missing out (FOMO).
Panic selling during a market correction.
Holding losing positions too long due to emotional attachment.
Mitigation Strategies:
Develop and adhere to a trading plan.
Use journaling to track decisions and emotions.
Employ discipline and self-awareness techniques.
7. Event Risk (Unsystematic Risk)
Definition: Event risk, also known as unsystematic risk, is linked to specific events or occurrences that affect a particular company, sector, or asset.
Key Characteristics:
Can be mitigated through diversification.
Often sudden and unpredictable.
Examples:
Corporate fraud or bankruptcy affecting stock prices.
Natural disasters impacting commodity production.
Product recalls causing sudden revenue loss for a company.
Mitigation Strategies:
Diversify across companies, sectors, and geographies.
Use derivative instruments to hedge exposure.
Monitor news and corporate announcements regularly.
8. Systemic Risk
Definition: Systemic risk refers to the potential collapse of an entire financial system or market, rather than just individual investments.
Key Characteristics:
Triggered by interconnectedness of institutions and markets.
Can have widespread economic implications.
Examples:
The 2008 global financial crisis.
Contagion effect during a banking collapse.
Extreme volatility in global markets due to geopolitical conflicts.
Mitigation Strategies:
Reduce leverage in positions.
Monitor macroeconomic indicators and systemic trends.
Employ stress testing to evaluate portfolio resilience.
9. Geopolitical and Macro-Economic Risk
Definition: This is the risk of losses caused by political instability, wars, international trade disruptions, or macroeconomic shifts.
Key Characteristics:
Highly unpredictable and difficult to hedge completely.
Often impacts multiple asset classes simultaneously.
Examples:
Trade sanctions affecting stock and commodity markets.
Political unrest leading to currency depreciation.
Central bank policy changes affecting interest rates and liquidity.
Mitigation Strategies:
Diversify internationally.
Use hedging instruments to protect against currency or commodity risks.
Stay updated with global political and economic developments.
10. Leverage Risk
Definition: Leverage risk arises when traders borrow capital to amplify potential gains, which also increases potential losses.
Key Characteristics:
Common in forex, derivatives, and margin trading.
Can quickly wipe out capital if not managed properly.
Examples:
Using high margin to take large positions in volatile stocks.
Futures contracts causing losses exceeding the initial investment.
Leveraged ETFs amplifying market swings.
Mitigation Strategies:
Limit leverage exposure.
Employ strict stop-loss and position-sizing rules.
Understand the underlying asset and market volatility before using leverage.
Conclusion
Trading risk is multifaceted, encompassing market, operational, psychological, and systemic elements. A successful trader does not aim to eliminate risk entirely—this is impossible—but rather to understand, measure, and manage it effectively. Proper risk management involves identifying the type of risk, analyzing potential impacts, and implementing strategies to mitigate losses while preserving opportunities for gains.
By comprehensively understanding trading risk, traders can make more informed decisions, protect their capital, and improve long-term profitability. The key takeaway is that risk is an inherent part of trading, but with discipline, education, and proactive strategies, it can be navigated successfully.
Introduction to Trading and Business Growth1. Understanding Trading: The Core Concept
Trading is the process of buying and selling financial instruments or goods to generate profit. While often associated with financial markets such as stocks, commodities, forex, and cryptocurrencies, trading can also refer to commercial activities involving goods and services. Trading operates on the principle of supply and demand: traders aim to buy low and sell high, capitalizing on price fluctuations.
1.1 Types of Trading
Financial Market Trading
Equities (Stocks): Buying shares in companies and profiting from price appreciation or dividends.
Commodities: Trading raw materials like gold, oil, or agricultural products.
Forex: Currency trading based on global exchange rate movements.
Cryptocurrency: Digital currencies traded on specialized exchanges.
Commercial Trading
Retail Trade: Buying goods in bulk and selling to consumers at a profit.
Wholesale Trade: Selling large quantities of products to retailers or businesses.
International Trade: Importing and exporting goods across borders.
Algorithmic & High-Frequency Trading (HFT)
Trading strategies executed through computers using complex algorithms, often capitalizing on millisecond-level market movements.
1.2 Principles of Successful Trading
Market Analysis: Understanding price movements using technical, fundamental, and sentiment analysis.
Risk Management: Limiting potential losses through stop-loss orders, diversification, and position sizing.
Discipline & Patience: Sticking to strategies without letting emotions dictate decisions.
Liquidity Awareness: Ensuring assets can be bought or sold without significant price disruption.
Trading is not just luck; it is a combination of strategy, research, timing, and execution.
2. Introduction to Business Growth
Business growth refers to the expansion of a company’s capacity, market presence, revenue, or profitability over time. Growth is essential for survival in competitive markets and can take various forms: increasing sales, entering new markets, launching new products, or improving operational efficiency.
2.1 Types of Business Growth
Organic Growth
Achieved through internal processes such as expanding product lines, enhancing marketing, improving customer experience, and scaling operations.
Examples: Increasing production, hiring talent, expanding into new cities.
Inorganic Growth
Occurs through mergers, acquisitions, or strategic partnerships.
Provides instant market share and access to resources but may involve higher risks and integration challenges.
Revenue Growth
Focused on increasing sales and turnover through better pricing, marketing, or diversification.
Market Growth
Expanding into new geographies or target audiences.
Product or Service Growth
Developing innovative products or enhancing existing offerings to attract new customers.
Operational Growth
Improving efficiency, reducing costs, and scaling infrastructure to support higher output.
2.2 Key Drivers of Business Growth
Customer-Centric Strategies: Understanding customer needs and delivering superior value.
Innovation & Technology Adoption: Leveraging modern tools and digital transformation to gain competitive advantage.
Financial Management: Optimizing cash flow, investments, and risk exposure.
Market Penetration & Diversification: Entering new markets or offering complementary products.
Talent Acquisition & Retention: Recruiting skilled personnel and fostering an innovative culture.
3. Trading as a Driver of Business Growth
Trading and business growth are closely intertwined. Effective trading strategies can enhance revenue, generate cash flow, and support overall business expansion.
3.1 Trading for Capital Generation
Trading financial instruments can serve as a source of capital for businesses. For example:
Profits from stock trading or forex can fund expansion projects.
Commodities trading can stabilize costs and ensure supply for manufacturing firms.
3.2 Risk Mitigation and Business Stability
Businesses engaged in trading often implement hedging strategies to reduce exposure to market volatility.
Example: Airlines hedge fuel prices to prevent unexpected costs from affecting profitability.
By reducing uncertainty, trading supports predictable cash flows essential for growth planning.
3.3 Strategic Partnerships Through Trade
Trading fosters relationships with suppliers, distributors, and financial institutions.
Strong trade networks can accelerate market expansion and operational scaling.
3.4 Learning Market Dynamics
Traders gain insights into market trends, consumer behavior, and economic cycles.
Businesses that apply these insights can better forecast demand, price products effectively, and expand strategically.
4. Strategies for Sustainable Business Growth
Sustainable growth is achieved through careful planning, resource management, and strategic execution.
4.1 Market Research and Competitive Analysis
Conducting research on competitors, customer preferences, and emerging trends helps businesses identify opportunities.
Tools: SWOT Analysis, PESTEL Analysis, Porter's Five Forces.
4.2 Diversification and Innovation
Diversifying products or services reduces dependency on a single revenue source.
Innovation creates differentiation and strengthens market positioning.
4.3 Marketing and Brand Development
Building a strong brand fosters customer loyalty and supports long-term growth.
Strategies include digital marketing, influencer collaborations, and content-driven campaigns.
4.4 Technology and Digital Transformation
Adopting modern technologies improves operational efficiency and customer experience.
Examples: ERP systems, AI-based analytics, e-commerce platforms, and CRM software.
4.5 Financial Planning and Investment
Growth requires capital investment. Businesses must balance reinvestment with profitability.
Tools: Budget forecasting, cash flow management, ROI analysis.
4.6 Talent Development and Organizational Culture
Skilled employees drive innovation, productivity, and competitive advantage.
Fostering a culture of continuous learning and adaptability is crucial for scaling.
5. Challenges in Trading and Business Growth
Both trading and business expansion come with inherent risks and challenges.
5.1 Market Volatility
Prices in financial markets fluctuate rapidly due to economic news, geopolitical tensions, and market sentiment.
Businesses trading commodities or currencies are particularly exposed.
5.2 Operational Risks
Inefficient processes, supply chain disruptions, or poor management can impede growth.
5.3 Competition
Intense competition pressures pricing, margins, and market share.
5.4 Regulatory Compliance
Adhering to regulations in trading (Securities laws, trade regulations) and business operations is critical to avoid penalties.
5.5 Financial Constraints
Insufficient funding can limit expansion opportunities.
Mismanaged trading positions may lead to liquidity problems.
5.6 Technology and Cybersecurity Threats
Digital trading platforms and business operations are vulnerable to cyberattacks.
Investment in secure infrastructure is essential.
6. Integrating Trading and Business Growth Strategies
A successful enterprise combines trading expertise with a robust growth framework.
6.1 Leveraging Market Opportunities
Businesses can use market analysis from trading to anticipate demand and make strategic decisions.
Example: A commodities trader expanding into food processing can use price trends to optimize procurement.
6.2 Capital Allocation for Growth
Profits from trading can be reinvested into business expansion projects such as new product launches, marketing campaigns, or international expansion.
6.3 Risk Hedging and Contingency Planning
Hedging in trading (e.g., options, futures contracts) protects businesses against price fluctuations.
Contingency plans ensure operations remain stable during economic turbulence.
6.4 Building Strategic Alliances
Trading networks often evolve into partnerships with suppliers, distributors, or even competitors.
Alliances facilitate shared resources, reduced costs, and faster market penetration.
7. Case Studies of Trading Driving Business Growth
7.1 Walmart and Supply Chain Optimization
Walmart’s retail success is deeply tied to its strategic trading and supply chain practices.
Real-time inventory management and bulk procurement allow it to scale rapidly and maintain competitive pricing.
7.2 Apple Inc. and Global Supply Management
Apple’s business growth relies on strategic sourcing and trading agreements with suppliers worldwide.
By controlling procurement costs and ensuring component availability, Apple can launch products at scale.
7.3 Hedge Funds and Capital Growth
Hedge funds leverage trading strategies to generate high returns, which are then reinvested into diversified portfolios.
Successful trading supports long-term growth of fund size and investor trust.
8. Future Trends in Trading and Business Growth
8.1 Digital Transformation
Blockchain, AI, and machine learning are reshaping trading and business operations.
Automated trading platforms and predictive analytics will optimize decision-making and operational efficiency.
8.2 Globalization and International Markets
Global trading expands business opportunities and enables diversification.
Emerging markets offer high growth potential but require careful risk assessment.
8.3 Sustainable and Ethical Practices
Businesses are increasingly integrating ESG (Environmental, Social, and Governance) principles.
Ethical trading and sustainable growth practices attract conscious consumers and long-term investors.
8.4 Data-Driven Decision Making
Big data and analytics empower businesses to understand market trends and consumer behavior.
Real-time trading data informs strategic expansion and risk management.
8.5 Decentralized Finance (DeFi) and Cryptocurrency Trading
DeFi and digital assets open new avenues for trading and capital growth.
Early adoption can create competitive advantages in innovative sectors.
9. Conclusion
Trading and business growth are intertwined pathways to financial success. Trading provides capital, insights, and market intelligence that fuel business expansion, while strategic business growth ensures that profits from trading are reinvested sustainably.
To achieve long-term success:
Businesses must integrate trading strategies with robust growth planning.
Risk management, financial prudence, and innovation are essential.
A forward-looking approach, leveraging technology and global trends, strengthens resilience and scalability.
Ultimately, trading is more than a mechanism for profit—it is a tool for strategic growth, enabling businesses to expand their reach, enhance operational efficiency, and secure a sustainable competitive edge in a dynamic global economy.
History and Evolution of Crypto Markets1. Precursors to Cryptocurrency
1.1 Early Concepts of Digital Money
The idea of digital money predates blockchain technology. Early attempts to create decentralized digital currencies emerged in the 1980s and 1990s. Notable examples include:
DigiCash (1989): Developed by David Chaum, DigiCash was an electronic cash system emphasizing privacy through cryptographic techniques. Despite its innovation, DigiCash failed commercially due to regulatory challenges and lack of adoption.
e-gold (1996): E-gold allowed users to transact in a gold-backed digital currency. It gained significant traction but ultimately faced legal issues related to money laundering, illustrating the challenges of regulating digital currencies.
1.2 Cryptography and the Idea of Decentralization
The foundational technology behind cryptocurrencies—cryptography—had been developing since the 1970s. Public key cryptography, hash functions, and digital signatures made secure, verifiable digital transactions possible. Visionaries like Wei Dai and Nick Szabo proposed concepts such as b-money and bit gold, which laid the groundwork for a decentralized digital currency system.
2. The Birth of Bitcoin
2.1 Satoshi Nakamoto and the White Paper (2008)
The official history of cryptocurrencies begins with Bitcoin. In 2008, an individual or group using the pseudonym Satoshi Nakamoto published the Bitcoin white paper, titled “Bitcoin: A Peer-to-Peer Electronic Cash System.”
Key innovations included:
Decentralization: Bitcoin operates without a central authority.
Blockchain: A distributed ledger ensures transparency and immutability.
Proof-of-Work: A consensus algorithm secures the network against double-spending.
Limited Supply: Bitcoin’s capped supply of 21 million coins created scarcity.
2.2 Launch and Early Adoption (2009–2011)
Bitcoin’s genesis block was mined in January 2009, marking the birth of the cryptocurrency ecosystem. Early adopters were primarily technologists, libertarians, and cryptography enthusiasts. Bitcoin’s first real-world transaction occurred in May 2010 when Laszlo Hanyecz bought two pizzas for 10,000 BTC, now famously remembered as the first commercial Bitcoin transaction.
By 2011, Bitcoin’s market gained visibility, reaching parity with the US dollar and spawning the first alternative cryptocurrencies, or altcoins, such as Litecoin, which introduced faster transaction times.
3. Expansion of the Crypto Ecosystem
3.1 Altcoins and Innovation (2011–2013)
Following Bitcoin’s success, thousands of alternative cryptocurrencies emerged, each seeking to improve upon Bitcoin’s limitations:
Litecoin (2011): Faster block generation, lower transaction fees.
Ripple (2012): Focused on cross-border payments and institutional adoption.
Namecoin (2011): Introduced decentralized DNS systems.
These early experiments diversified the ecosystem and demonstrated that blockchain could be used for purposes beyond simple peer-to-peer currency.
3.2 Early Exchanges and Market Development
Cryptocurrency exchanges began to appear, enabling users to trade digital assets:
Mt. Gox (2010): Initially a platform for trading Magic: The Gathering cards, it became the largest Bitcoin exchange by 2013, handling over 70% of global BTC transactions.
BTC-e and Bitstamp: Provided additional liquidity and infrastructure for crypto markets.
Exchanges played a critical role in establishing market prices, liquidity, and accessibility for retail investors.
4. The ICO Boom and Ethereum (2013–2017)
4.1 Ethereum and Smart Contracts
In 2013, Vitalik Buterin proposed Ethereum, a blockchain platform with the ability to execute smart contracts—self-executing code that runs on a decentralized network. Launched in 2015, Ethereum allowed developers to create decentralized applications (dApps), paving the way for:
Decentralized finance (DeFi)
Tokenized assets
Complex governance models
4.2 Initial Coin Offerings (ICOs)
Ethereum also enabled the rise of ICOs, where projects issued tokens to raise capital. Between 2016 and 2017, ICOs raised billions of dollars globally, creating a speculative boom. While many ICOs were successful, the market also experienced scams and failures, highlighting the risks of unregulated fundraising.
4.3 Market Maturation and Price Surges
By late 2017, Bitcoin’s price soared to nearly $20,000, and Ethereum exceeded $1,400. The market attracted mainstream media attention, institutional interest, and a wave of retail investors, marking the first major crypto market boom.
5. Market Correction and Regulatory Scrutiny (2018–2019)
5.1 The 2018 Crypto Winter
After the 2017 boom, the crypto market experienced a severe correction:
Bitcoin fell from ~$20,000 to below $4,000.
Many altcoins lost 80–90% of their value.
Market capitalization dropped from over $800 billion to under $200 billion.
5.2 Regulatory Developments
Governments began to recognize the need for regulation:
SEC (USA): Issued warnings about ICOs and classified some tokens as securities.
China: Banned ICOs and domestic cryptocurrency exchanges.
Japan and Switzerland: Introduced licensing frameworks for exchanges.
These measures aimed to protect investors while shaping the market’s infrastructure.
6. The Rise of DeFi, NFTs, and Layer 2 Solutions (2020–2022)
6.1 Decentralized Finance (DeFi)
DeFi platforms emerged, allowing financial services without intermediaries:
Lending and borrowing (Compound, Aave)
Decentralized exchanges (Uniswap, SushiSwap)
Yield farming and liquidity mining
DeFi introduced a new paradigm, where users could earn returns on their assets without traditional banks, but with increased smart contract and systemic risk.
6.2 Non-Fungible Tokens (NFTs)
NFTs became a cultural and financial phenomenon in 2021:
Enabled digital art ownership, collectibles, and gaming assets.
Opened new revenue streams for creators and introduced blockchain to mainstream audiences.
6.3 Layer 2 Solutions and Scaling
Blockchain networks faced congestion as DeFi and NFTs increased activity. Layer 2 scaling solutions (e.g., Polygon, Optimism) and alternative blockchains (e.g., Solana, Avalanche) emerged to reduce fees and increase transaction throughput.
7. Institutional Adoption and Mainstream Integration (2021–2023)
7.1 Institutional Interest
Large institutions began participating in crypto markets:
Companies like MicroStrategy, Tesla, and Square purchased Bitcoin as a reserve asset.
Investment banks and hedge funds launched crypto trading desks.
CME and Bakkt introduced futures and options on crypto.
7.2 Stablecoins and Payment Systems
Stablecoins, such as USDT, USDC, and BUSD, became essential for trading and payments:
Pegged to fiat currencies to reduce volatility.
Facilitated cross-border transactions and DeFi participation.
7.3 Regulatory Progress and Challenges
Governments increasingly engaged in policy formation:
US, EU, and Asia developed frameworks for taxation, anti-money laundering (AML), and investor protection.
Central Bank Digital Currencies (CBDCs) explored the integration of blockchain in sovereign monetary systems.
8. Crypto Market Volatility and Emerging Trends (2023–2025)
8.1 Market Cycles
The crypto market continued to exhibit volatility, driven by macroeconomic factors, technological upgrades, and speculative behavior. Bitcoin’s role as “digital gold” and Ethereum’s shift to proof-of-stake (Ethereum 2.0) shaped investor strategies.
8.2 Emerging Technologies
Web3 Applications: Decentralized social media, gaming, and marketplaces.
Layer 1 Innovations: Ethereum alternatives and sharding for scalability.
Interoperability Protocols: Cosmos, Polkadot, and cross-chain solutions enabling multi-chain ecosystems.
8.3 Societal and Cultural Impact
Cryptocurrencies influenced:
Financial inclusion, especially in developing countries.
New forms of digital identity and governance.
Debates on privacy, censorship, and the future of decentralized networks.
9. Key Lessons from the Evolution of Crypto Markets
Technological Innovation Drives Growth: Blockchain, smart contracts, and cryptography are central to adoption.
Speculation vs. Utility: Early markets were speculative; long-term adoption requires real-world use cases.
Regulation Shapes Markets: Legal clarity encourages institutional participation, while uncertainty can depress growth.
Market Volatility Is Normative: Cycles of boom and bust are inherent, reflecting immature markets and behavioral factors.
Decentralization Challenges Traditional Finance: Peer-to-peer finance, decentralized governance, and tokenized assets redefine financial norms.
10. Future Outlook
10.1 Institutional and Retail Integration
The trend of institutional adoption is expected to continue, alongside growing retail participation through user-friendly platforms and fintech integration.
10.2 Technological Evolution
Layer 2 and interoperability solutions will enhance scalability.
Blockchain-based AI, IoT, and supply chain solutions may drive new use cases.
10.3 Regulation and Mainstream Acceptance
Clearer regulatory frameworks may reduce risk and encourage long-term investment.
CBDCs may coexist with decentralized cryptocurrencies, creating a hybrid financial ecosystem.
10.4 Global Economic Implications
Cryptocurrencies could reshape monetary policy, capital flows, and global finance.
Digital assets may provide new tools for financial inclusion and cross-border trade.
Conclusion
The history and evolution of crypto markets illustrate a journey from obscure digital experiments to a sophisticated, multifaceted global financial ecosystem. Innovations in blockchain, cryptography, and decentralized finance, coupled with cultural adoption and regulatory adaptation, have transformed cryptocurrency from a niche concept into a mainstream asset class. While volatility and uncertainty remain, the trajectory suggests continued integration with traditional finance, technological innovation, and societal influence.
The crypto market’s evolution is ongoing, reflecting broader trends in technology, finance, and global governance. Understanding its history provides critical insights into its future potential and the challenges it may face in shaping the next generation of financial systems.
Patience is Profit: The Unseen Poetry of Forex Risk Management⚠️ Shocking Truth in Forex Trading ⚠️
Most traders lose not because their strategy is wrong… but because they ignore risk management.
🛡️ Mastering Risk Management in Forex Trading
Risk management is the foundation of long-term success in Forex. Many traders spend their time perfecting entries and strategies, but the real edge comes from how well you manage risk, emotions, and capital. Without these, even the best strategy will fail.
📌 Position Sizing
📉 Never risk more than 1–2% of your account on a single trade.
📏 Adjust lot size according to your stop-loss distance.
⏳ Small, controlled risks keep you in the game long enough to let your strategy work.
🎯 Risk-to-Reward Ratio
⚖️ Always aim for 1:2 or higher risk-to-reward.
📊 Even with just a 40% win rate, a positive RRR keeps you profitable.
🔑 Focus on consistency rather than chasing quick wins.
🧠 Psychology of Risk
😨 Fear makes traders exit winning trades too soon.
💰 Greed convinces them to hold onto losing trades too long.
📝 Build a personal rule: “I follow my plan, not my emotions.”
✔️ Accept losses as part of the business—risk is simply the cost of trading.
📉 Drawdown Control
🚫 Avoid over-leveraging—it magnifies both profits and losses.
🛑 Cap your risk per trade to protect account equity.
🔄 Remember: a 50% loss requires 100% gain to recover. Capital protection comes first.
🔄 Consistency Over Perfection
🎲 No strategy wins every time.
🏦 Risk management allows you to survive losing streaks.
🎰 Think like a casino: edge + probability + discipline = profit.
🧘 Trading Psychology Habits
📖 Keep a trading journal to track results and emotions.
🧩 Detach from outcomes and focus on executing your plan.
☕ Trade only when your mindset is calm and focused.
⚖️ Golden Rule
💎 Protect your capital first—profits will naturally follow.
Discipline, patience, and controlled risk are the keys to turning short-term survival into long-term success.
✅ Final Thought: In Forex, your greatest weapon is not predicting every move but mastering risk management and emotional control. The market always rewards patience, discipline, and consistency—not reckless gambling.
📢 Follow me for more Forex insights, strategies, and trading psychology content.

Divergance Secrets1. Introduction to Option Trading
In the world of financial markets, traders and investors are constantly looking for ways to maximize returns while managing risks. Beyond the conventional buying and selling of stocks, bonds, or commodities lies the fascinating arena of derivatives. Among derivatives, options stand out as one of the most versatile and widely used financial instruments.
An option is essentially a contract that gives the holder the right, but not the obligation, to buy or sell an underlying asset at a predetermined price before or at a specified expiration date. This flexibility allows traders to hedge risks, speculate on market movements, or design complex strategies to suit different risk appetites.
Option trading is a double-edged sword: it can generate extraordinary profits in a short span but also result in significant losses if misunderstood. Hence, before stepping into this market, it is essential to understand the fundamentals, mechanics, and strategies behind option trading.
2. Basics of Options
To understand option trading, let us first dissect the essential components.
2.1 Call Options
A call option gives the buyer the right, but not the obligation, to buy the underlying asset at a predetermined price (strike price) within a specific period.
If the asset’s price rises above the strike price, the call option holder can buy at a lower price and profit.
If the price falls below the strike, the buyer may let the option expire worthless, losing only the premium paid.
Example: If you buy a call option on Stock A at ₹100 strike and the stock rises to ₹120, you profit by exercising the option or selling it in the market.
2.2 Put Options
A put option gives the buyer the right, but not the obligation, to sell the underlying asset at the strike price before or at expiration.
If the asset price falls below the strike, the put holder benefits.
If it rises above the strike, the option may expire worthless.
Example: If you buy a put option on Stock A at ₹100 and the stock falls to ₹80, you can sell it at ₹100, making a profit.
2.3 Strike Price
The pre-agreed price at which the underlying asset can be bought or sold.
2.4 Premium
The price paid by the option buyer to the seller (writer) for acquiring the option contract. It represents the upfront cost and is influenced by time, volatility, and underlying asset price.
2.5 Expiration Date
Options have a finite life and must be exercised or left to expire on a specific date.
3. Types of Options
Options vary based on style, market, and underlying assets.
American Options – Can be exercised anytime before expiration.
European Options – Can only be exercised on the expiration date.
Equity Options – Based on shares of companies.
Index Options – Based on stock indices like Nifty, S&P 500, etc.
Commodity Options – Based on gold, silver, crude oil, etc.
Currency Options – Based on forex pairs like USD/INR.
4. Participants in Option Trading
Every option trade involves two primary parties:
Option Buyer – Pays the premium, enjoys the right but no obligation.
Option Seller (Writer) – Receives the premium but carries the obligation if the buyer exercises the contract.
The buyer has limited risk (premium paid), but the seller has theoretically unlimited risk and limited profit (premium received).
5. Why Trade Options?
Traders and investors use options for multiple reasons:
Hedging – Protecting existing investments from adverse price moves.
Speculation – Betting on market directions with limited risk.
Income Generation – Writing options to collect premiums.
Leverage – Controlling a large position with a relatively small investment.

Part 2 Candle Stick Pattern 1. Introduction to Option Trading
In the world of financial markets, traders and investors are constantly looking for ways to maximize returns while managing risks. Beyond the conventional buying and selling of stocks, bonds, or commodities lies the fascinating arena of derivatives. Among derivatives, options stand out as one of the most versatile and widely used financial instruments.
An option is essentially a contract that gives the holder the right, but not the obligation, to buy or sell an underlying asset at a predetermined price before or at a specified expiration date. This flexibility allows traders to hedge risks, speculate on market movements, or design complex strategies to suit different risk appetites.
Option trading is a double-edged sword: it can generate extraordinary profits in a short span but also result in significant losses if misunderstood. Hence, before stepping into this market, it is essential to understand the fundamentals, mechanics, and strategies behind option trading.
2. Basics of Options
To understand option trading, let us first dissect the essential components.
2.1 Call Options
A call option gives the buyer the right, but not the obligation, to buy the underlying asset at a predetermined price (strike price) within a specific period.
If the asset’s price rises above the strike price, the call option holder can buy at a lower price and profit.
If the price falls below the strike, the buyer may let the option expire worthless, losing only the premium paid.
Example: If you buy a call option on Stock A at ₹100 strike and the stock rises to ₹120, you profit by exercising the option or selling it in the market.
2.2 Put Options
A put option gives the buyer the right, but not the obligation, to sell the underlying asset at the strike price before or at expiration.
If the asset price falls below the strike, the put holder benefits.
If it rises above the strike, the option may expire worthless.
Example: If you buy a put option on Stock A at ₹100 and the stock falls to ₹80, you can sell it at ₹100, making a profit.
2.3 Strike Price
The pre-agreed price at which the underlying asset can be bought or sold.
2.4 Premium
The price paid by the option buyer to the seller (writer) for acquiring the option contract. It represents the upfront cost and is influenced by time, volatility, and underlying asset price.
2.5 Expiration Date
Options have a finite life and must be exercised or left to expire on a specific date.
3. Types of Options
Options vary based on style, market, and underlying assets.
American Options – Can be exercised anytime before expiration.
European Options – Can only be exercised on the expiration date.
Equity Options – Based on shares of companies.
Index Options – Based on stock indices like Nifty, S&P 500, etc.
Commodity Options – Based on gold, silver, crude oil, etc.
Currency Options – Based on forex pairs like USD/INR.
4. Participants in Option Trading
Every option trade involves two primary parties:
Option Buyer – Pays the premium, enjoys the right but no obligation.
Option Seller (Writer) – Receives the premium but carries the obligation if the buyer exercises the contract.
The buyer has limited risk (premium paid), but the seller has theoretically unlimited risk and limited profit (premium received).
5. Why Trade Options?
Traders and investors use options for multiple reasons:
Hedging – Protecting existing investments from adverse price moves.
Speculation – Betting on market directions with limited risk.
Income Generation – Writing options to collect premiums.
Leverage – Controlling a large position with a relatively small investment.

Part 1 Candle Stick Pattern1. Introduction to Options
Financial markets have always revolved around two broad purposes—hedging risk and creating opportunity. Among the tools available, options stand out because they combine flexibility, leverage, and adaptability in a way few instruments can match. Unlike simply buying a stock or bond, an option lets you control exposure to price movements without outright ownership. This makes options both fascinating and complex.
Option trading today has exploded globally, with millions of retail and institutional traders participating daily. But to appreciate their role, we need to peel back the layers—what exactly is an option, how does it work, and why do traders and investors use them?
2. What Are Options? (Call & Put Basics)
An option is a financial derivative—meaning its value is derived from an underlying asset like a stock, index, commodity, or currency.
There are two main types:
Call Option – Gives the holder the right (not obligation) to buy the underlying at a set price (strike) before or on expiration.
Put Option – Gives the holder the right (not obligation) to sell the underlying at a set price before or on expiration.
Example: Suppose Reliance stock trades at ₹2,500. If you buy a call option with a strike price of ₹2,600 expiring in one month, you’re betting the stock will rise above ₹2,600. Conversely, if you buy a put option with a strike price of ₹2,400, you’re betting the stock will fall below ₹2,400.
The beauty lies in asymmetry: you can lose only the premium you pay, but your potential profit can be much larger.
3. Key Terminologies in Option Trading
Options trading comes with its own dictionary. Some must-know terms include:
Strike Price – Predetermined price to buy/sell underlying.
Expiration Date – Last date the option is valid.
Premium – Price paid to buy the option.
In the Money (ITM) – Option has intrinsic value (profitable if exercised immediately).
Out of the Money (OTM) – Option has no intrinsic value, only time value.
At the Money (ATM) – Strike price equals current market price.
Lot Size – Standardized quantity of underlying in each option contract.
Open Interest (OI) – Number of outstanding option contracts in the market.
Understanding these is critical before trading.
4. How Options Work in Practice
Let’s say you buy an Infosys call option with strike ₹1,500, paying ₹30 premium.
If Infosys rises to ₹1,600, your option has intrinsic value of ₹100. Profit = ₹100 – ₹30 = ₹70 per share.
If Infosys stays below ₹1,500, the option expires worthless. Loss = Premium (₹30).
Notice how a small move in stock can create a large percentage return on option, thanks to leverage.
5. Intrinsic Value vs. Time Value
Option price = Intrinsic Value + Time Value.
Intrinsic Value – Actual in-the-money amount.
Time Value – Extra premium traders pay for the possibility of future favorable movement before expiry.
Time value decreases with theta decay as expiration approaches.
6. Factors Influencing Option Pricing (The Greeks)
Options are sensitive to multiple variables. Traders rely on the Greeks to measure this sensitivity:
Delta – Rate of change in option price per unit move in underlying.
Gamma – Rate of change of delta.
Theta – Time decay; how much value option loses daily.
Vega – Sensitivity to volatility.
Rho – Impact of interest rates.
Mastering Greeks is like learning the steering controls of a car—you can’t drive well without them.
7. Types of Option Contracts
Options extend beyond equities:
Equity Options – On individual company stocks.
Index Options – On indices like Nifty, Bank Nifty, S&P 500.
Commodity Options – On crude oil, gold, natural gas.
Currency Options – On USD/INR, EUR/USD, etc.
Each market has unique dynamics, liquidity, and risks.
8. Options Market Structure
Options can be traded in two ways:
Exchange-Traded Options – Standardized, regulated, and liquid.
OTC (Over-the-Counter) Options – Customized contracts between institutions, used for hedging large exposures.
Retail traders mostly deal with exchange-traded options.

Part 2 Support and Resistance 1. Introduction to Options
Financial markets have always revolved around two broad purposes—hedging risk and creating opportunity. Among the tools available, options stand out because they combine flexibility, leverage, and adaptability in a way few instruments can match. Unlike simply buying a stock or bond, an option lets you control exposure to price movements without outright ownership. This makes options both fascinating and complex.
Option trading today has exploded globally, with millions of retail and institutional traders participating daily. But to appreciate their role, we need to peel back the layers—what exactly is an option, how does it work, and why do traders and investors use them?
2. What Are Options? (Call & Put Basics)
An option is a financial derivative—meaning its value is derived from an underlying asset like a stock, index, commodity, or currency.
There are two main types:
Call Option – Gives the holder the right (not obligation) to buy the underlying at a set price (strike) before or on expiration.
Put Option – Gives the holder the right (not obligation) to sell the underlying at a set price before or on expiration.
Example: Suppose Reliance stock trades at ₹2,500. If you buy a call option with a strike price of ₹2,600 expiring in one month, you’re betting the stock will rise above ₹2,600. Conversely, if you buy a put option with a strike price of ₹2,400, you’re betting the stock will fall below ₹2,400.
The beauty lies in asymmetry: you can lose only the premium you pay, but your potential profit can be much larger.
3. Key Terminologies in Option Trading
Options trading comes with its own dictionary. Some must-know terms include:
Strike Price – Predetermined price to buy/sell underlying.
Expiration Date – Last date the option is valid.
Premium – Price paid to buy the option.
In the Money (ITM) – Option has intrinsic value (profitable if exercised immediately).
Out of the Money (OTM) – Option has no intrinsic value, only time value.
At the Money (ATM) – Strike price equals current market price.
Lot Size – Standardized quantity of underlying in each option contract.
Open Interest (OI) – Number of outstanding option contracts in the market.
Understanding these is critical before trading.
4. How Options Work in Practice
Let’s say you buy an Infosys call option with strike ₹1,500, paying ₹30 premium.
If Infosys rises to ₹1,600, your option has intrinsic value of ₹100. Profit = ₹100 – ₹30 = ₹70 per share.
If Infosys stays below ₹1,500, the option expires worthless. Loss = Premium (₹30).
Notice how a small move in stock can create a large percentage return on option, thanks to leverage.
5. Intrinsic Value vs. Time Value
Option price = Intrinsic Value + Time Value.
Intrinsic Value – Actual in-the-money amount.
Time Value – Extra premium traders pay for the possibility of future favorable movement before expiry.
Time value decreases with theta decay as expiration approaches.

Part 1 Support and Resistance 1. Introduction to Option Trading
Option trading is a type of derivatives trading where traders buy and sell options contracts rather than the underlying asset itself. An option is a financial contract that gives the holder the right, but not the obligation, to buy or sell an underlying asset at a specified price, called the strike price, on or before a specific date (expiration date). Options are widely used in equity, commodity, index, and currency markets.
Unlike traditional stock trading, option trading allows traders to leverage small amounts of capital to potentially earn higher returns. However, with this potential comes higher risk, especially in speculative strategies.
2. Key Terms in Option Trading
Before diving deeper, it’s essential to understand the terminology:
Call Option – Gives the buyer the right to buy the underlying asset at the strike price.
Put Option – Gives the buyer the right to sell the underlying asset at the strike price.
Strike Price (Exercise Price) – The price at which the underlying asset can be bought or sold.
Expiration Date – The date on which the option expires and becomes worthless if not exercised.
Premium – The price paid to buy the option.
Intrinsic Value – The difference between the underlying asset price and the strike price.
Time Value – The portion of the premium reflecting the remaining time until expiration.
In the Money (ITM) – A call option is ITM when the underlying price > strike price; a put option is ITM when the underlying price < strike price.
Out of the Money (OTM) – A call option is OTM when the underlying price < strike price; a put option is OTM when underlying price > strike price.
At the Money (ATM) – When the underlying price = strike price.
3. How Options Work
3.1 Call Options Example
Suppose a stock is trading at ₹100, and you buy a call option with a strike price of ₹105 for a premium of ₹2. If the stock rises to ₹115:
Intrinsic Value = 115 – 105 = ₹10
Profit = 10 – 2 (premium paid) = ₹8
If the stock stays below ₹105, the option expires worthless, and the loss is limited to the premium.
3.2 Put Options Example
Suppose the stock is at ₹100, and you buy a put option with a strike price of ₹95 for a premium of ₹3. If the stock falls to ₹85:
Intrinsic Value = 95 – 85 = ₹10
Profit = 10 – 3 (premium paid) = ₹7
If the stock stays above ₹95, the put expires worthless, and the loss is limited to the premium.
4. Types of Option Trading Participants
Buyers (Holders)
Pay a premium to gain the right to buy or sell.
Risk is limited to premium paid.
Sellers (Writers)
Receive a premium in exchange for obligation to buy or sell if exercised.
Risk can be unlimited in case of naked options, limited if covered.
5. Why Trade Options?
Option trading offers several advantages:
Leverage – Control a larger position with less capital.
Hedging – Protect against price movements in underlying assets.
Income Generation – Sell options to earn premiums (covered calls).
Flexibility – Apply strategies for bullish, bearish, or neutral markets.
Risk Management – Limit losses while maximizing profit potential.

Option Trading 1. Speculation with Options
Options allow leverage, letting traders profit from small price movements with limited capital. Risk is limited to the premium paid for buyers, but sellers face potentially unlimited risk.
2. Option Styles
Options come in different styles:
European Options: Can be exercised only at expiry.
American Options: Can be exercised anytime before expiry.
Bermudan Options: Exercise possible on specific dates before expiry.
3. Factors Affecting Option Prices
Option premiums are influenced by:
Underlying asset price
Strike price
Time to expiry
Volatility
Interest rates
Dividends
Understanding these factors helps in predicting option price movement.
4. Intrinsic vs. Extrinsic Value
Intrinsic value: Real value if exercised now.
Extrinsic value: Additional premium based on time and volatility.
Example: If a stock trades at ₹520 and the call strike is ₹500, intrinsic value = ₹20, rest is extrinsic value.
5. Option Strategies
There are basic and advanced option strategies:
Single-leg: Buying a call or put.
Multi-leg: Combining options to reduce risk or maximize profit (e.g., spreads, straddles, strangles).
Example: Covered call involves holding the stock and selling a call to earn extra premium.
6. Risk Management
Options trading requires strict risk management:
Limit exposure per trade.
Use stop-loss orders.
Diversify strategies.
Monitor Greeks to assess risk dynamically.
7. Advantages of Options
Flexibility in trading.
Leverage for small capital.
Hedging against price swings.
Profit in any market condition using proper strategies.
8. Disadvantages of Options
Complexity compared to stocks.
Time decay can erode value.
Unlimited risk for option sellers.
Requires continuous monitoring of market movements.
9. Real-life Examples
Hedging: A farmer selling wheat futures and buying put options to secure a minimum price.
Speculation: A trader buying Nifty call options before earnings season to profit from upward movement.
Income: Selling covered calls on owned stocks to earn premiums regularly.
10. Conclusion
Option trading is a powerful tool for hedging, speculation, and income generation, but it requires knowledge, discipline, and risk management. Understanding strike prices, premiums, Greeks, and strategies ensures that traders can capitalize on market movements effectively. Beginners should start with simple strategies and gradually explore complex multi-leg positions as they gain confidence.

PCR Trading Strategies1. Introduction to Options
Options are financial derivatives that give the holder the right, but not the obligation, to buy or sell an underlying asset at a predetermined price (strike price) before or on a specific date (expiry). Unlike futures, which require the contract to be fulfilled, options allow flexibility. Options are widely used in stock markets, commodities, currencies, and indices.
2. Types of Options
There are two main types of options:
Call Option: Gives the buyer the right to buy the underlying asset.
Put Option: Gives the buyer the right to sell the underlying asset.
Example: Buying a call option of Tata Motors with a strike price of ₹450 allows you to buy the stock at ₹450, regardless of the market price.
3. Option Participants
Option trading involves two primary participants:
Buyer (Holder): Pays a premium and has the right to exercise the option.
Seller (Writer): Receives the premium and assumes the obligation to fulfill the contract if exercised.
4. Premium in Options
The premium is the price paid by the buyer to acquire the option. It consists of:
Intrinsic value: Difference between strike price and current market price.
Time value: Additional cost for potential future profit until expiry.
Example: If a stock is ₹500, and a call option with a ₹480 strike costs ₹25, the intrinsic value is ₹20, and the time value is ₹5.
5. Strike Price
The strike price is the predetermined price at which the underlying asset can be bought (call) or sold (put). Selecting the right strike price is crucial for option strategies.
6. Expiry Date
Options have a limited life. The expiry date determines the last day the option can be exercised. Indian markets follow weekly, monthly, and quarterly expiries.
7. Moneyness of Options
Options are categorized by their moneyness:
In-the-Money (ITM): Exercise is profitable.
At-the-Money (ATM): Strike price equals underlying price.
Out-of-the-Money (OTM): Exercise is unprofitable.
Example: A call option at ₹480 when the stock trades at ₹500 is ITM.
8. Option Greeks
Option Greeks are metrics that measure risk and price sensitivity:
Delta: Price change sensitivity to the underlying asset.
Gamma: Rate of change of Delta.
Theta: Time decay effect on option premium.
Vega: Sensitivity to volatility.
Rho: Sensitivity to interest rates.
9. Long vs. Short Positions
Long Call/Put: Buying options to profit from upward (call) or downward (put) movement.
Short Call/Put: Selling options to collect premium, often used in hedging.
10. Hedging with Options
Options are widely used for risk management. Investors hedge positions to protect against adverse market movements.
Example: If you own Infosys shares, buying a put option can limit downside risk.

XAU - 1.618 level on 2 week swing chartInteresting to note that we have started to pull back on the 1.618 extension of the previous move on the 2 week swing chart. Only time will tell if we pull back to the 50% or even pull back to the exhaust gap.
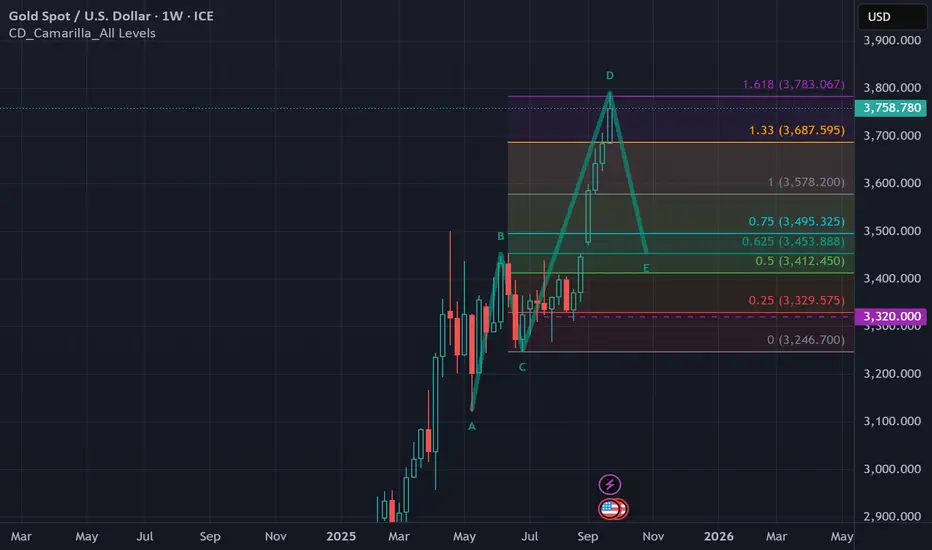
Tools and Techniques for Macro Risk Analysis1. Introduction to Macro Risk
Macro risk stems from changes in the broader economic environment that can affect business performance and investment outcomes. Unlike micro risks, which are specific to a company or sector, macro risks include interest rate changes, inflation, exchange rate fluctuations, geopolitical tensions, regulatory changes, and natural disasters. Recognizing these risks and their potential impact is critical for investors, policymakers, and corporate leaders.
1.1 Importance of Macro Risk Analysis
Portfolio Protection: Helps investors shield their investments from systemic shocks.
Strategic Decision Making: Assists businesses in planning for long-term stability.
Policy Formulation: Supports governments in anticipating economic disruptions.
Risk Mitigation: Allows firms to design hedging strategies to counter adverse impacts.
2. Categories of Macro Risk
Understanding macro risk requires identifying its major types:
Economic Risk: Includes GDP growth fluctuations, unemployment, inflation, deflation, and recessions.
Financial Risk: Interest rate changes, credit crises, liquidity shortages, and asset bubbles.
Political/Regulatory Risk: Geopolitical tensions, elections, policy reforms, sanctions, and regulatory shifts.
Environmental Risk: Natural disasters, climate change, pandemics, and resource scarcity.
Global Interconnected Risks: Contagion from foreign markets, global trade disputes, and currency crises.
Each category requires specific tools and techniques to assess and quantify its impact on investments or business operations.
3. Tools for Macro Risk Analysis
Macro risk analysis leverages both qualitative and quantitative tools. These tools help analysts evaluate potential threats, simulate scenarios, and make informed decisions.
3.1 Economic Indicators
Economic indicators are statistical measures reflecting the current and future state of an economy.
Leading Indicators: Predict economic trends (e.g., stock market indices, new orders in manufacturing, consumer sentiment).
Lagging Indicators: Confirm trends after they occur (e.g., unemployment rates, corporate profits).
Coincident Indicators: Show the current state of the economy (e.g., GDP, industrial production).
Applications:
Forecasting recessionary periods.
Monitoring inflationary pressures.
Evaluating consumer confidence and demand trends.
3.2 Econometric Models
Econometric models employ mathematical and statistical techniques to quantify macroeconomic relationships.
Time Series Models: Analyze trends, cycles, and seasonal effects (e.g., ARIMA, VAR models).
Regression Analysis: Determines the impact of independent variables on macroeconomic outcomes.
Structural Models: Incorporate economic theory to predict responses to policy changes.
Applications:
Forecasting GDP, inflation, and employment.
Evaluating the effect of interest rate changes on investments.
Stress testing financial portfolios under macroeconomic shocks.
3.3 Scenario Analysis
Scenario analysis explores potential future states by constructing hypothetical situations based on different assumptions.
Best-case Scenario: Optimistic conditions for economic growth.
Worst-case Scenario: Severe economic disruptions, recessions, or financial crises.
Most-likely Scenario: Moderately realistic assumptions based on historical trends.
Applications:
Strategic planning and budgeting.
Risk-adjusted investment allocation.
Crisis management and contingency planning.
3.4 Stress Testing
Stress testing involves simulating extreme but plausible macroeconomic events to assess the resilience of a system or portfolio.
Types of Stress Tests:
Interest rate shocks
Currency devaluation
Oil price shocks
Credit crunch simulations
Applications:
Banks assess capital adequacy under financial stress.
Corporations evaluate supply chain vulnerabilities.
Investment funds analyze portfolio resilience.
3.5 Financial Risk Models
Financial models are central to quantifying the impact of macroeconomic variables on markets and portfolios.
Value-at-Risk (VaR): Estimates the maximum loss under normal market conditions over a specific timeframe.
Conditional Value-at-Risk (CVaR): Measures the average loss in worst-case scenarios beyond VaR.
Monte Carlo Simulation: Uses random sampling to model potential outcomes of portfolios under uncertain macroeconomic conditions.
Applications:
Risk quantification for investment portfolios.
Determining capital reserves for banks and insurance firms.
Scenario-based decision support for fund managers.
3.6 Macro-Financial Mapping
Macro-financial mapping links macroeconomic indicators to asset prices, interest rates, and corporate earnings.
Yield Curve Analysis: Examines interest rate expectations and recession probabilities.
Credit Spread Analysis: Measures risk perception in corporate and sovereign debt.
Equity Market Sensitivity: Assesses sectoral vulnerability to economic shocks.
Applications:
Portfolio diversification and asset allocation.
Monitoring systemic risk in financial markets.
Policy evaluation and investment forecasting.
3.7 Big Data and AI Tools
Modern macro risk analysis increasingly relies on big data analytics, machine learning, and artificial intelligence.
Text Analysis: Scraping news, reports, and social media to detect emerging risks.
Predictive Analytics: Machine learning models forecast macroeconomic trends.
Real-time Monitoring: AI platforms track global economic indicators continuously.
Applications:
Early warning systems for financial crises.
Risk scoring for investment decisions.
Automated scenario simulations.
4. Techniques for Macro Risk Analysis
Macro risk analysis requires methodical approaches to interpret the tools effectively.
4.1 Historical Analysis
Examining past macroeconomic events provides insights into potential future risks.
Crisis Analysis: Study past recessions, depressions, and financial crises.
Correlation Analysis: Identify how macroeconomic variables move together.
Trend Analysis: Detect long-term patterns in economic growth, inflation, or interest rates.
Applications:
Identifying systemic vulnerabilities.
Learning from previous policy interventions.
Anticipating market responses to similar events.
4.2 Sensitivity Analysis
Sensitivity analysis measures how changes in macroeconomic variables affect financial performance or portfolio returns.
Single-variable Analysis: Change one macro factor while holding others constant.
Multi-variable Analysis: Explore combined effects of multiple macro factors.
Applications:
Determining exposure to interest rates, inflation, or currency fluctuations.
Strategic risk planning for multinational operations.
Stress testing investment portfolios.
4.3 Risk Mapping
Risk mapping visualizes and prioritizes macro risks based on their probability and impact.
Risk Matrix: Plots risks by severity and likelihood.
Heat Maps: Color-coded representation of risk intensity across regions or sectors.
Impact Chains: Trace how a macro event propagates through industries and markets.
Applications:
Communicating macro risks to stakeholders.
Designing risk mitigation strategies.
Resource allocation for risk management initiatives.
4.4 Leading-Lagging Indicator Technique
This technique uses the relationship between leading and lagging indicators to forecast macroeconomic trends.
Leading Indicators: Predict future economic activity (e.g., stock indices, PMI, consumer confidence).
Lagging Indicators: Confirm trends (e.g., employment, wages, industrial production).
Applications:
Anticipating recessions or growth cycles.
Adjusting investment strategies based on economic signals.
Timing corporate expansions or contractions.
4.5 Expert Judgment and Delphi Technique
In uncertain macroeconomic environments, expert opinion can supplement quantitative models.
Delphi Method: Iterative consultation with experts to reach consensus forecasts.
Scenario Workshops: Experts develop and test plausible macroeconomic scenarios.
Applications:
Evaluating geopolitical risks.
Assessing regulatory changes and policy shifts.
Enhancing qualitative inputs to decision-making models.
4.6 Macroeconomic Stress Indices
Specialized indices provide consolidated measures of macro risk.
Economic Policy Uncertainty Index: Tracks uncertainty in government policies.
Financial Stress Index: Measures stress in banking, credit, and financial markets.
Geopolitical Risk Index: Quantifies the potential impact of political events.
Applications:
Monitoring systemic risk over time.
Incorporating macro risk into portfolio allocation.
Benchmarking macroeconomic conditions across countries.
5. Integrating Tools and Techniques
Macro risk analysis is most effective when tools and techniques are integrated.
Multi-factor Models: Combine economic indicators, stress tests, and financial simulations.
Real-time Dashboards: Integrate big data, AI models, and macro indices for continuous monitoring.
Scenario-based Planning: Use stress tests and scenario analysis together to prepare for extreme events.
Risk Governance: Establish structured frameworks to act on insights from macro risk analysis.
6. Challenges in Macro Risk Analysis
While macro risk analysis is essential, it faces several challenges:
Data Limitations: Incomplete or inaccurate macroeconomic data.
Model Risk: Over-reliance on models may miss black swan events.
Global Interconnections: Complexity of interdependent global markets.
Behavioral Factors: Human decision-making and market sentiment can defy models.
Policy Uncertainty: Sudden regulatory or geopolitical changes can invalidate assumptions.
7. Best Practices for Effective Macro Risk Analysis
Diversification of Tools: Combine qualitative and quantitative approaches.
Continuous Monitoring: Track macroeconomic indicators and market developments regularly.
Scenario Flexibility: Update scenarios as new data emerges.
Cross-functional Collaboration: Engage economists, financial analysts, and strategists.
Integration with Strategy: Embed macro risk analysis in investment, operational, and policy decisions.
8. Conclusion
Macro risk analysis is an indispensable component of modern financial and corporate risk management. Through a combination of traditional economic indicators, advanced statistical models, scenario planning, stress testing, and AI-driven analytics, organizations can identify, quantify, and mitigate risks arising from the broader economic environment. While challenges exist, integrating multiple tools and techniques into a cohesive framework enables investors, policymakers, and businesses to navigate uncertainties, enhance decision-making, and build resilience against systemic shocks.
Introduction to GIFT Nifty India1. Overview of GIFT Nifty India
GIFT Nifty India refers to the trading of the Nifty 50 index derivatives on the GIFT International Financial Services Centre (GIFT IFSC) in Gandhinagar, Gujarat. GIFT IFSC is India’s first international financial hub designed to provide Indian and global investors with world-class financial infrastructure, competitive taxation, and seamless access to global markets.
The GIFT Nifty index allows investors in the IFSC to trade in Nifty 50 derivatives using a framework similar to global financial markets while benefiting from liberalized rules and currency flexibility, such as trading in USD. This makes GIFT Nifty a bridge between India’s domestic equity markets and global financial players.
2. Historical Background
The GIFT City initiative was conceptualized in 2007, with the vision to create an international financial hub in India, similar to Singapore, Dubai, and Hong Kong. By 2015, the GIFT IFSC was operational, offering a platform for offshore trading, banking, and insurance services.
The introduction of GIFT Nifty derivatives was a significant step towards enabling global investors to participate in Indian equity markets while trading from a tax-friendly and internationally regulated hub. The Securities and Exchange Board of India (SEBI) and the International Financial Services Centres Authority (IFSCA) played a critical role in designing the regulatory framework for GIFT Nifty.
3. Key Objectives of GIFT Nifty
GIFT Nifty serves multiple objectives:
Global Access to Indian Markets: Enables foreign investors to trade Indian equity derivatives without entering domestic regulatory constraints.
Currency Flexibility: Allows trades in USD and other approved foreign currencies.
Risk Management: Provides advanced derivative instruments for hedging and speculative purposes.
Market Depth & Liquidity: Enhances liquidity in Indian equities by attracting international capital.
Integration with Global Financial Markets: Promotes India as a financial hub, aligning with international trading standards.
4. Structure of GIFT Nifty
GIFT Nifty is primarily structured around Nifty 50 Index derivatives, which include:
Futures: Contracts obligating the buyer to purchase and the seller to sell the underlying Nifty index at a predetermined price on a future date.
Options: Contracts giving the buyer the right, but not the obligation, to buy (call option) or sell (put option) the Nifty index at a specified price before the contract expires.
4.1 Settlement and Contracts
Currency: USD or other approved foreign currencies.
Settlement: Cash-settled, avoiding the need for physical delivery.
Contract Size: Typically aligned with domestic Nifty contracts but adjusted for international standards.
Trading Hours: Extended hours to facilitate global investor participation.
5. Regulatory Framework
The GIFT IFSC operates under a unique regulatory ecosystem:
IFSCA Regulations: IFSCA is the primary regulator for financial activities in GIFT IFSC, offering flexibility in market operations.
SEBI Oversight: Domestic regulations for securities derivatives still influence contract specifications.
Tax Benefits: Offshore investors enjoy competitive tax rates compared to domestic markets, promoting global participation.
This combination of regulatory oversight ensures transparency, investor protection, and alignment with international best practices.
6. Trading Mechanism
GIFT Nifty trades through an electronic trading platform similar to NSE and BSE in India but tailored for offshore participants.
6.1 Participants
Foreign Institutional Investors (FIIs)
Non-Resident Indians (NRIs)
Global Hedge Funds and Asset Managers
International Banks
6.2 Order Types
Limit Orders: Buy or sell at a specified price.
Market Orders: Buy or sell at the current market price.
Advanced Order Types: Stop-loss, bracket orders, and algorithmic trading for sophisticated participants.
6.3 Clearing and Settlement
GIFT Nifty derivatives are cash-settled, meaning profits and losses are transferred in cash. Clearing is facilitated by GIFT IFSC-based clearing corporations, ensuring minimal counterparty risk.
7. Risk Management in GIFT Nifty
Trading Nifty derivatives inherently involves market risk, but GIFT IFSC offers advanced risk management frameworks:
Margin Requirements: Participants must maintain margins to mitigate default risks.
Position Limits: Regulatory limits on positions prevent excessive speculation.
Volatility Controls: Circuit breakers and price bands reduce the impact of sudden market movements.
Hedging: Institutional investors often use GIFT Nifty for hedging exposure in domestic Indian markets or international portfolios.
8. Importance for Investors
8.1 For Domestic Investors
Access to offshore markets without leaving India.
Exposure to USD-denominated Nifty derivatives.
Tax efficiency for international trades.
8.2 For Global Investors
Direct exposure to India’s top 50 listed companies.
Flexibility to hedge or speculate using advanced derivatives.
Participation in India’s economic growth story through a regulated, secure platform.
9. Advantages of GIFT Nifty
Global Participation: Enables investors worldwide to trade Indian indices without domestic account constraints.
Liquidity Enhancement: Additional trading volumes increase market depth.
Currency Diversification: Trading in USD or other approved currencies provides an alternative to INR exposure.
Tax Benefits: Offshore tax rules are generally more favorable.
Infrastructure: State-of-the-art trading technology ensures seamless execution.
10. Challenges and Considerations
Despite its advantages, GIFT Nifty comes with certain challenges:
Market Awareness: Global investors need awareness about India-specific market nuances.
Currency Risk: Trading in foreign currencies exposes participants to exchange rate volatility.
Regulatory Complexity: Understanding the dual oversight by SEBI and IFSCA is crucial.
Liquidity Differences: Offshore liquidity may be lower than domestic NSE/BSE markets initially.
Conclusion
GIFT Nifty India represents a milestone in India’s financial evolution, combining domestic equity strength with international trading standards. It provides a platform for global and domestic investors to participate in India’s equity market in a regulated, tax-efficient, and technologically advanced environment.
By bridging the gap between domestic and international markets, GIFT Nifty contributes to liquidity, market depth, and India’s vision of becoming a global financial hub. Its success relies on awareness, liquidity development, continuous innovation, and integration with global financial trends.
In essence, GIFT Nifty India is not just a trading instrument; it is a symbol of India’s growing economic and financial maturity, offering opportunities for risk management, investment, and strategic growth for participants worldwide.

Smart Money Secrets: for Traders and Investors1. Understanding Smart Money
1.1 Definition
Smart money is the capital invested by market participants who are considered well-informed and have access to insights not readily available to the average investor. This includes hedge funds, institutional investors, central banks, and professional traders.
1.2 Characteristics of Smart Money
Trades based on research and analysis rather than emotions.
Moves in large volumes, which can create or absorb market liquidity.
Often enters and exits positions before major price movements become apparent to the public.
Employs risk management techniques to protect capital.
1.3 Types of Smart Money
Institutional investors: Pension funds, insurance companies, and mutual funds.
Hedge funds: Aggressive and opportunistic traders who exploit inefficiencies.
Corporate insiders: Executives and directors with insight into company performance.
High-net-worth individuals: Wealthy investors with access to sophisticated tools.
2. The Psychology of Smart Money
2.1 Market Sentiment vs. Smart Money
Retail investors often follow trends driven by fear and greed. Smart money, in contrast, takes contrarian positions when market sentiment becomes extreme. Recognizing these psychological patterns is key to understanding smart money behavior.
2.2 Contrarian Mindset
Smart money often profits by going against the crowd. When retail investors panic-sell, smart money accumulates. When retail investors euphorically buy, smart money may reduce exposure.
2.3 Patience and Discipline
Unlike retail traders seeking quick profits, smart money emphasizes long-term strategy, waiting for the optimal entry and exit points while minimizing emotional decisions.
3. Identifying Smart Money Movements
3.1 Volume Analysis
Large transactions often indicate the presence of smart money. Unusual spikes in volume, especially during consolidations or breakouts, suggest accumulation or distribution.
3.2 Price Action
Accumulation phase: Prices remain steady while smart money accumulates.
Markup phase: Prices rise sharply once accumulation reaches critical mass.
Distribution phase: Smart money starts selling at higher prices, signaling potential market reversal.
3.3 Open Interest and Futures Markets
Tracking futures and options open interest can reveal where smart money is positioning itself, especially in index derivatives.
3.4 Insider Activity
Corporate filings, insider buying, and regulatory disclosures often provide insight into the intentions of institutional investors.
4. Smart Money Trading Strategies
4.1 Trend Following
Smart money often identifies long-term trends early and rides them while retail investors react late. Using moving averages, trendlines, and market structure analysis can help retail traders follow this strategy.
4.2 Contrarian Trading
Taking positions opposite to extreme market sentiment allows traders to mirror smart money’s contrarian approach. Tools include:
Fear & Greed Index
Sentiment surveys
Overbought/oversold technical indicators
4.3 Liquidity Seeking
Smart money looks for liquidity to enter and exit positions efficiently. Retail traders can observe support/resistance zones, order blocks, and volume clusters to anticipate these movements.
4.4 Risk Management Techniques
Smart money is meticulous about risk:
Position sizing according to volatility
Stop-loss and take-profit discipline
Portfolio diversification
Hedging through options and derivatives
5. Tools to Track Smart Money
5.1 Volume Profile
Analyzing the distribution of volume at different price levels reveals where smart money accumulates or distributes positions.
5.2 Commitment of Traders (COT) Report
Weekly reports by the Commodity Futures Trading Commission show positions of institutional traders in futures markets.
5.3 Dark Pools
These are private exchanges where large blocks of shares are traded without impacting the market price. Observing dark pool activity helps identify hidden smart money movements.
5.4 Order Flow and Level II Data
Real-time order book analysis shows buy/sell pressure, helping traders spot smart money activity.
6. The Role of News and Information
6.1 Information Asymmetry
Smart money benefits from superior research, analyst reports, and early access to economic data. Retail traders can mimic this by using:
Economic calendars
Corporate earnings reports
Global geopolitical news
6.2 Market Manipulation Awareness
Smart money may sometimes influence sentiment to create favorable trading conditions. Understanding rumors, headlines, and sudden price swings can reveal manipulative setups.
7. Common Mistakes Retail Traders Make
7.1 Chasing the Market
Retail traders often enter trades after prices have already moved significantly, missing smart money accumulation phases.
7.2 Ignoring Risk Management
Without strict stop-losses and position sizing, retail traders are vulnerable to sudden reversals caused by smart money activity.
7.3 Emotional Trading
Fear, greed, and FOMO (fear of missing out) cause retail traders to act impulsively, while smart money trades systematically.
7.4 Misreading Technical Signals
Retail traders may over-rely on lagging indicators without understanding the underlying smart money context.
8. Practical Ways to Trade Like Smart Money
8.1 Follow the Volume
Pay attention to unusually high volume on price consolidations and breakouts.
8.2 Identify Support and Resistance
Smart money often enters near strong support levels and exits near resistance zones.
8.3 Use Multiple Time Frames
Smart money thinks long-term, but retail traders often focus on short-term charts. Combining higher and lower time frames can reveal accumulation and distribution phases.
8.4 Leverage Risk Management Tools
Smart money always protects capital; stop-losses, position sizing, and diversification are crucial for sustainable trading.
8.5 Patience and Observation
Wait for clear signs of accumulation or distribution before taking positions. Impulsive trades rarely follow smart money logic.
9. Advanced Concepts
9.1 Wyckoff Method
A method focused on accumulation, markup, distribution, and markdown phases, providing a framework for identifying smart money moves.
9.2 Order Blocks
Price zones where large institutions enter or exit positions, causing market reactions when revisited.
9.3 Liquidity Voids and Fair Value Gaps
Smart money often exploits these areas to move prices efficiently.
9.4 Sentiment Divergence
Comparing retail trader positioning with price movements can reveal where smart money is operating.
10. Building Your Own Smart Money Strategy
10.1 Research and Analysis
Study institutional filings, economic indicators, and market reports.
Track sector rotation and capital flow.
10.2 Develop a Trading Plan
Define goals, risk tolerance, and trading rules.
Use a combination of technical and fundamental analysis to align with smart money.
10.3 Backtesting and Simulation
Test strategies using historical data.
Refine techniques before committing real capital.
10.4 Continuous Learning
Markets evolve, and smart money adapts. Stay informed, refine methods, and observe institutional behavior over time.
Conclusion
Understanding smart money secrets is about more than copying trades—it’s about observing market structure, sentiment, and capital flows with a critical, analytical mindset. By combining patience, risk management, and the right analytical tools, retail traders can align themselves with the strategies of professional investors, reduce risk, and increase the probability of long-term success. Smart money isn’t just about having more capital—it’s about discipline, insight, and precision in every market move.
Trading Goals & Objectives1. Introduction to Trading Goals
1.1 Definition
Trading goals are specific targets a trader sets to achieve in their trading journey. These goals are measurable, time-bound, and aligned with personal financial objectives. They serve as a roadmap for consistent growth in the financial markets.
1.2 Importance of Setting Goals
Direction: Goals provide a clear path in the complex world of trading.
Motivation: Traders are motivated to maintain discipline and stick to strategies.
Performance Tracking: Enables assessment of progress and adjustments in strategies.
Risk Management: Helps in defining risk thresholds and avoiding impulsive decisions.
2. Types of Trading Goals
Trading goals can vary based on time horizon, financial objectives, and risk tolerance. Understanding these types allows traders to prioritize effectively.
2.1 Short-term Goals
Definition: Targets achievable within days, weeks, or a few months.
Examples:
Achieving a 5% monthly return on investment.
Improving trade execution speed and accuracy.
Benefits: Provides quick feedback, enhances learning, and builds confidence.
2.2 Medium-term Goals
Definition: Targets achievable within 6 months to 2 years.
Examples:
Building a consistent monthly profit record.
Developing and mastering specific trading strategies.
Benefits: Encourages refinement of trading skills and adaptation to market dynamics.
2.3 Long-term Goals
Definition: Targets achievable over 3 years or more.
Examples:
Accumulating a significant trading portfolio.
Reaching financial independence through trading.
Benefits: Focuses on sustainable growth and wealth accumulation.
3. Financial Objectives in Trading
Setting clear financial objectives is a core aspect of trading goals. These objectives are usually quantifiable and define what success looks like.
3.1 Capital Growth
Objective: Increase the trading account over a specific period.
Strategy: Focus on high-probability trades and compounding returns.
3.2 Income Generation
Objective: Generate a consistent monthly or quarterly income.
Strategy: Utilize strategies like swing trading, dividend capture, or conservative day trading.
3.3 Preservation of Capital
Objective: Minimize losses and protect the principal amount.
Strategy: Employ strict risk management, stop-loss orders, and low-risk strategies.
3.4 Diversification
Objective: Spread investments across asset classes, sectors, or trading instruments.
Strategy: Combine stocks, futures, forex, options, and commodities to reduce risk.
4. Non-Financial Objectives in Trading
Trading goals are not only about money—they also involve skill development, psychological mastery, and strategic growth.
4.1 Skill Development
Learn technical analysis, fundamental analysis, and algorithmic trading.
Improve decision-making under market pressure.
4.2 Emotional Control
Develop patience, discipline, and emotional resilience.
Avoid impulsive trading and manage stress during market volatility.
4.3 Strategy Optimization
Refine trading systems and adapt to changing market conditions.
Maintain a journal to track patterns, mistakes, and profitable strategies.
4.4 Networking & Knowledge Growth
Join trading communities, seminars, and mentorship programs.
Share insights and learn from the experiences of professional traders.
5. SMART Framework for Trading Goals
To be effective, trading goals should follow the SMART criteria:
5.1 Specific
Goals should be clear and unambiguous.
Example: “I want to earn 10% monthly from my equity trades.”
5.2 Measurable
Success must be quantifiable.
Example: Track ROI, win-loss ratio, or average profit per trade.
5.3 Achievable
Goals should be realistic based on experience, capital, and market conditions.
Avoid overly ambitious targets that increase emotional stress.
5.4 Relevant
Goals should align with long-term financial and personal objectives.
Example: For a student, risk exposure should be moderate; for a professional trader, aggressive strategies might be relevant.
5.5 Time-bound
Goals should have deadlines for completion.
Example: Achieve 25% account growth within 12 months.
6. Risk and Money Management Objectives
6.1 Risk Tolerance Assessment
Understand personal risk appetite: conservative, moderate, or aggressive.
Adjust trade size, leverage, and stop-loss levels accordingly.
6.2 Position Sizing
Define how much capital to allocate per trade.
Prevents overexposure to a single market or asset.
6.3 Loss Limits
Set maximum daily, weekly, or monthly loss limits.
Example: Stop trading for the day if losses exceed 2% of total capital.
7. Performance Metrics and Objectives
Tracking progress requires clear metrics:
7.1 Win Rate
Percentage of profitable trades compared to total trades.
Helps measure consistency.
7.2 Risk-Reward Ratio
Evaluates if the potential reward justifies the risk.
Ideal ratio: at least 1:2 or higher.
7.3 Drawdown Management
Measures peak-to-trough losses.
Critical for understanding capital preservation.
7.4 Trade Frequency and Volume
Monitors the number of trades executed.
Avoid overtrading, which can increase costs and stress.
8. Setting Realistic Expectations
8.1 Market Volatility
Understand that markets are unpredictable.
Adjust goals based on volatility, economic events, and news.
8.2 Learning Curve
Accept that mistakes are part of the process.
Early losses do not reflect future potential if disciplined trading is maintained.
8.3 Capital Limitations
Goals must consider account size and available resources.
Compounding works gradually; patience is key.
9. Psychological and Behavioral Goals
9.1 Discipline
Stick to strategies and avoid impulsive decisions.
Discipline reduces the influence of fear and greed.
9.2 Patience
Wait for high-probability trade setups.
Avoid chasing markets or entering trades prematurely.
9.3 Self-Awareness
Recognize emotional triggers.
Maintain journaling and reflective practices to enhance self-awareness.
9.4 Stress Management
Incorporate routines like meditation, exercise, and breaks.
A calm mind improves decision-making and reduces costly mistakes.
10. Continuous Evaluation and Adaptation
10.1 Review Trading Journal
Track performance, strategies, and emotional responses.
Identify patterns and adjust objectives as necessary.
10.2 Adjust Goals Periodically
Market conditions, experience, and capital levels change over time.
Update goals quarterly or annually to reflect realistic targets.
10.3 Learning from Mistakes
Analyze losing trades without emotional bias.
Turn errors into opportunities for improvement.
Conclusion
Trading goals and objectives are the cornerstone of successful trading. They provide:
Clarity: Clear targets help traders navigate complex markets.
Discipline: Enforces consistent strategies and avoids emotional pitfalls.
Growth: Encourages continuous learning, skill improvement, and wealth accumulation.
A trader without goals is like a ship adrift; a trader with clear objectives charts a purposeful course, adjusts to market turbulence, and steadily moves toward financial success.
Ultimately, trading is a journey of self-discipline, strategic thinking, and continuous growth. Goals transform this journey from a chaotic venture into a structured, measurable, and rewarding pursuit.
Gold – Channel Support Holding, Upside Target Towards 3770Gold is trading within a well-defined ascending channel on the 15-min chart. Price action has repeatedly respected both support and resistance lines, which makes this pattern highly reliable in the short term. Currently, the price is bouncing from the lower channel support and holding firmly above the 3740–3743 zone. As long as this support area is protected, the bullish momentum remains intact and the next upside target comes in around 3770, aligning with the channel resistance. A breakout above 3770 could trigger an even stronger rally, while a failure to hold below 3733 would invalidate the setup and shift the bias to the downside.
Disclaimer: This analysis is for educational purposes only and should not be taken as financial advice. Please do your own research or consult your financial advisor before investing.
Analysis By @TraderRahulPal (TradingView Moderator) | More analysis & educational content on my profile
👉 If you found this helpful, don’t forget to like and follow for regular updates.
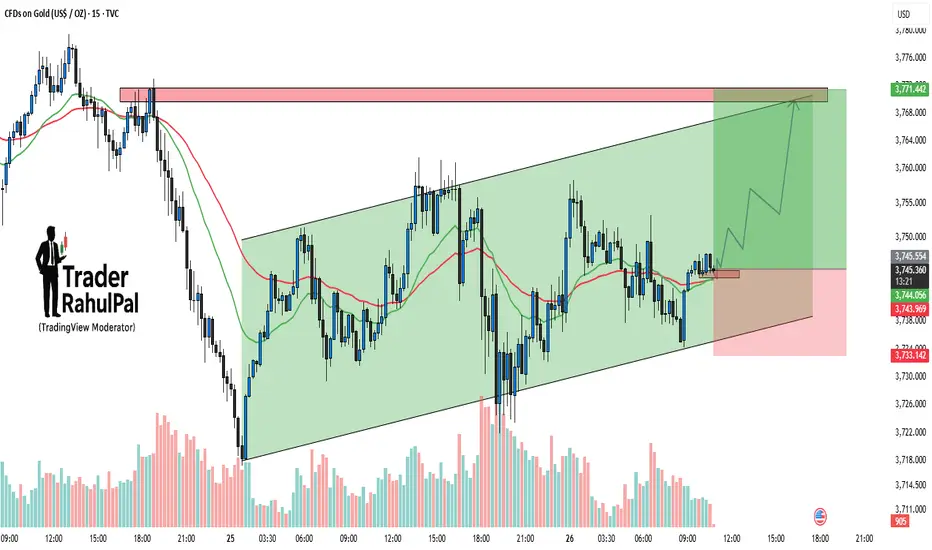
Trading Master Class With Experts1. What Are Options?
Options are financial contracts that give traders the right, but not the obligation, to buy or sell an asset (like stocks, indices, or commodities) at a pre-decided price within a specific time frame. Unlike shares, which represent ownership, options are derivatives whose value comes from the price of the underlying asset.
Call Option → Right to buy at a fixed price.
Put Option → Right to sell at a fixed price.
This flexibility makes options useful for speculation, hedging, and income strategies.
2. Key Terminologies in Options
To trade options, one must understand the language of the market:
Strike Price → The price at which the option buyer can buy/sell the underlying.
Premium → The cost paid to buy an option.
Expiry Date → The last date the option can be exercised.
In-the-Money (ITM) → Option has intrinsic value (profitable if exercised now).
Out-of-the-Money (OTM) → No intrinsic value (worthless if exercised now).
Mastering these terms is crucial to avoid confusion while trading.
3. How Option Trading Works
Let’s simplify with an example:
Suppose Reliance stock is trading at ₹2,500. You buy a Call Option with a strike price of ₹2,600 by paying a premium of ₹50.
If Reliance rises to ₹2,700, your option value increases (you gained ₹100 – ₹50 = ₹50 profit).
If Reliance stays below ₹2,600, your option expires worthless, and you lose only the premium (₹50).
This shows how options can provide high reward with limited risk.
4. The Players in Option Trading
There are two main participants:
Option Buyers → Pay a premium, have limited risk but unlimited profit potential.
Option Sellers (Writers) → Receive premium, have limited profit but unlimited risk exposure.
Example: If you sell a call option and the stock skyrockets, your losses can be massive. That’s why option writing requires deep knowledge and strong risk management.
5. Benefits of Option Trading
Why do traders choose options over stocks?
Leverage → Control a large value of assets with small capital (premium).
Hedging → Protects portfolios from sudden market crashes.
Flexibility → Can profit in bullish, bearish, or even sideways markets.
Defined Risk for Buyers → Maximum loss is only the premium paid.
This versatility makes options a favorite tool among professional traders.
6. Risks Involved in Option Trading
Though attractive, options are not risk-free:
Time Decay (Theta) → Option value reduces as expiry approaches, even if stock price doesn’t move.
High Volatility → Sudden market swings can cause rapid premium erosion.
Unlimited Loss for Sellers → Writers can lose far more than the premium received.
Complex Pricing → Influenced by multiple factors (volatility, time, demand-supply).
Hence, proper strategy and discipline are vital.

Part 7 Trading Master Class1. Risk Management in Options Trading
Risk is both the biggest appeal and the biggest danger in options trading. Without proper risk management, traders can face massive losses.
Key practices include:
Position Sizing: Never risking more than a small percentage of capital on a single trade.
Stop-Loss Orders: Exiting positions when losses exceed tolerance levels.
Diversification: Spreading trades across different sectors or instruments.
Hedging: Using options not for speculation but for protection of a stock portfolio.
Awareness of Leverage: Remembering that leverage can magnify both gains and losses.
Professional traders always prioritize risk management over profit chasing.
2. Role of Options in Hedging and Speculation
Options serve dual purposes:
Hedging
Companies hedge currency risks using currency options.
Investors hedge stock portfolios by buying index puts.
Commodity traders hedge raw material costs with commodity options.
Speculation
Traders can take leveraged bets on short-term price movements.
Bullish traders buy calls; bearish traders buy puts.
Volatility traders deploy straddles/strangles to benefit from sharp moves.
This dual nature — protection and profit — makes options invaluable across markets.
3. Options in Global and Indian Markets
Globally, option trading is massive. Exchanges like CBOE (Chicago Board Options Exchange) pioneered listed options. The U.S. markets dominate in volume and liquidity.
In India, options gained traction after NSE introduced index options in 2001. Today:
Nifty and Bank Nifty options are among the most traded derivatives worldwide.
Stock options are actively traded with physical settlement.
Weekly expiry contracts have boosted retail participation.
India is now among the top markets for derivatives trading globally.
4. Challenges, Risks, and Common Mistakes
Despite their potential, option trading is not easy. Challenges include:
Complexity: Requires understanding of pricing models and Greeks.
High Risk for Sellers: Unlimited potential losses.
Time Decay: Buyers must be right not only about direction but also timing.
Liquidity Issues: Illiquid contracts can result in slippage.
Common mistakes traders make:
Overleveraging with large positions.
Ignoring Greeks and volatility.
Trading without a defined plan or exit strategy.
Chasing profits without managing risk.
Awareness of these pitfalls is crucial for long-term success.
5. The Future of Option Trading and Final Thoughts
The world of options is evolving rapidly. With technology, AI-driven strategies, and algorithmic trading, options are becoming more accessible and efficient. Platforms now offer retail traders tools once exclusive to institutions.
In India, the increasing popularity of weekly options and innovations like zero brokerage discount brokers have democratized option trading. Globally, options tied to cryptocurrencies and ETFs are gaining popularity.
However, while opportunities expand, the fundamentals remain unchanged: options are powerful, but they demand respect, knowledge, and discipline.
In conclusion, option trading is not just about making fast money. It’s about using financial intelligence to structure trades, manage risks, and optimize outcomes in an uncertain market.

Part 6 Learn Institutional Trading 1. The Mechanics of Option Trading
Option trading involves two primary participants: buyers and sellers (writers).
Option Buyer: Pays the premium upfront. Has limited risk (only the premium can be lost) but unlimited potential gain (in case of call options) or substantial downside protection (in case of puts).
Option Seller (Writer): Receives the premium. Has limited potential gain (only the premium) but carries significant risk if the market moves against the position.
Trading mechanics also include:
Margin Requirements: Sellers need to deposit margins since their risk is higher.
Lot Size: Options are traded in lots rather than single shares. For example, Nifty options have a standard lot size of 25 contracts.
Liquidity: High liquidity in options ensures tighter spreads and better price execution.
Settlement: Options can be cash-settled (index options in India) or physically settled (individual stock options in India post-2019 reforms).
The actual trading process involves analyzing the market, selecting strike prices, and deciding whether to buy or sell calls/puts depending on the outlook.
2. Option Pricing and the Greeks
One of the most fascinating aspects of option trading is pricing. Unlike stocks, which are priced directly by supply and demand, option prices are influenced by multiple factors.
The Black-Scholes model and other pricing models take into account:
Intrinsic Value: The real value of an option if exercised today.
Time Value: Extra premium based on time left until expiry.
Volatility: Higher expected volatility raises option premiums.
The Greeks
Option traders rely heavily on the Greeks, which measure sensitivity to different market factors:
Delta: Measures how much an option price changes with a ₹1 change in the underlying asset.
Gamma: Measures how delta itself changes with the price movement.
Theta: Time decay; options lose value as expiry nears.
Vega: Sensitivity to volatility.
Rho: Sensitivity to interest rates.
Understanding these allows traders to manage risk more effectively and structure trades in line with their market views.
3. Types of Option Strategies: From Basics to Advanced
Options allow for simple trades as well as complex multi-leg strategies.
Basic Strategies:
Buying Calls (bullish).
Buying Puts (bearish).
Covered Call (own stock + sell call).
Protective Put (own stock + buy put).
Intermediate Strategies:
Bull Call Spread (buy lower strike call, sell higher strike call).
Bear Put Spread (buy put, sell lower strike put).
Straddle (buy call + buy put at same strike).
Strangle (buy out-of-money call + put).
Advanced Strategies:
Iron Condor (combination of spreads to profit from low volatility).
Butterfly Spread (low-risk, low-reward strategy).
Calendar Spread (buy long-term option, sell short-term).
Each strategy has a defined risk-reward profile, making options unique compared to outright stock trading.
