PCR Trading Strategies1. The Psychology of Option Trading
Options magnify emotions: greed (unlimited gains) and fear (time decay, sudden loss). Many traders lose due to overleveraging, chasing cheap OTM options, or not respecting stop-loss. Psychological discipline is as vital as technical knowledge.
2. Option Chain Analysis
An option chain shows all available strikes, premiums, OI (open interest), IV, etc. Traders analyze max pain, OI build-up, and put-call ratio (PCR) to gauge market sentiment. Option chains are powerful tools for directional and volatility analysis.
3. Role of Market Makers in Options
Market makers provide liquidity by quoting bid-ask spreads. They profit from spreads and hedging but ensure smoother trading. Without them, option spreads would widen, making it harder for retail traders to enter/exit efficiently.
4. Index Options vs Stock Options
Index Options (e.g., Nifty, Bank Nifty): Cash-settled, high liquidity, lower manipulation risk.
Stock Options: Physical settlement (delivery), less liquid, but higher potential returns.
Retail traders prefer index options; institutions often hedge with stock options.
5. Option Writing as a Business
Many professional traders treat option writing like a business: selling high IV options, hedging risk, managing spreads. Profits come steadily from time decay, but big moves can wipe out capital if risk isn’t managed with stop-loss or hedges.
6. Options and Event Trading
Events like earnings, RBI policy, budget, elections, or global news drastically affect IV. Traders buy straddles/strangles pre-event, and sellers wait for IV crush post-event. Understanding event volatility cycles is key.
7. Taxation of Options Trading in India
Profits from option trading are treated as business income under Indian tax law. Traders must maintain proper records, pay GST in some cases, and file ITR with audit if turnover exceeds limits. This is often ignored by beginners.
8. Technology and Algo in Options
With algo trading, institutions dominate options using complex models (volatility arbitrage, delta-hedging). Retail traders now use option analytics platforms, scanners, and automation tools to compete. Speed and data-driven execution matter more today.
9. Common Mistakes in Option Trading
Buying cheap OTM lottery tickets.
Ignoring IV crush.
Selling naked options without hedge.
Overtrading on expiry days.
Neglecting stop-loss and money management.
Most retail losses come from these errors.
10. The Future of Option Trading
Option trading is growing rapidly in India with weekly expiries, retail participation, and technology. Innovations like zero-day options (0DTE) in the US may come to India. Education, discipline, and structured strategies will define success. The future promises wider accessibility but higher competition as retail meets institutional algos
Contains image

Part 2 Support and Resistance1. Time Decay (Theta) in Action
Time decay erodes option premiums daily, faster near expiry. Example: An option priced ₹50 with 10 days left may lose ₹5 daily if underlying doesn’t move. This favors option sellers (who benefit from decay) and hurts option buyers (who need timely moves).
2. Volatility’s Influence on Options
Volatility is the heartbeat of option trading:
Implied Volatility (IV): Future expected volatility, priced into options.
Historical Volatility (HV): Past realized volatility.
If IV is high, premiums rise (good for sellers). Sudden IV drops after events (e.g., budget, results) can crush option buyers despite correct direction.
3. Advantages of Options Trading
Limited risk for buyers.
Lower capital requirement vs. buying stock.
Leverage enhances returns.
Hedging against market risk.
Multiple strategies for bullish, bearish, and neutral views.
This flexibility attracts both traders and investors.
4. Risks of Options Trading
Sellers face unlimited loss risk.
Buyers suffer time decay.
Sudden volatility crush (IV crash).
Complexity of Greeks.
Low liquidity in some stock options.
New traders often underestimate these risks.
5. Option Trading vs Futures Trading
Futures = Obligation to buy/sell at a fixed price.
Options = Right, not obligation.
Futures have linear P/L; options have asymmetric P/L.
Options require deeper risk management (Greeks, IV).
Both can be used together for hedging and speculation.
6. Single-Leg Option Strategies
Long Call: Bullish with limited risk.
Long Put: Bearish with limited risk.
Covered Call: Holding stock + selling call for income.
Protective Put: Holding stock + buying put for downside hedge.
These are basic building blocks.
7. Multi-Leg Option Strategies
Advanced traders combine options for defined outcomes:
Straddle: Buy call + put ATM → volatile move expected.
Strangle: Buy OTM call + OTM put → cheaper volatility bet.
Butterfly Spread: Limited risk, limited reward, range-bound outlook.
Iron Condor: Sell strangle + buy protection → income from low volatility.
8. Hedging with Options
Options allow investors to protect portfolios. Example: A mutual fund holding Nifty stocks can buy Nifty Puts to protect against a sudden crash. Farmers hedge crop prices with commodity options. Hedging reduces risk but costs premium.
9. Options in Intraday Trading
In India, options are heavily used for intraday speculation, especially in Nifty & Bank Nifty weekly contracts. Traders scalp premium moves, delta-neutral setups, or expiry-day theta decay. However, intraday option trading requires discipline due to extreme volatility.
10. Options in Swing and Positional Trading
Swing traders use options to play earnings results, events, or trends. Positional traders might use debit spreads (low risk) or credit spreads (income). Longer-dated options (LEAPS) are used for investment-style plays.

Part 1 Support and Resistance1. Introduction to Options Trading
Options are financial derivatives that give traders the right, but not the obligation, to buy (Call Option) or sell (Put Option) an underlying asset at a pre-decided price (strike price) within a specific time frame. Unlike shares where you own the asset, options provide flexibility to speculate, hedge, or generate income. Options derive their value from underlying assets like stocks, indices, commodities, or currencies, making them versatile but also complex.
2. The Nature of an Option Contract
Each option contract has four key elements:
Underlying Asset (e.g., Reliance stock, Nifty index).
Strike Price (predetermined buy/sell level).
Premium (price paid to buy the option).
Expiration Date (last valid trading day).
This structure allows traders to choose different risk/reward setups, unlike shares where profit and loss move linearly with price.
3. Call Options Explained
A Call Option gives the buyer the right to purchase the underlying asset at the strike price. For example, buying a Nifty 20,000 Call at ₹100 means you expect Nifty to rise above 20,100 (strike + premium). If it rises, profit potential is unlimited, but loss is capped at ₹100 (the premium paid). This asymmetry makes calls powerful for bullish strategies.
4. Put Options Explained
A Put Option gives the buyer the right to sell the underlying asset at the strike price. Example: buying a TCS ₹3500 Put at ₹80 means you profit if TCS falls below ₹3420 (strike – premium). Put buyers use it for bearish bets or hedging existing long positions. Loss is capped to premium, profit grows as price declines.
5. The Role of Option Writers (Sellers)
Every option has two sides: the buyer and the seller (writer). Writers receive the premium but take on significant obligations. A call writer must sell at strike price if exercised; a put writer must buy. Sellers have limited profit (premium received) but potentially unlimited losses (especially in calls). Option writers dominate because most options expire worthless, but the risk is substantial.
6. Intrinsic Value and Time Value
An option’s premium has two parts:
Intrinsic Value (IV): Actual profit if exercised now. Example: Reliance at ₹2600, Call strike at ₹2500 → IV = ₹100.
Time Value (TV): Extra premium due to potential future price movement. Near expiry, TV decays (time decay).
Understanding IV and TV is crucial for identifying overvalued/undervalued options.
7. Option Expiry and Settlements
Options in India (like Nifty, Bank Nifty) have weekly and monthly expiries. Stock options have monthly expiries. On expiry, in-the-money (ITM) options settle in cash (difference between spot and strike). Out-of-the-money (OTM) expire worthless. Expiry days often see volatile moves as traders adjust positions.
8. The Concept of Moneyness
Options are classified by their relation to the spot price:
In the Money (ITM): Strike favorable (e.g., Call strike below spot).
At the Money (ATM): Strike = spot.
Out of the Money (OTM): Strike unfavorable (e.g., Call above spot).
Moneyness influences premium, risk, and probability of profit.
9. Option Premium Pricing Factors
Option premium is influenced by:
Spot Price of the underlying.
Strike Price.
Time to Expiry.
Volatility (Implied & Historical).
Interest Rates and Dividends.
The Black-Scholes model and other pricing models quantify these variables, but in practice, demand-supply and implied volatility dominate.
10. The Greeks – Risk Management Tools
Option traders use Greeks to measure risk:
Delta: Sensitivity to underlying price.
Gamma: Rate of change of Delta.
Theta: Time decay impact.
Vega: Sensitivity to volatility changes.
Rho: Sensitivity to interest rates.
Greeks help traders build and manage complex strategies.

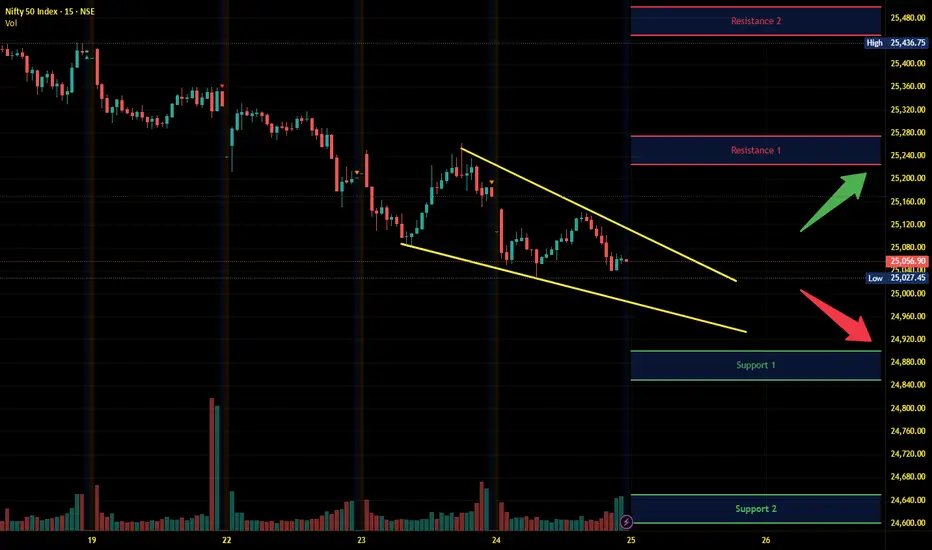
Nifty Intraday Analysis for 25th September 2025NSE:NIFTY
Index has resistance near 25225 – 25275 range and if index crosses and sustains above this level then may reach near 25450 – 25500 range.
Nifty has immediate support near 24900 – 24850 range and if this support is broken then index may tank near 24650 – 24600 range.
Option trading 1. What Are Options?
Options are financial contracts that give you the right, but not the obligation, to buy or sell an underlying asset (like a stock, index, or commodity) at a fixed price (strike price) within a certain time period.
Call Option → Right to buy the asset.
Put Option → Right to sell the asset.
👉 You pay a premium to purchase the option.
2. Key Terms in Options
Strike Price: The fixed price at which you can buy/sell the asset.
Premium: The cost of buying the option (like an entry fee).
Expiry Date: Last date the option can be exercised.
In the Money (ITM): Option has profit value.
Out of the Money (OTM): Option has no intrinsic profit value.
Lot Size: Options are traded in fixed quantities, not single shares.
3. How Options Work (Example)
Imagine Reliance stock = ₹2,500.
You buy a Call Option with strike = ₹2,600, expiry in 1 month, premium = ₹50.
If Reliance rises to ₹2,700 before expiry:
You can buy at ₹2,600, sell at ₹2,700 → Profit = ₹100 – ₹50 premium = ₹50.
If Reliance stays below ₹2,600, you don’t exercise → Loss = Premium ₹50.
This way, risk is limited to the premium, but potential profit can be much larger.
4. Types of Option Trading
Buying Calls/Puts → Simple strategy, limited risk.
Writing (Selling) Options → You receive premium but face higher risk.
Spreads & Strategies → Combining multiple options to control risk/reward. Examples:
Bull Call Spread
Bear Put Spread
Straddle
Iron Condor
5. Why Traders Use Options?
Hedging → To protect against losses in existing positions.
Speculation → To bet on price movements with limited capital.
Leverage → Small premium controls large value of stock.
Income → Option sellers earn premium regularly.
6. Pros & Cons of Options
✅ Advantages:
Limited risk (for buyers).
Lower capital needed than buying stocks directly.
Flexible strategies in rising, falling, or sideways markets.
❌ Risks/Challenges:
Complex compared to stock trading.
Sellers have unlimited risk.
Time decay → Options lose value as expiry nears.
👉 In short: Option trading is a flexible and powerful tool, but it requires solid knowledge of risk, pricing, and strategies. Beginners usually start by buying simple calls or puts before moving to advanced spreads and hedging techniques.

Part 2 Candle Stick PatternParticipants in Options Trading
Options markets consist of four main participants:
Buyers of Calls – Expect the underlying asset’s price to rise. Risk limited to premium.
Buyers of Puts – Expect the underlying asset’s price to fall. Risk limited to premium.
Sellers (Writers) of Calls – Expect prices to remain below the strike price. Risk is theoretically unlimited for naked calls.
Sellers (Writers) of Puts – Expect prices to remain above the strike price. Risk is substantial if the asset falls sharply.
Options Strategies
Option trading is highly versatile. Traders can employ strategies ranging from conservative hedging to speculative bets:
Covered Call: Holding the underlying asset while selling call options to generate income from premiums.
Protective Put: Buying puts while holding the asset to protect against downside risk.
Straddle: Buying a call and a put with the same strike price and expiration, expecting high volatility.
Strangle: Buying out-of-the-money call and put options for lower cost but with a wider price movement range.
Spreads: Combining multiple options to limit risk and potential profit (e.g., bull call spread, bear put spread).
Option Pricing Factors
Option prices are influenced by several variables:
Underlying Asset Price: Higher asset prices increase call values and decrease put values.
Strike Price: The proximity of the strike to the current asset price affects intrinsic value.
Time to Expiration: More time increases time value and option price.
Volatility: Greater market volatility increases the likelihood of significant price changes, raising premiums.
Interest Rates & Dividends: Rising interest rates increase call values and reduce put values; dividend payouts impact stock options.
The most widely used pricing model is the Black-Scholes Model, which calculates theoretical option prices based on these factors.
Advantages of Option Trading
Leverage: Control a larger position with a smaller capital outlay.
Hedging: Protect portfolios against adverse price movements.
Flexibility: Execute a wide range of strategies for bullish, bearish, or neutral markets.
Defined Risk: Maximum loss for buyers is limited to the premium paid.
Profit in Any Market: Options allow for profit in rising, falling, or sideways markets.
Risks of Option Trading
Options are complex and involve risks:
Premium Loss: Buyers can lose the entire premium if the option expires worthless.
Leverage Risk: While leverage amplifies gains, it also amplifies losses for sellers or advanced strategies.
Time Decay (Theta): Options lose value as expiration nears if the underlying price does not move favorably.
Volatility Risk (Vega): Changes in market volatility affect option prices.
Complexity: Advanced strategies can involve multiple positions and require careful monitoring.

Part 1 Candle Stick Pattern Understanding Option Trading
Option trading is a segment of financial markets that allows investors to buy or sell the right to buy or sell an underlying asset at a predetermined price within a specific time frame. Unlike traditional stock trading, options provide leverage, flexibility, and risk management tools, making them appealing for both hedging and speculative purposes.
Options are derivatives, meaning their value is derived from an underlying asset, such as stocks, indices, commodities, or currencies. An option does not grant ownership of the asset itself but gives the holder the right to engage in a transaction involving the asset.
Types of Options
Options are broadly categorized into two types:
Call Options
A call option gives the buyer the right (but not the obligation) to buy the underlying asset at a specified price, called the strike price, before or on the expiration date.
Buyers of call options generally expect the underlying asset’s price to rise, allowing them to purchase the asset at a lower price than the market value.
Sellers (writers) of call options receive the option premium upfront but take on the obligation to sell the asset if the buyer exercises the option.
Put Options
A put option gives the buyer the right (but not the obligation) to sell the underlying asset at the strike price before or on the expiration date.
Buyers of put options generally expect the underlying asset’s price to fall, allowing them to sell the asset at a higher price than the market value.
Sellers of put options receive the premium but face the obligation to buy the asset if exercised.
Key Components of Options
To understand option trading, one must know the following components:
Underlying Asset – The security or asset on which the option is based (e.g., a stock like Apple or an index like Nifty 50).
Strike Price (Exercise Price) – The predetermined price at which the option can be exercised.
Expiration Date – The date on which the option expires. After this date, the option becomes worthless.
Premium – The price paid by the buyer to the seller for the rights conferred by the option.
Intrinsic Value – The difference between the underlying asset’s current price and the strike price, representing the real, immediate value of the option.
Time Value – The portion of the premium that reflects the possibility of the option gaining value before expiration. Time decay reduces this value as the expiration date approaches.
How Options Work
Let’s illustrate with an example:
Suppose a stock is trading at ₹1,000, and you buy a call option with a strike price of ₹1,050, expiring in one month, paying a premium of ₹20.
If the stock rises to ₹1,100 before expiration, you can exercise the option to buy at ₹1,050, making a profit of ₹50 per share minus the premium, i.e., ₹30 per share.
If the stock stays below ₹1,050, you would not exercise the option, losing only the premium of ₹20.
This example highlights two key advantages of options:
Leverage: You control more assets with less capital compared to buying the stock outright.
Limited Risk: The maximum loss for the buyer is the premium paid, unlike stock trading where losses can be higher.

The Future of Futures Trading1. The Evolution of Futures Trading
1.1 Historical Background
Futures trading traces its roots to the agricultural markets of the 19th century. Farmers and merchants used forward contracts to lock in prices for crops, mitigating the risks of fluctuating market prices. The Chicago Board of Trade (CBOT), founded in 1848, became the first organized marketplace for standardized futures contracts, laying the foundation for modern derivatives trading. Over time, the range of underlying assets expanded to include metals, energy products, financial instruments, and more recently, digital assets such as cryptocurrencies.
1.2 The Role of Futures in Modern Markets
Futures serve multiple purposes in today’s markets:
Hedging: Corporations, financial institutions, and investors use futures to protect against price volatility in commodities, currencies, and financial instruments.
Speculation: Traders aim to profit from short-term price movements.
Arbitrage: Futures contracts enable the exploitation of price differences between markets.
Price Discovery: Futures markets provide transparent, real-time pricing signals that guide investment and production decisions globally.
2. Technological Advancements Shaping Futures Trading
2.1 Algorithmic and High-Frequency Trading
Advances in technology have transformed futures trading by introducing algorithmic and high-frequency trading (HFT). These automated systems execute trades at speeds and volumes impossible for human traders, leveraging complex mathematical models to identify arbitrage opportunities, manage risk, and capture microprice movements. HFT has enhanced market liquidity but also raised concerns regarding market stability and fairness.
2.2 Artificial Intelligence and Machine Learning
Artificial intelligence (AI) and machine learning (ML) are increasingly integrated into futures trading. AI algorithms analyze vast amounts of historical and real-time data, including market sentiment, macroeconomic indicators, and news feeds, to forecast price trends. Machine learning models can adapt to changing market conditions, improving predictive accuracy and decision-making efficiency.
2.3 Blockchain and Distributed Ledger Technology
Blockchain technology promises to revolutionize futures trading by increasing transparency, reducing settlement times, and minimizing counterparty risk. Smart contracts can automate trade execution and settlement, ensuring contracts are fulfilled without intermediaries. Exchanges exploring blockchain-based futures platforms may offer faster, more secure, and cost-effective trading environments.
2.4 Cloud Computing and Big Data Analytics
Cloud computing provides scalable infrastructure for processing large datasets, enabling faster trade execution, risk analysis, and scenario modeling. Big data analytics allows traders and institutions to identify patterns, correlations, and anomalies in real-time, enhancing trading strategies and risk management.
3. Globalization and Market Integration
3.1 Expansion of Emerging Market Futures
Emerging markets, particularly in Asia, Latin America, and Africa, are experiencing rapid growth in futures trading. Countries such as India, China, and Brazil are expanding their derivatives markets to provide hedging tools for commodities, currencies, and financial instruments. This expansion increases liquidity, reduces global price volatility, and provides new opportunities for cross-border investment.
3.2 Cross-Market Connectivity
Technological integration allows futures contracts to be traded across multiple exchanges simultaneously. Cross-market connectivity facilitates global arbitrage opportunities, harmonizes pricing, and enhances capital efficiency. As futures markets become increasingly interconnected, price movements in one market can have immediate implications worldwide.
3.3 Rise of Global Commodity Trading Hubs
Key global hubs such as Chicago, London, Singapore, and Dubai continue to dominate futures trading. However, emerging hubs in Asia and the Middle East are gaining prominence due to growing commodity production, technological investment, and regulatory reforms. These hubs will play a pivotal role in shaping the future of global futures trading.
4. Regulatory Evolution
4.1 Current Regulatory Landscape
Futures trading is heavily regulated to ensure market integrity, transparency, and investor protection. Agencies such as the U.S. Commodity Futures Trading Commission (CFTC), the European Securities and Markets Authority (ESMA), and the Securities and Exchange Board of India (SEBI) oversee futures markets. Regulations cover margin requirements, position limits, reporting obligations, and risk management protocols.
4.2 Emerging Regulatory Trends
The future of futures trading will be influenced by new regulatory trends:
Digital Asset Regulation: As cryptocurrency futures gain popularity, regulators are implementing frameworks to ensure investor protection and prevent market manipulation.
Cross-Border Oversight: Harmonizing global regulatory standards may reduce arbitrage and enhance market stability.
Sustainability and ESG Compliance: Futures markets may introduce products linked to environmental, social, and governance (ESG) benchmarks, responding to investor demand for responsible investment.
4.3 Balancing Innovation and Risk
Regulators face the challenge of balancing innovation with risk management. While technology and product innovation enhance efficiency, they also introduce systemic risks, cybersecurity threats, and potential market abuse. Future regulatory frameworks will need to adapt dynamically, leveraging technology for monitoring and enforcement.
5. The Rise of Retail Participation
5.1 Democratization of Futures Trading
Advances in online trading platforms and mobile technology have democratized access to futures markets. Individual investors now participate alongside institutional traders, using tools and analytics previously reserved for professionals. This shift increases market liquidity and widens participation but also introduces behavioral risks, such as overleveraging and speculative bubbles.
5.2 Education and Risk Management
The surge in retail participation highlights the importance of education. Platforms offering tutorials, simulation tools, and real-time market insights empower retail traders to understand leverage, margin requirements, and risk mitigation strategies. Future trends will likely see a blend of technology-driven guidance and personalized AI coaching to enhance trader competency.
6. Emerging Futures Products
6.1 Cryptocurrency Futures
Cryptocurrency futures, such as Bitcoin and Ethereum contracts, have emerged as a new frontier. They allow hedging and speculative opportunities in volatile digital asset markets while integrating traditional financial instruments with blockchain innovation. Regulatory clarity and technological infrastructure will dictate the growth trajectory of crypto futures.
6.2 ESG and Sustainability Futures
Futures linked to carbon credits, renewable energy indices, and other ESG metrics are gaining traction. These products allow investors and corporations to manage environmental risk and align portfolios with sustainability objectives. As global focus on climate change intensifies, ESG-linked futures will likely become mainstream.
6.3 Inflation and Macro-Economic Futures
Products designed to hedge macroeconomic risks, such as inflation swaps or interest rate futures, are evolving. These instruments provide investors and institutions with tools to navigate monetary policy changes, inflationary pressures, and geopolitical uncertainties.
7. Risk Management and Market Stability
7.1 Advanced Hedging Strategies
Futures traders increasingly employ sophisticated hedging strategies using options, spreads, and algorithmic overlays. These strategies enhance capital efficiency, minimize downside risk, and stabilize portfolios during market turbulence.
7.2 Systemic Risk Considerations
The rapid growth of futures trading, high leverage, and technological interconnectivity can contribute to systemic risk. Market crashes, flash events, and cyber threats necessitate robust risk frameworks, continuous monitoring, and stress-testing mechanisms.
7.3 Future of Clearing and Settlement
Central clearinghouses play a critical role in mitigating counterparty risk. Innovations in blockchain-based clearing could enable real-time settlement, reducing systemic exposure and improving capital utilization. The future will likely see hybrid models combining centralized oversight with decentralized technology.
8. Technological Disruption and Market Efficiency
8.1 Predictive Analytics and Sentiment Analysis
The use of AI-driven sentiment analysis allows traders to anticipate market moves based on news, social media, and macroeconomic events. Predictive analytics transforms data into actionable insights, improving execution strategies and risk-adjusted returns.
8.2 Smart Contracts and Automated Execution
Smart contracts can automate futures trade execution, margin calls, and settlements. This automation reduces human error, increases transparency, and lowers operational costs. As adoption grows, smart contracts could redefine the operational landscape of futures exchanges.
8.3 Integration with IoT and Real-World Data
The Internet of Things (IoT) and real-time data feeds enable futures contracts to be linked to tangible metrics, such as agricultural yield, energy consumption, or shipping logistics. This integration increases contract accuracy and enables innovative products tailored to industry-specific risks.
9. Challenges and Opportunities
9.1 Cybersecurity Threats
As technology permeates futures trading, cybersecurity becomes a critical concern. Exchanges, brokers, and trading platforms must invest in robust security protocols to prevent data breaches, fraud, and market manipulation.
9.2 Market Volatility and Speculation
High-frequency trading, retail participation, and leveraged products can exacerbate market volatility. Effective risk management, regulatory oversight, and trader education are essential to mitigate speculative excesses.
9.3 Global Geopolitical Risks
Geopolitical events, trade disputes, and monetary policy shifts can impact futures markets significantly. Traders must integrate macroeconomic intelligence and scenario analysis into decision-making frameworks.
9.4 Opportunities for Innovation
The fusion of AI, blockchain, and global connectivity opens unprecedented opportunities. New product classes, algorithmic strategies, and cross-border trading platforms will redefine how futures markets operate, providing efficiency, transparency, and inclusivity.
10. The Future Outlook
10.1 Technology-Driven Evolution
The future of futures trading is inherently tied to technology. AI, ML, blockchain, cloud computing, and big data will continue to transform market structure, execution, and risk management.
10.2 Global Market Integration
Emerging markets and cross-border trading will deepen market integration, providing new opportunities for diversification and price discovery.
10.3 Regulatory Adaptation
Dynamic, technology-aware regulatory frameworks will balance innovation with investor protection and systemic stability.
10.4 Expanding Product Horizons
From digital assets to ESG-focused contracts, futures trading will diversify to meet the evolving needs of participants and the global economy.
10.5 Democratization and Education
Greater retail participation, combined with technology-driven education, will democratize access while enhancing market sophistication and resilience.
Conclusion
Futures trading has evolved from simple agricultural contracts to a sophisticated, technology-driven, and globally interconnected ecosystem. The future promises even greater transformation, driven by AI, blockchain, data analytics, and globalization. While challenges such as market volatility, cybersecurity, and regulatory compliance persist, the opportunities for innovation, efficiency, and inclusivity are immense.
The success of futures trading in the next decades will depend on the ability of exchanges, regulators, traders, and technology providers to adapt, innovate, and collaborate. The markets of tomorrow will be faster, smarter, more accessible, and more resilient, offering tools for hedging, speculation, and price discovery that are more advanced and integrated than ever before. Futures trading will not just reflect the pulse of the global economy—it will actively shape it.
Advanced Smart Liquidity Concepts1. Introduction to Smart Liquidity
1.1 Definition of Smart Liquidity
Smart liquidity refers to the portion of market liquidity that is not just available but is efficiently utilized by market participants to execute trades with minimal market impact. Unlike raw liquidity, which measures just the number of shares or contracts available, smart liquidity evaluates:
Accessibility: Can orders be executed efficiently without adverse price movement?
Quality: How stable and reliable is the liquidity at various price levels?
Speed: How quickly can liquidity be accessed and replenished?
1.2 Evolution from Traditional Liquidity Concepts
Traditional liquidity focuses on measurable quantities: order book depth, bid-ask spreads, and trading volume. Smart liquidity incorporates behavioral and strategic aspects of market participants:
Algorithmic awareness: Machines identify and exploit inefficiencies, adjusting liquidity dynamically.
Hidden liquidity: Orders concealed in dark pools or iceberg orders that influence market balance without being visible.
Latency arbitrage impact: The speed advantage of HFT affects liquidity availability and reliability.
2. Drivers of Advanced Smart Liquidity
Smart liquidity is influenced by a complex interplay of market structure, participant behavior, and technological factors:
2.1 Market Microstructure
Order book dynamics: Depth, shape, and resilience of the order book impact how liquidity is absorbed.
Spread dynamics: Tight spreads suggest high-quality liquidity, but may hide fragility if large orders create slippage.
Order flow imbalance: The ratio of aggressive to passive orders indicates how liquidity will move under pressure.
2.2 High-Frequency and Algorithmic Trading
Liquidity provision by HFTs: HFTs continuously place and cancel orders, creating dynamic liquidity pockets.
Quote stuffing and spoofing: Some algorithms distort perceived liquidity temporarily, affecting smart liquidity perception.
Latency arbitrage: Access to faster data feeds allows participants to extract liquidity before it is visible to slower traders.
2.3 Dark Pools and Hidden Liquidity
Iceberg orders: Large orders split into smaller visible slices to reduce market impact.
Alternative trading systems (ATS): These venues offer substantial liquidity without displaying it on public exchanges, contributing to overall market efficiency.
Liquidity fragmentation: The same asset may be available in multiple venues, requiring smart routing to access efficiently.
2.4 Market Sentiment and Behavior
Trader psychology: Fear or greed can amplify or withdraw liquidity, especially during volatility spikes.
News and macro events: Smart liquidity shifts rapidly around earnings, central bank announcements, or geopolitical shocks.
3. Measuring Smart Liquidity
Traditional liquidity measures are insufficient for modern market analysis. Advanced metrics capture both quality and accessibility:
3.1 Market Impact Models
Price impact per trade size: How much the price moves for a given order quantity.
Resilience measurement: How quickly the market recovers after a large trade absorbs liquidity.
3.2 Order Book Metrics
Depth at multiple levels: Not just best bid and ask but the full ladder of price levels.
Order flow toxicity: Probability that incoming orders are informed or likely to move the market against liquidity providers.
3.3 Smart Liquidity Indicators
Liquidity-adjusted volatility: Adjusting volatility estimates based on available liquidity.
Effective spread: Spread accounting for market impact and hidden liquidity.
Liquidity heatmaps: Visual tools highlighting concentration and availability of smart liquidity across price levels and venues.
3.4 Machine Learning for Liquidity Analysis
Predicting liquidity shifts using historical order book data.
Clustering trades by behavior to identify hidden liquidity patterns.
Algorithmic routing optimization to access the most favorable liquidity pools.
4. Strategies Leveraging Smart Liquidity
Advanced smart liquidity concepts are not just analytical—they inform trading strategy, risk management, and execution efficiency.
4.1 Optimal Order Execution
VWAP and TWAP algorithms: Spread large trades over time to minimize market impact.
Liquidity-seeking algorithms: Dynamically route orders to venues with the highest smart liquidity.
Iceberg order strategies: Hide large orders to reduce signaling risk.
4.2 Risk Management Applications
Dynamic hedging: Adjust hedge positions based on real-time smart liquidity availability.
Liquidity-adjusted VaR: Incorporates potential liquidity constraints into risk calculations.
Stress testing: Simulating low liquidity scenarios to measure portfolio vulnerability.
4.3 Arbitrage and Market-Making
Exploiting temporary liquidity imbalances across venues or assets.
Providing liquidity strategically during periods of high spreads to capture rebates and mitigate inventory risk.
Utilizing smart liquidity signals to identify emerging inefficiencies.
5. Smart Liquidity in Volatile Markets
5.1 Liquidity Crises and Flash Events
Flash crashes often occur when apparent liquidity evaporates under stress.
Smart liquidity analysis identifies resilient liquidity versus superficial depth that may disappear under pressure.
5.2 Adaptive Strategies for High Volatility
Dynamic adjustment of execution algorithms.
Use of limit orders versus market orders depending on liquidity conditions.
Monitoring order flow toxicity and liquidity concentration to avoid adverse selection.
6. Technological Innovations Impacting Smart Liquidity
6.1 AI and Machine Learning
Predictive models for liquidity shifts.
Reinforcement learning for adaptive execution strategies.
6.2 Blockchain and Decentralized Finance (DeFi)
Automated market makers (AMMs) provide liquidity continuously with programmable rules.
Smart liquidity pools that dynamically adjust pricing and depth.
6.3 High-Frequency Infrastructure
Co-location and low-latency networking enhance the ability to access liquidity before competitors.
Real-time analytics of fragmented markets for smart routing.
7. Regulatory Considerations
Advanced liquidity management intersects with regulation:
Market manipulation risks: Spoofing, layering, and quote stuffing can misrepresent liquidity.
Best execution obligations: Brokers must seek the highest-quality liquidity for clients.
Transparency vs. privacy: Balancing visible liquidity with hidden orders in regulated venues.
8. Future Directions of Smart Liquidity
Integration of multi-asset liquidity analysis: Evaluating cross-asset and cross-venue liquidity to optimize execution.
AI-driven market-making: Fully autonomous systems that dynamically adjust liquidity provision.
Global liquidity networks: Real-time global liquidity mapping for cross-border trading.
Impact of quantum computing: Potentially enabling instant liquidity analysis at unprecedented speeds.
9. Conclusion
Advanced smart liquidity goes far beyond simple bid-ask spreads or volume metrics. It encompasses quality, accessibility, adaptability, and strategic use of liquidity. In a market dominated by algorithms, high-frequency trading, and fragmented venues, understanding smart liquidity is essential for:
Efficient trade execution
Risk mitigation and stress management
Market-making and arbitrage strategies
Anticipating market behavior in volatile conditions
Future financial markets will increasingly rely on AI-driven liquidity analytics, real-time monitoring, and predictive modeling. Traders and institutions that master smart liquidity will gain a competitive edge in both execution efficiency and risk management.
Importance of Option Greeks in Trading and Risk Management1. Understanding Options and Their Intrinsic Complexity
Options are contracts that provide the holder with the right, but not the obligation, to buy or sell an underlying asset at a predetermined price (strike price) on or before a specific date (expiration). There are two primary types of options:
Call Options: Give the right to buy an asset.
Put Options: Give the right to sell an asset.
The value of an option is influenced by several factors, including:
Underlying asset price
Strike price
Time to expiration
Volatility of the underlying asset
Risk-free interest rate
Dividends (if any)
While these factors determine an option's price, the dynamic nature of the market requires traders to quantify how sensitive an option is to changes in these variables. This is where Option Greeks come into play. Greeks are named after Greek letters, each representing a specific sensitivity measure.
2. What Are Option Greeks?
Option Greeks are mathematical measures that indicate how the price of an option responds to various market factors. They provide traders with a way to quantify risk and manage exposure systematically.
The primary Option Greeks include:
Delta (Δ) – Sensitivity to underlying price changes
Gamma (Γ) – Sensitivity of Delta to underlying price changes
Theta (Θ) – Sensitivity to time decay
Vega (ν) – Sensitivity to volatility
Rho (ρ) – Sensitivity to interest rates
Each Greek serves a distinct purpose in options trading and risk management.
3. Delta (Δ): The Directional Sensitivity
Definition: Delta measures the rate of change of an option’s price relative to the change in the underlying asset's price. In simpler terms, it tells traders how much the option price is expected to move for a 1-unit move in the underlying asset.
Call options: Delta ranges from 0 to +1
Put options: Delta ranges from 0 to -1
Example:
If a call option has a Delta of 0.60 and the underlying stock moves up by $1, the option price is expected to rise by $0.60.
Importance in Trading:
Delta provides insight into the directional exposure of an options position. Traders can use Delta to:
Hedge stock positions
Estimate probability of an option expiring in the money
Construct Delta-neutral strategies
Delta Hedging:
Traders often aim to maintain a Delta-neutral portfolio to minimize the directional risk of underlying price movements. By adjusting the ratio of options and underlying assets, Delta hedging reduces the portfolio’s sensitivity to small price fluctuations.
4. Gamma (Γ): Measuring the Rate of Change of Delta
Definition: Gamma measures the rate of change of Delta with respect to changes in the underlying asset price. Essentially, Gamma tells traders how much Delta will change if the underlying price moves by one unit.
High Gamma: Delta is highly sensitive to price changes.
Low Gamma: Delta changes slowly.
Example:
If a call option has a Gamma of 0.05, a $1 increase in the stock price increases the Delta by 0.05.
Importance in Trading:
Gamma is crucial for understanding non-linear risk in options positions:
Helps traders gauge the stability of Delta.
High Gamma options are sensitive to price swings, requiring more active risk management.
Traders managing Delta-neutral portfolios monitor Gamma to adjust hedges frequently.
Practical Application:
Gamma is particularly significant for near-the-money options nearing expiration, as small price movements can cause rapid Delta changes.
5. Theta (Θ): Understanding Time Decay
Definition: Theta measures the sensitivity of an option’s price to the passage of time, also known as time decay. Theta is typically negative for long options positions because options lose value as expiration approaches, assuming all else remains constant.
Example:
If a call option has a Theta of -0.03, the option’s price will decrease by $0.03 per day due to time decay.
Importance in Trading:
Theta is critical for understanding the impact of time on option value:
Option sellers benefit from positive Theta as options lose value over time.
Option buyers experience negative Theta, requiring profitable moves in the underlying asset to offset time decay.
Practical Application:
Theta helps traders design income strategies such as:
Covered calls
Iron condors
Short straddles/strangles
Time decay can be a predictable source of profit if managed correctly.
6. Vega (ν): Sensitivity to Volatility
Definition: Vega measures the sensitivity of an option’s price to changes in implied volatility. Implied volatility reflects the market’s expectation of future price fluctuations in the underlying asset.
Example:
If a call option has a Vega of 0.10 and implied volatility rises by 1%, the option’s price increases by $0.10.
Importance in Trading:
Vega is critical for understanding the volatility risk:
High Vega options are more sensitive to changes in market volatility.
Traders use Vega to benefit from volatility trading, regardless of directional moves.
Practical Application:
Vega is central to strategies like:
Long straddles or strangles (profit from increased volatility)
Short volatility trades (profit from declining volatility)
Volatility management is especially important during earnings announcements, economic releases, or geopolitical events.
7. Rho (ρ): Interest Rate Sensitivity
Definition: Rho measures the sensitivity of an option’s price to changes in risk-free interest rates. Rho is more relevant for long-dated options, as interest rate fluctuations impact the present value of the strike price.
Example:
If a call option has a Rho of 0.05 and interest rates increase by 1%, the option price increases by $0.05.
Importance in Trading:
Rho is often less critical than Delta, Gamma, Theta, or Vega for short-term traders but is essential for long-term options strategies or interest-sensitive markets.
Practical Application:
Traders managing options in low-interest-rate vs. high-interest-rate environments monitor Rho to adjust risk exposures.
8. Interdependence of Greeks: The Dynamic Nature of Options
Option Greeks are not isolated; they interact dynamically:
Delta changes with Gamma.
Theta and Vega are interlinked as volatility affects time decay.
Multi-Greek analysis is necessary for sophisticated risk management.
For example, a near-the-money option with high Gamma and low Theta requires frequent adjustments to maintain Delta neutrality, whereas a far-out-of-the-money option with low Gamma and high Vega may be used for volatility plays.
9. Practical Applications in Trading
Option Greeks are critical tools for traders, hedgers, and portfolio managers. Some practical applications include:
9.1 Hedging Strategies
Delta Hedging: Neutralizes directional risk by balancing option and underlying asset positions.
Gamma Hedging: Ensures Delta remains stable as the underlying price moves.
Vega Hedging: Protects against volatility swings in options portfolios.
9.2 Risk Management
Identifying portfolio exposures across multiple Greeks.
Stress-testing scenarios: How would the portfolio behave under extreme price or volatility moves?
Adjusting positions dynamically to reduce undesirable risk.
9.3 Profit Optimization
Exploiting Theta decay through income-generating strategies.
Benefiting from volatility spikes using Vega-sensitive trades.
Structuring multi-leg trades with balanced Greeks for optimal risk-return.
10. Common Trading Strategies and Greeks Usage
Covered Call:
Positive Theta (time decay works in favor)
Delta is partially hedged
Protective Put:
Delta neutralizes stock exposure
Vega protects against volatility rise
Iron Condor:
Positive Theta (benefit from time decay)
Delta-neutral to minimize directional risk
Straddle/Strangle:
High Vega sensitivity (profit from volatility changes)
Requires Gamma and Theta monitoring
11. Advanced Risk Management Techniques Using Greeks
Multi-Greek Hedging:
Professional traders hedge multiple Greeks simultaneously to reduce exposure. Example: Balancing Delta, Gamma, and Vega to create a portfolio resilient to price, volatility, and time changes.
Dynamic Rebalancing:
Greeks change as market conditions evolve. Continuous monitoring and rebalancing of positions help maintain desired risk profiles.
Stress Testing and Scenario Analysis:
Using Greeks to simulate market scenarios and predict option portfolio performance. This is essential for protecting against tail risks and market shocks.
Portfolio Greeks Aggregation:
Large institutions aggregate Greeks across multiple options positions to quantify overall portfolio risk and identify vulnerabilities.
12. Importance for Retail and Institutional Traders
Option Greeks are indispensable tools for both retail traders and institutional investors:
Retail Traders:
Use Greeks to understand basic option sensitivities.
Implement strategies like covered calls, spreads, or protective puts with greater confidence.
Institutional Traders:
Conduct multi-dimensional risk management.
Hedge large portfolios using Delta, Gamma, Vega, Theta, and Rho.
Optimize portfolio performance using scenario analysis and stress testing.
13. Challenges in Using Option Greeks
While Greeks are highly useful, they come with challenges:
Complexity:
Requires understanding of multiple interacting factors.
New traders may find it overwhelming.
Dynamic Nature:
Greeks change with market movements, requiring constant monitoring.
Model Dependence:
Option Greeks are derived from pricing models (like Black-Scholes).
Model assumptions may not hold in extreme market conditions.
Liquidity and Slippage:
Large trades may not perfectly reflect calculated Greek hedges.
Despite these challenges, the benefits of using Option Greeks far outweigh the drawbacks for serious traders.
14. Conclusion
Option Greeks are fundamental tools for anyone serious about options trading and risk management. They quantify sensitivity to market variables such as price movements, volatility, time decay, and interest rates. By understanding and effectively managing Delta, Gamma, Theta, Vega, and Rho, traders can:
Reduce exposure to unwanted risks
Optimize returns
Implement complex hedging and trading strategies
Navigate volatile markets with confidence
In modern financial markets, where volatility and uncertainty are constants, Greeks offer a structured approach to understanding risk and opportunity in options trading. Mastering them is not merely a technical exercise—it is a crucial step toward becoming a disciplined, informed, and successful trader.
Option Greeks transform options from complex derivatives into measurable, manageable, and strategically valuable financial instruments, empowering traders to navigate the markets with precision and foresight.
Technical Indicators for Swing Trading1. Introduction to Technical Indicators
Technical indicators are mathematical calculations based on historical price, volume, or open interest data. They help traders identify trends, reversals, and potential entry and exit points. There are two main types of indicators used in swing trading:
Trend-Following Indicators – These help identify the direction of the market and confirm the strength of a trend. Examples include Moving Averages, MACD, and Average Directional Index (ADX).
Oscillators – These help identify overbought or oversold conditions and possible price reversals. Examples include RSI, Stochastic Oscillator, and Commodity Channel Index (CCI).
Most swing traders use a combination of trend-following indicators and oscillators to improve the accuracy of their trades.
2. Trend-Following Indicators
2.1 Moving Averages (MA)
Definition: Moving averages smooth out price data to identify trends by averaging prices over a specific period. The two most popular types are:
Simple Moving Average (SMA): The arithmetic mean of prices over a chosen period.
Exponential Moving Average (EMA): Gives more weight to recent prices, making it more responsive to price changes.
Application in Swing Trading:
Trend Identification: A rising MA indicates an uptrend, while a declining MA indicates a downtrend.
Crossovers: A common strategy is the moving average crossover. For instance, when a short-term MA (e.g., 20-day) crosses above a long-term MA (e.g., 50-day), it signals a potential bullish trend. Conversely, a cross below indicates a bearish trend.
Support and Resistance: MAs often act as dynamic support or resistance levels. Traders can enter trades when the price bounces off the MA.
Example: If a stock’s 50-day EMA is rising, swing traders might look for pullbacks to this EMA as entry points.
2.2 Moving Average Convergence Divergence (MACD)
Definition: MACD measures the relationship between two EMAs (usually 12-day and 26-day) and includes a signal line (9-day EMA of MACD) to generate trading signals.
Components:
MACD Line: Difference between the 12-day EMA and the 26-day EMA.
Signal Line: 9-day EMA of the MACD line.
Histogram: Represents the difference between the MACD line and the signal line.
Application in Swing Trading:
Trend Identification: MACD above zero indicates an uptrend; below zero indicates a downtrend.
Crossovers: When the MACD line crosses above the signal line, it’s a bullish signal. A cross below signals bearishness.
Divergence: When price makes a new high or low but the MACD doesn’t, it signals a potential trend reversal.
Example: A swing trader may buy a stock when the MACD crosses above the signal line after a pullback in an uptrend.
2.3 Average Directional Index (ADX)
Definition: ADX measures the strength of a trend, regardless of direction. It ranges from 0 to 100.
Application in Swing Trading:
Trend Strength: ADX above 25 indicates a strong trend, while below 20 suggests a weak trend or range-bound market.
Trade Confirmation: Swing traders often avoid taking trades when ADX is low because the price may be consolidating rather than trending.
Example: If ADX is 30 and the trend is upward, traders may consider buying on pullbacks.
3. Oscillators for Swing Trading
3.1 Relative Strength Index (RSI)
Definition: RSI measures the speed and change of price movements on a scale of 0 to 100. Traditionally, RSI above 70 is considered overbought, and below 30 is oversold.
Application in Swing Trading:
Identify Overbought/Oversold Conditions: Overbought conditions may indicate a potential reversal down, while oversold conditions suggest a potential reversal up.
Divergence: When price makes a new high but RSI doesn’t, it can signal a reversal.
Support and Resistance: RSI often reacts to trendlines, helping traders anticipate price reactions.
Example: If a stock is in an uptrend but RSI drops below 30 after a pullback, a swing trader might use it as a buy signal.
3.2 Stochastic Oscillator
Definition: The stochastic oscillator compares a security’s closing price to its price range over a specific period, usually 14 periods.
Components:
%K Line: Measures the current closing price relative to the high-low range.
%D Line: 3-day moving average of %K.
Application in Swing Trading:
Overbought/Oversold Conditions: Above 80 is overbought; below 20 is oversold.
Crossovers: A bullish signal occurs when %K crosses above %D; a bearish signal when %K crosses below %D.
Divergence: Like RSI, divergence can indicate potential reversals.
Example: During an uptrend, a pullback that moves the stochastic below 20 and then back above it can be a buying opportunity.
3.3 Commodity Channel Index (CCI)
Definition: CCI measures the variation of the price from its average price over a specified period. It helps identify cyclical trends.
Application in Swing Trading:
Overbought/Oversold Levels: CCI above +100 indicates overbought; below -100 indicates oversold.
Trend Reversals: Swing traders use CCI to detect potential reversal points during pullbacks.
Entry and Exit Signals: Traders may enter long positions when CCI crosses above -100 and exit when it crosses below +100 in an uptrend.
Example: A CCI moving from -120 to -90 during an uptrend can indicate a potential entry point.
4. Volume-Based Indicators
Volume is a crucial aspect of swing trading because it confirms the strength of price moves.
4.1 On-Balance Volume (OBV)
Definition: OBV adds volume on up days and subtracts volume on down days to measure buying and selling pressure.
Application in Swing Trading:
Confirm Trends: Rising OBV with rising prices confirms an uptrend; falling OBV with falling prices confirms a downtrend.
Divergence: If OBV diverges from price, a reversal may be imminent.
Example: If a stock price is rising but OBV is falling, swing traders may be cautious about taking long positions.
4.2 Volume Oscillator
Definition: Measures the difference between two moving averages of volume, usually a short-term and a long-term MA.
Application in Swing Trading:
Helps identify volume surges that precede price movements.
Confirms breakout or breakdown signals.
Example: A spike in the volume oscillator along with a price breakout indicates strong momentum, ideal for swing trades.
5. Combining Indicators for Swing Trading
No single indicator is perfect. The most successful swing traders combine multiple indicators to confirm trades and reduce false signals. Here are common combinations:
Trend + Oscillator: Use moving averages or MACD to identify the trend, and RSI or Stochastic to time entry points during pullbacks.
Trend + Volume: Confirm a breakout with rising volume and a bullish MACD signal.
Oscillator + Volume: Use RSI or Stochastic for potential reversals, with OBV confirming strength of buying/selling.
Example Strategy:
Identify a stock in an uptrend using 50-day EMA.
Wait for RSI to drop below 30 during a pullback.
Confirm volume increase with OBV.
Enter long position when price starts moving up, exit when RSI approaches 70.
6. Practical Swing Trading Tips Using Indicators
Avoid Overloading: Using too many indicators can create conflicting signals. Stick to 2–3 complementary indicators.
Timeframe Matters: Swing traders typically use daily or 4-hour charts. Shorter timeframes may generate noise.
Risk Management: Always use stop-loss orders based on support/resistance levels or ATR (Average True Range) to protect capital.
Backtesting: Test strategies historically before applying them live to understand performance and potential drawdowns.
Patience is Key: Swing trading requires waiting for the right setup; don’t rush trades based on impulse.
7. Common Mistakes to Avoid
Ignoring Trend: Using oscillators alone without trend context can lead to premature entries.
Overreacting to Short-Term Signals: Swing trading is about the bigger picture, not intraday fluctuations.
Neglecting Volume: Price movements without volume confirmation are less reliable.
Lack of Strategy: Entering trades randomly without clear indicator-based rules often leads to losses.
8. Advanced Indicator Techniques
Divergence Analysis: Spotting divergence between price and indicators like RSI, MACD, or CCI can reveal hidden reversals.
Indicator Confluence: Using multiple indicators to converge on a single trading signal increases accuracy.
Adaptive Indicators: Some traders use adaptive MAs or dynamic RSI levels based on market volatility for improved precision.
9. Conclusion
Technical indicators are indispensable tools for swing traders. They provide insight into market trends, potential reversals, and entry/exit points. Popular indicators such as moving averages, MACD, RSI, Stochastic Oscillator, and volume-based indicators can be combined to create robust trading strategies. The key to successful swing trading lies not just in using indicators but in understanding their strengths, limitations, and context within the market. By combining trend-following tools with oscillators and volume confirmation, swing traders can systematically identify profitable trading opportunities while managing risk effectively.
Swing trading is both an art and a science. While indicators provide the science, the art comes from interpreting signals, recognizing patterns, and exercising discipline. Over time, with consistent application, swing traders can develop strategies that maximize profits and minimize losses in ever-changing markets.
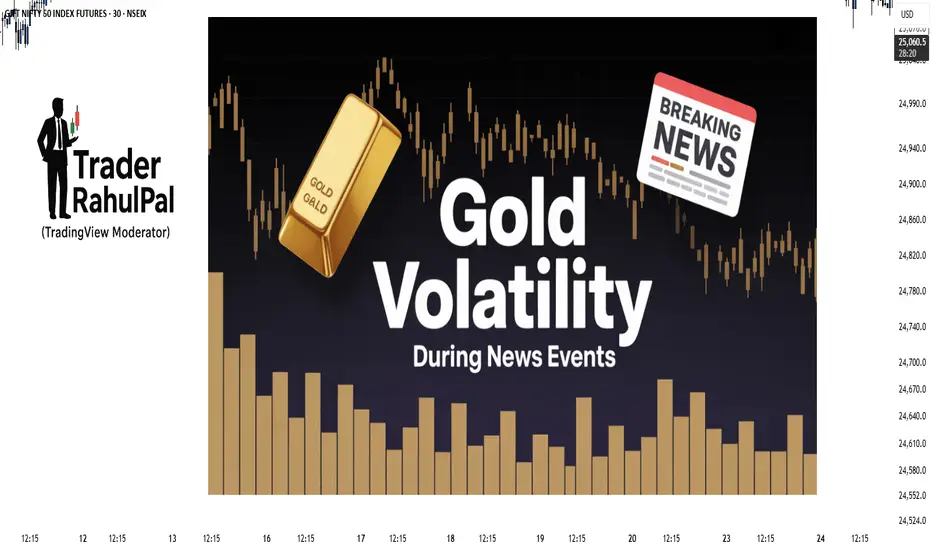
How to Survive Gold Volatility During News Events?Hello Traders!
Gold is one of the most volatile instruments in the market, especially during big news events like US Fed announcements, inflation data, or geopolitical updates.
Many traders either get stopped out too early or end up chasing wild moves.
So how do you survive and trade smartly when gold becomes unpredictable? Let’s break it down.
1. Understand Why Gold Reacts So Much
Gold is directly linked to the US dollar, interest rates, and global fear sentiment.
Whenever important data comes out, traders across the world hedge positions using gold, which creates sudden spikes in volatility.
2. Avoid Trading Before the News
Gold often becomes choppy 15–30 minutes before a major event.
Liquidity dries up, spreads widen, and stop losses get hunted.
The safest choice is to wait until the news is released and the first move settles.
3. Reduce Position Size
Instead of trading big lots, cut down your size during news events.
This reduces emotional stress and allows your stop loss to be wider.
Remember, survival is more important than chasing one big move.
4. Use Wider Stop Loss with Strict Risk Control
Gold can spike $5–10 within seconds during news.
Place your stop a little further than usual, but never risk more than your planned % of capital.
Risk control matters more than perfect entries during such events.
5. Focus on the Second Move
The first spike after news is often a trap, institutions trigger stops and grab liquidity.
The real direction usually appears in the second move once the market digests the data.
Patience gives you better entries.
Rahul’s Tip:
Treat gold news events as opportunities for learning, not quick profits.
If you’re not confident, it’s perfectly fine to sit out, no trade is also a strategy.
Conclusion:
Gold volatility during news events can be dangerous if you chase blindly, but manageable if you plan well.
By reducing size, waiting for confirmation, and focusing on survival first, you can turn chaos into clarity.
This Educational Idea By @TraderRahulPal (TradingView Moderator) | More analysis & educational content on my profile
If this post gave you a better way to handle gold volatility, like it, share your view in comments, and follow for more trading education that matters!
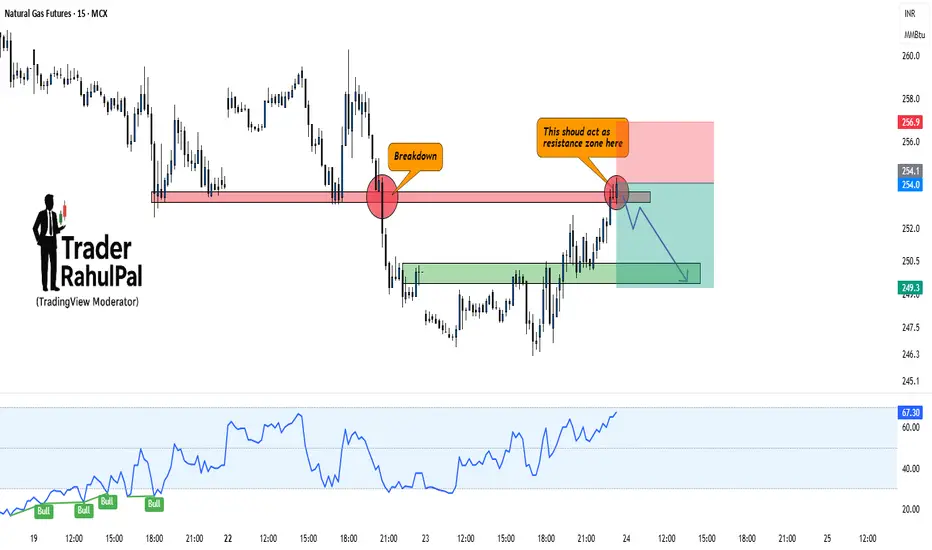
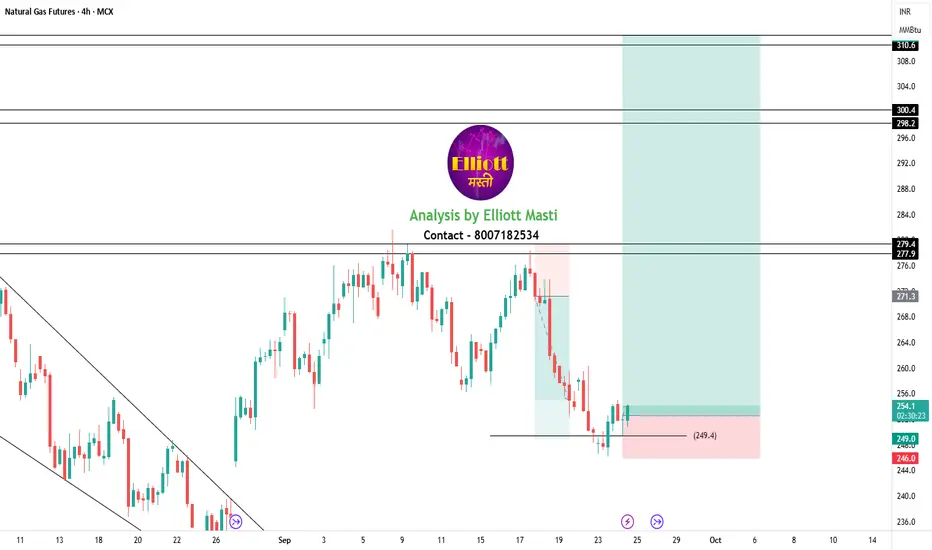
Natural Gas – Breakdown Retest Could Trigger Fresh FallHello everyone, Let's analyse Natural Gas and it has recently broken down from a key support level, turning it into resistance. The price is now retesting that zone, and unless bulls manage to reclaim it strongly, the downside remains the higher probability.
Current Setup:
Previous support around 254–256 has turned into a resistance zone.
Breakdown already confirmed with strong bearish candles.
RSI is still holding higher, but momentum may fade if resistance rejects.
Fresh downside targets can open toward 249–247 zone if rejection plays out.
Only a strong close above 257 will negate this bearish view.
Disclaimer: This analysis is for educational purposes only and should not be taken as financial advice. Please do your own research or consult your financial advisor before investing.
Analysis By @TraderRahulPal (TradingView Moderator) | More analysis & educational content on my profile
👉 If you found this helpful, don’t forget to like and follow for regular updates.

Part 8 Trading Master Class1. Core Option Trading Strategies
These are the foundational option strategies every trader must know. They are relatively simple, easy to implement, and help beginners understand how options behave in different market conditions.
1.1 Covered Call Strategy
What It Is:
A covered call involves owning the underlying stock and simultaneously selling (writing) a call option on the same stock.
How It Works:
Suppose you own 100 shares of TCS at ₹3,500 each. You sell a call option with a strike price of ₹3,700, receiving a premium of ₹50 per share.
If TCS rises above ₹3,700, you may have to sell your stock at ₹3,700, but you keep the premium.
If TCS stays below ₹3,700, you keep both the stock and the premium.
Best Used When:
You expect the stock to remain flat or rise slightly.
Advantages:
Generates regular income (option premiums).
Provides partial downside protection.
Risks:
Limits profit if the stock price rises sharply, because you must sell at the strike price.
1.2 Protective Put (Married Put)
What It Is:
A protective put involves owning the underlying stock and buying a put option to hedge against potential losses.
How It Works:
Imagine you own 100 shares of Infosys at ₹1,600. To protect yourself from a market downturn, you buy a put option at ₹1,550 by paying a premium of ₹30.
If Infosys drops to ₹1,400, you can still sell at ₹1,550 (limiting your losses).
If Infosys rises, your put option expires worthless, but your stock gains.
Best Used When:
You’re bullish long-term but worried about short-term downside risk.
Advantages:
Insurance against big losses.
Peace of mind for long-term investors.
Risks:
Premium cost reduces net profit.
1.3 Long Call
What It Is:
Buying a call option when you expect the stock price to rise.
How It Works:
Suppose Nifty is at 24,000. You buy a call option at a strike of 24,200 for a premium of ₹100.
If Nifty rises to 24,500, your option is worth 300 points (500 – 200), making a profit.
If Nifty stays below 24,200, your option expires worthless and you lose the premium.
Best Used When:
You’re bullish on the market/stock.
Advantages:
Limited risk (only the premium).
High profit potential if the stock rises sharply.
Risks:
Options can expire worthless.
Time decay works against you.
1.4 Long Put
What It Is:
Buying a put option when you expect the stock price to fall.
How It Works:
Say HDFC Bank is trading at ₹1,600. You buy a put option at strike ₹1,580 for a premium of ₹25.
If HDFC falls to ₹1,520, you profit from the difference.
If it stays above ₹1,580, you lose only the premium.
Best Used When:
You’re bearish on the stock/market.
Advantages:
Limited risk, big profit potential if the stock falls sharply.
Can be used as portfolio insurance.
Risks:
Options lose value quickly if the stock doesn’t move.
1.5 Cash-Secured Put
What It Is:
Selling a put option while holding enough cash to buy the stock if assigned.
How It Works:
Suppose you want to buy Reliance shares at ₹2,300, but it’s trading at ₹2,400. You sell a put option at ₹2,300 for a ₹40 premium.
If Reliance falls below ₹2,300, you must buy it at ₹2,300 (your target price), and you also keep the premium.
If Reliance stays above ₹2,300, you don’t buy it, but you still keep the premium.
Best Used When:
You’re bullish on a stock but want to buy it cheaper.
Advantages:
Generates income if the stock doesn’t fall.
Lets you buy stock at your desired entry price.
Risks:
Stock could fall far below strike price, leading to losses.
1.6 Collar Strategy
What It Is:
A collar combines owning stock, buying a protective put, and selling a covered call.
How It Works:
You hold Infosys stock at ₹1,600.
You buy a put at ₹1,550 (insurance).
You sell a call at ₹1,700 (income).
This creates a “collar” around your stock’s possible price range.
Best Used When:
You want protection but are willing to cap profits.
Advantages:
Reduces risk with limited cost.
Works well in uncertain markets.
Risks:
Limited upside profit.
Complex compared to basic strategies.

Part 7 Trading Master Class1. Introduction to Options Trading
Options are one of the most fascinating financial instruments in the market because they allow traders to speculate, hedge, and manage risks in creative ways. Unlike buying and selling shares directly, options give you the right but not the obligation to buy or sell an asset at a predetermined price within a specified period. This flexibility makes options extremely powerful.
However, with power comes responsibility. Options trading is not as straightforward as buying a stock and waiting for its price to go up. Options involve multiple variables—time decay, implied volatility, strike prices, and premiums—that all influence profit and loss. For this reason, traders develop strategies that balance risk and reward depending on their market outlook.
Option trading strategies range from simple ones—like buying a call when you expect a stock to rise—to very advanced ones—like iron condors or butterflies, where you combine multiple contracts to profit from stable or volatile markets.
In this guide, we’ll explore the most widely used option trading strategies, explaining how they work, when to use them, and their advantages and risks.
2. Understanding Options Basics
Before diving into strategies, let’s understand the core building blocks of options:
Call Option
A call option gives the buyer the right to buy an asset at a fixed strike price within a given time frame.
Example: You buy a call option on Reliance at ₹2,500 strike for a premium of ₹50. If Reliance rises to ₹2,600, you can exercise the option and profit.
Put Option
A put option gives the buyer the right to sell an asset at a fixed strike price within a given time frame.
Example: You buy a put option on Infosys at ₹1,500 strike for a premium of ₹40. If Infosys falls to ₹1,400, you can sell it at ₹1,500, earning profit.
Key Terms in Options
Strike Price: The fixed price at which you can buy/sell the asset.
Premium: The cost you pay to buy the option.
Expiry Date: The last date the option is valid.
In the Money (ITM): When exercising the option is profitable.
At the Money (ATM): When strike price ≈ current price.
Out of the Money (OTM): When exercising the option is not profitable.
3. Why Use Options?
Options are not just for speculation—they serve multiple purposes:
Hedging – Investors use options to protect against unfavorable price moves. Example: Buying puts to protect a stock portfolio against a market crash.
Income Generation – By writing (selling) options like covered calls or cash-secured puts, traders collect premiums and generate consistent income.
Leverage – Options allow control of large stock positions with small capital. For example, buying one call contract is cheaper than buying 100 shares of the stock outright.
Speculation – Traders can take directional bets with limited risk. Example: If you expect volatility, you might use straddle or strangle strategies.
Flexibility – Unlike stocks, options allow you to profit in bullish, bearish, or even sideways markets, depending on the strategy.

Part 6 Learn Institutional Trading1. Advantages of Options Trading
Leverage: Control larger positions with smaller capital.
Flexibility: Numerous strategies to profit in rising, falling, or stagnant markets.
Hedging: Reduce risk of adverse price movements.
Income Generation: Selling options can generate additional income.
Defined Risk for Buyers: Buyers can only lose the premium paid.
2. Risks and Challenges in Options Trading
Complexity: Options require deep understanding; mistakes can be costly.
Time Decay (Theta): Options lose value as expiration approaches.
Market Volatility: Sudden moves can amplify losses for sellers.
Liquidity Risk: Some options have low trading volumes, making entry and exit difficult.
Leverage Risk: While leverage amplifies profits, it also magnifies losses.
3. Practical Steps to Start Options Trading
Open a Trading Account: With a SEBI-registered broker.
Understand Margin Requirements: Options may require initial margins for writing strategies.
Learn Option Greeks: Delta, Gamma, Theta, Vega, and Rho affect pricing and risk.
Practice with Simulations: Use paper trading before committing real capital.
Develop a Trading Plan: Define goals, strategies, risk tolerance, and exit rules.
Continuous Learning: Markets evolve, so staying updated is crucial.
4. The Greeks: Understanding Option Sensitivities
Option Greeks measure how the option price responds to changes in various factors:
Delta: Sensitivity to the underlying asset’s price change.
Gamma: Rate of change of delta.
Theta: Time decay impact on the option’s price.
Vega: Sensitivity to volatility changes.
Rho: Sensitivity to interest rate changes.
Greeks help traders manage risk and optimize strategies.
5. Real-World Examples of Options Trading
Example 1: Hedging with Puts
Investor holds 100 shares of a stock at ₹2,000 each.
Buys 1 put option at strike price ₹1,950 for ₹50.
If stock falls to ₹1,800, the put option gains ₹150, limiting overall loss.
Example 2: Speculation with Calls
Trader expects stock to rise from ₹1,000.
Buys a call at strike price ₹1,050 for ₹20.
Stock rises to ₹1,100, call’s intrinsic value becomes ₹50.
Profit = ₹30 per share minus premium paid.

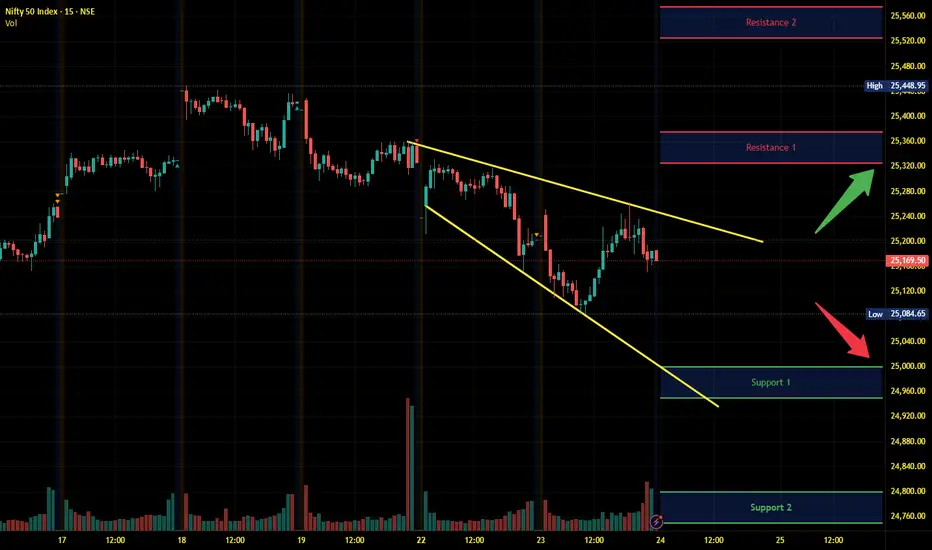
Nifty Intraday Analysis for 24th September 2025NSE:NIFTY
Index has resistance near 25325 – 25375 range and if index crosses and sustains above this level then may reach near 25525 – 25575 range.
Nifty has immediate support near 25000 – 24950 range and if this support is broken then index may tank near 24800 – 24750 range.
The global market may react to the US FOMC head Powell’s speech scheduled tonight if any unfavourable statement emerges.
Part 3 Learn Institutional Trading1. Introduction to Options Trading
Options trading is one of the most versatile and widely used financial instruments in modern financial markets. Unlike stocks, which represent ownership in a company, options are derivative contracts that give the holder the right, but not the obligation, to buy or sell an underlying asset at a predetermined price within a specified period.
Options trading can be used for speculation, hedging, and income generation. Due to their unique characteristics, options are considered advanced financial instruments that require a solid understanding of market dynamics, risk management, and strategy planning.
2. Understanding the Basics of Options
2.1 What Are Options?
An option is a contract between two parties – the buyer and the seller (or writer). The contract is based on an underlying asset, which could be:
Stocks
Indices
Commodities
Currencies
ETFs (Exchange Traded Funds)
Options come in two main types:
Call Options – Give the holder the right to buy the underlying asset at a predetermined price (strike price) within a specified period.
Put Options – Give the holder the right to sell the underlying asset at the strike price within a specified period.
2.2 Key Terms in Options Trading
Understanding options terminology is crucial:
Strike Price (Exercise Price): The price at which the underlying asset can be bought or sold.
Expiration Date: The date on which the option contract expires.
Premium: The price paid by the buyer to purchase the option.
In-the-Money (ITM): An option has intrinsic value (e.g., a call option is ITM if the underlying asset price is above the strike price).
Out-of-the-Money (OTM): An option has no intrinsic value (e.g., a put option is OTM if the underlying asset price is above the strike price).
At-the-Money (ATM): The option’s strike price is equal or very close to the current price of the underlying asset.
Intrinsic Value: The difference between the current price of the underlying asset and the strike price.
Time Value: The portion of the option’s premium that reflects the potential for future profit before expiration.
2.3 How Options Work
Options provide leverage, meaning a small amount of capital can control a larger position in the underlying asset. For example, buying 100 shares of a stock may cost ₹1,00,000, whereas purchasing a call option for the same stock may cost only ₹10,000, offering a similar profit potential if the stock moves favorably.
The profit or loss depends on:
The difference between the strike price and the market price.
The premium paid for the option.
The time remaining until expiration.

Part 2 Ride The Big Moves 1. Option Pricing and Valuation
Option prices are determined by two main components:
1.1 Intrinsic Value
The difference between the current price of the underlying asset and the option’s strike price.
1.2 Time Value
The remaining portion of the premium, reflecting time until expiration and volatility. Options with longer time to expiration usually have higher time value.
1.3 Factors Affecting Option Prices
Underlying Asset Price: Movement in the underlying asset directly affects the option’s value.
Strike Price: Determines whether the option is ITM, ATM, or OTM.
Time to Expiration: Longer expiration provides higher flexibility and premium.
Volatility: Higher volatility increases option premiums.
Interest Rates: Rising interest rates can increase call option values and decrease put option values.
Dividends: Expected dividends reduce the value of call options.
1.4 Option Pricing Models
Black-Scholes Model: Widely used for European options, factoring in asset price, strike price, time, volatility, and risk-free rate.
Binomial Model: Flexible and suitable for American options, where early exercise is possible.
2. Risk and Reward in Options Trading
2.1 Risk for Option Buyers
The maximum risk for buyers is limited to the premium paid. If the market moves unfavorably, the option can expire worthless, but the loss cannot exceed the initial investment.
2.2 Risk for Option Sellers (Writers)
Sellers face potentially unlimited risk:
For a call writer without owning the underlying asset (naked call), losses can be infinite if the asset price rises sharply.
For put writers, losses occur if the asset price falls significantly below the strike price.
2.3 Reward Potential
Buyers have unlimited profit potential for calls and substantial profit for puts if the market moves favorably.
Sellers earn the premium as maximum profit, regardless of market movement, assuming they manage positions correctly.
3. Hedging and Speculation Using Options
3.1 Hedging
Options are a powerful tool for risk management. For instance:
Investors holding a stock can buy put options to protect against downside risk.
Traders can use options to lock in profit targets or minimize losses.
3.2 Speculation
Speculators use options to capitalize on market movements with limited capital. Examples:
Buying calls to profit from an anticipated rise.
Buying puts to profit from an anticipated fall.
Using complex strategies to exploit volatility or time decay.
4. Options in Different Markets
4.1 Stock Options
Options on individual stocks are most popular and widely traded. They provide leverage and hedging opportunities.
4.2 Index Options
Options on market indices like Nifty or S&P 500 allow traders to speculate on broader market trends.
4.3 Commodity Options
Used in commodities markets like gold, crude oil, and agricultural products for hedging or speculation.
4.4 Currency Options
Provide protection or speculation opportunities in the forex market against currency fluctuations.

Part 1 Ride The Big Moves 1. Introduction to Options Trading
Options trading is one of the most versatile and widely used financial instruments in modern financial markets. Unlike stocks, which represent ownership in a company, options are derivative contracts that give the holder the right, but not the obligation, to buy or sell an underlying asset at a predetermined price within a specified period.
Options trading can be used for speculation, hedging, and income generation. Due to their unique characteristics, options are considered advanced financial instruments that require a solid understanding of market dynamics, risk management, and strategy planning.
2. Understanding the Basics of Options
2.1 What Are Options?
An option is a contract between two parties – the buyer and the seller (or writer). The contract is based on an underlying asset, which could be:
Stocks
Indices
Commodities
Currencies
ETFs (Exchange Traded Funds)
Options come in two main types:
Call Options – Give the holder the right to buy the underlying asset at a predetermined price (strike price) within a specified period.
Put Options – Give the holder the right to sell the underlying asset at the strike price within a specified period.
2.2 Key Terms in Options Trading
Understanding options terminology is crucial:
Strike Price (Exercise Price): The price at which the underlying asset can be bought or sold.
Expiration Date: The date on which the option contract expires.
Premium: The price paid by the buyer to purchase the option.
In-the-Money (ITM): An option has intrinsic value (e.g., a call option is ITM if the underlying asset price is above the strike price).
Out-of-the-Money (OTM): An option has no intrinsic value (e.g., a put option is OTM if the underlying asset price is above the strike price).
At-the-Money (ATM): The option’s strike price is equal or very close to the current price of the underlying asset.
Intrinsic Value: The difference between the current price of the underlying asset and the strike price.
Time Value: The portion of the option’s premium that reflects the potential for future profit before expiration.
2.3 How Options Work
Options provide leverage, meaning a small amount of capital can control a larger position in the underlying asset. For example, buying 100 shares of a stock may cost ₹1,00,000, whereas purchasing a call option for the same stock may cost only ₹10,000, offering a similar profit potential if the stock moves favorably.
The profit or loss depends on:
The difference between the strike price and the market price.
The premium paid for the option.
The time remaining until expiration.
3. Types of Options Strategies
Options trading is highly versatile. Traders can adopt various strategies based on market expectations:
3.1 Basic Strategies
Buying Calls: Used when expecting the price of the underlying asset to rise.
Buying Puts: Used when expecting the price to fall.
Writing Calls (Covered Calls): Generating income by selling call options against a stock you own.
Writing Puts: Generating income or acquiring stocks at a lower price.
3.2 Advanced Strategies
Spreads: Combining two or more options to reduce risk.
Bull Call Spread: Buying a call and selling a higher strike call.
Bear Put Spread: Buying a put and selling a lower strike put.
Straddles and Strangles: Strategies to profit from volatility.
Straddle: Buying a call and a put with the same strike price.
Strangle: Buying a call and a put with different strike prices.
Iron Condor: Selling a bear call spread and a bull put spread to profit from low volatility.
Butterfly Spread: Combining multiple call or put options to profit from minimal movement around a strike price.

What Are Trading Orders? A Beginner’s Guide1. Introduction to Trading Orders
A trading order is essentially an instruction from a trader to a broker or trading platform to buy or sell a financial instrument. Trading orders tell the broker:
What to trade (stock, commodity, currency, etc.)
How much to trade (quantity or lots)
When to trade (immediately or under certain conditions)
At what price (market price or specific price level)
Without an order, no trade can occur. Orders are the bridge between your trading strategy and execution in the market.
1.1 Why Trading Orders Matter
Trading orders are not just procedural—they affect your trading results. Correct order selection can:
Improve execution speed
Reduce slippage (difference between expected and actual price)
Control risk (through stop losses or limit orders)
Allow automation of trades for efficiency
Traders who understand how to use orders effectively can manage trades systematically rather than relying on guesswork or emotion.
1.2 Key Components of a Trading Order
Every trading order typically includes the following:
Type of Order: Market, limit, stop, etc.
Quantity/Size: How many shares, lots, or contracts to buy/sell.
Price Specification: At what price the order should be executed.
Duration/Validity: How long the order remains active (e.g., day order, GTC).
Special Instructions: Optional features like “all or none” (AON) or “immediate or cancel” (IOC).
Understanding these components ensures traders can communicate their intentions clearly to the market.
2. Types of Trading Orders
Trading orders can be broadly divided into market orders, limit orders, stop orders, and advanced orders. Each has distinct characteristics and uses.
2.1 Market Orders
A market order is an instruction to buy or sell immediately at the current market price. Market orders prioritize speed of execution over price.
Advantages:
Fast execution
Guaranteed to fill if liquidity exists
Disadvantages:
Price uncertainty, especially in volatile markets
Potential for slippage
Example:
You want to buy 100 shares of XYZ Corp, currently trading at ₹500. Placing a market order will buy shares at the next available price, which could be slightly higher or lower than ₹500.
2.2 Limit Orders
A limit order specifies the maximum price to buy or minimum price to sell. The trade executes only if the market reaches that price.
Advantages:
Controls execution price
Useful in volatile markets
Disadvantages:
May not execute if price is not reached
Missed opportunities if price moves away
Example:
You want to buy XYZ Corp at ₹495. A limit order at ₹495 will only execute if the price drops to ₹495 or below.
2.3 Stop Orders
Stop orders become market orders once a specific price is reached. They are primarily used to limit losses or lock in profits.
Stop-Loss Order: Sells automatically to prevent further loss.
Stop-Buy Order: Used in breakout strategies to buy when a price crosses a threshold.
Example:
You hold shares of XYZ Corp bought at ₹500. To prevent large losses, you place a stop-loss at ₹480. If the price falls to ₹480, your shares are sold automatically.
2.4 Stop-Limit Orders
A stop-limit order is a combination of stop and limit orders. Once the stop price is triggered, the order becomes a limit order instead of a market order.
Advantages:
Provides price control while using stops
Reduces risk of selling too low in volatile markets
Disadvantages:
Risk of not executing if price moves quickly beyond limit
Example:
Stop price: ₹480, Limit price: ₹478. If XYZ Corp drops to ₹480, the order becomes a limit order to sell at ₹478 or better.
2.5 Trailing Stop Orders
A trailing stop is dynamic, moving with the market price to lock in profits while limiting losses.
Useful for locking gains in trending markets
Automatically adjusts stop price as market moves favorably
Example:
You buy shares at ₹500 and set a trailing stop at ₹10. If the stock rises to ₹550, the stop automatically moves to ₹540. If the price then falls, the trailing stop triggers at ₹540.
2.6 Other Advanced Orders
One-Cancels-Other (OCO) Orders: Executes one order and cancels the other automatically. Useful for breakout or range trades.
Good Till Cancelled (GTC) Orders: Remain active until manually canceled.
Immediate or Cancel (IOC): Executes immediately, cancels unfilled portion.
Fill or Kill (FOK): Executes entire order immediately or cancels it completely.
These advanced orders allow traders to automate strategies and manage risk efficiently.
3. Order Duration and Validity
Trading orders are not indefinite. Traders must choose a duration for each order:
Day Order: Expires at market close if not executed.
Good Till Cancelled (GTC): Stays active until filled or manually canceled.
Good Till Date (GTD): Active until a specified date.
Immediate or Cancel (IOC): Executes immediately or cancels unfilled portion.
Choosing the right duration affects execution probability and risk management.
4. Choosing the Right Order Type
Choosing the appropriate order type depends on trading goals, market conditions, and risk tolerance.
For beginners: Market and limit orders are easiest to use.
For risk management: Stop-loss and trailing stops are essential.
For advanced strategies: OCO, FOK, and GTC orders help automate trades.
Key Considerations:
Market volatility
Liquidity of the asset
Time available to monitor trades
Risk tolerance
5. Practical Examples of Trading Orders
Let’s examine some real-life trading scenarios:
Buying at Market Price: You want instant execution for 50 shares of Infosys. Place a market order; shares execute at the best available price.
Buying at a Discount: You want to buy 50 shares of Infosys if the price falls to ₹1500. Place a limit order at ₹1500; the order executes only if the price drops.
Protecting Profits: You bought shares at ₹1500. To lock gains, you place a trailing stop at ₹50. If the price rises to ₹1600, the stop moves to ₹1550, securing profits if the price falls.
Breakout Strategy: You expect Infosys to rise above ₹1600. Place a stop-buy order at ₹1600. If the price crosses ₹1600, the order triggers and you enter the trade.
6. Risks and Considerations
Trading orders are powerful but not foolproof. Common risks include:
Slippage: Execution at a worse price than expected.
Partial fills: Only part of the order executes.
Liquidity risk: Low trading volume can prevent execution.
Overuse of stops: Placing stops too close may trigger premature exits.
Emotional trading: Avoid constantly changing orders based on fear or greed.
Mitigating these risks involves planning, strategy, and disciplined execution.
7. Technology and Trading Orders
Modern trading platforms have transformed order execution:
Electronic trading: Fast, accurate, with minimal human error.
Algorithmic trading: Automates orders based on pre-defined criteria.
Mobile trading apps: Allow order management on the go.
APIs: Enable advanced traders to execute complex strategies programmatically.
Technology makes trading more efficient but requires understanding to avoid mistakes.
8. Tips for Beginners
Start with market and limit orders.
Use stop-loss orders to manage risk.
Understand order duration and use GTC orders cautiously.
Avoid overcomplicating trades with too many advanced orders initially.
Practice on demo accounts before real capital.
Keep a trade journal to track order types, outcomes, and lessons.
Conclusion
Trading orders are the foundation of every trade. They bridge your strategy and market execution, determine price, timing, and risk control. Understanding the different types—market, limit, stop, stop-limit, trailing stops, and advanced orders—allows traders to execute strategies systematically. Combining the right order types with risk management, technology, and discipline empowers beginners to trade confidently and efficiently.
In essence, mastering trading orders is mastering the mechanics of trading. Without it, even the best strategies may fail. With it, even a novice trader can navigate financial markets with clarity and purpose.