XAUUSD Analysis - Levels and Pridiction#Gold (XAU/USD) Technical Analysis - October 27, 2025
Current Market Status: Retracement on Higher Time Frame,
Lower Timeframe Bearish Breakdown⚠️
Gold is trading at 4,033.67, having broken down from the previous #consolidation zone. The market has violated key support levels and is now showing clear bearish momentum with multiple technical confirmations.
Critical Technical Developments:
1️⃣ Triangle Pattern Breakdown (1H Chart)
The 1-hour chart reveals a confirmed triangle #pattern breakout to the downside. After breaking below the triangle support, price attempted a retest of the breakdown level around 4,093-4,144 but was rejected, confirming the pattern's validity. This is a classic bearish continuation signal.
2️⃣ Demand Zone Invalidation
A crucial demand level that previously held multiple tests has now been completely invalidated. The chart explicitly notes: "Demand Level to be invalidated to move the Price Further Down" - this condition has been met, opening the path for deeper downside movement.
3️⃣ Minor Trend Shift Level Breach
Price has broken below the **Minor Trend Shift Level** at approximately 4,093, confirming a shift from bullish to bearish short-term structure. This level now acts as resistance.
Target Zones (High Probability):
🎯 Immediate Targets:
- 3,945 - Next support cluster (current proximity)
- 3,845 - 0.5 Fibonacci retracement level (PRIMARY TARGET)
- 3,719 - 0.618 Fibonacci retracement level (EXTENDED TARGET)
The Fibonacci levels in green boxes, are the key magnetic zones for price action.
📉 Bearish Continuation (70% Probability)
Price continues lower toward 3,845, potentially extending to 3,719 if selling pressure intensifies. This move would represent a healthy correction within the broader uptrend from the yearly lows.
📈 Bullish Reversal (30% Probability)
Requires reclaiming 4,144 with strong momentum AND holding above it on daily timeframe. Only then would the bearish structure be invalidated.
Conclusion:
Gold remains in a confirmed downtrend on lower timeframes with clear downside targets visible. The invalidation of demand zones and triangle breakdown provide strong bearish confirmation. Traders should focus on the 3,845-3,719 zone as the primary area of interest for potential reversal setups. Until price reclaims 4,150+, the path of least resistance remains **DOWN**.
Risk Management: Use proper position sizing as volatility remains elevated. The 3,845 level will be crucial - watch for buyer reaction there.
Contains image

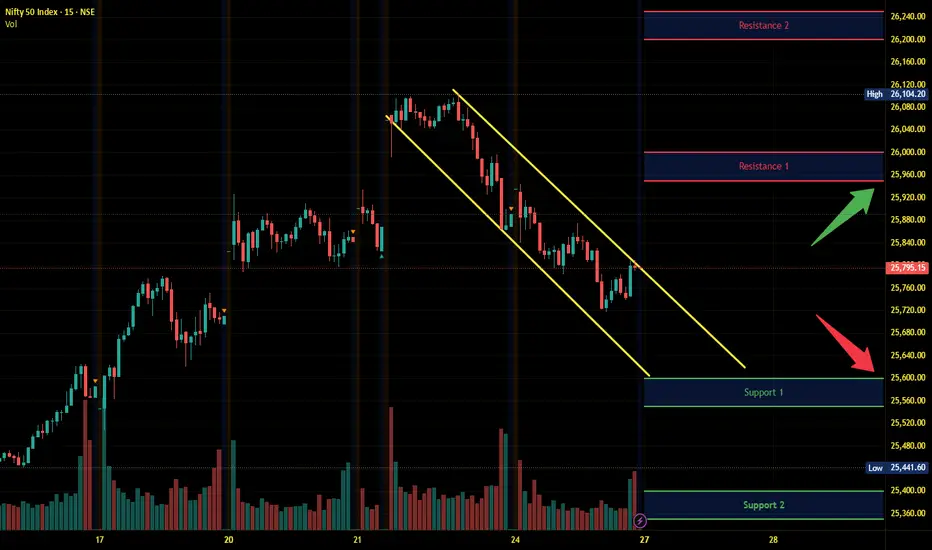
Nifty Intraday Analysis for 27th October 2025NSE:NIFTY
Index has resistance near 25950 – 26000 range and if index crosses and sustains above this level then may reach near 26200 – 26250 range.
Nifty has immediate support near 25600 – 25550 range and if this support is broken then index may tank near 25400 – 25350 range.
[SeoVereign] ETHEREUM BEARISH Outlook – October 27, 2025Hello everyone,
Currently, Ethereum has re-entered a major resistance zone,
and there is a high probability of a short-term corrective movement emerging.
First Basis — FIBONACCI 1.13~1.272
Ethereum is positioned within the 1.13–1.272 range relative to the upper structure.
This zone is generally recognized as an overheated area of an upward wave,
where selling pressure tends to emerge following the formation of a short-term high.
Second Basis — WAVE.M = WAVE.N × 1.618
The ongoing M-wave shows an extension ratio of approximately 1.618 relative to the previous N-wave.
This represents an overextended structure in wave theory,
which is typically interpreted as a sign of trend exhaustion and potential reversal.
Accordingly, the average target price is set around 3,864 USDT.
This perspective is based on data as of October 26,
and further updates will be provided to refine this outlook as the market develops.
Thank you for reading.

[SeoVereign] SOLANA BEARISH Outlook – October 27, 2025Hello everyone,
This idea presents a bearish (short) outlook on Solana as of October 27.
Currently, Solana has entered a short-term overheated zone,
and we are beginning to observe a gradual inflow of selling pressure.
First Basis — (DEEP) GARTLEY Pattern
Solana is currently located within the PRZ (Potential Reversal Zone) of a (DEEP) GARTLEY pattern.
This zone is typically recognized as the terminal phase of a short-term upward wave,
where a trend reversal to the downside often occurs due to overbought conditions.
Second Basis — WAVE.M = WAVE.N × 0.786
The ongoing M-wave has formed approximately 78.6% of the length of the previous N-wave,
which represents a classic reversal structure commonly observed within the GARTLEY pattern.
Therefore, entering a short position within this range is considered technically valid.
Accordingly, the average target price is set around 184.97 USDT.
Depending on future price developments,
I will provide further updates on refinements to this idea and position management strategies.
Thank you for reading.

[SeoVereign] RIPPLE BEARISH Outlook – October 27, 2025Hello everyone,
This idea presents a bearish (short) outlook on Ripple (XRP).
Currently, Ripple has reached a major resistance zone following a short-term upward movement,
and from a technical standpoint, a corrective phase is likely to occur.
Basis — BEARISH BAT PATTERN (Alternate Bat Pattern)
Structurally, Ripple has entered the PRZ (Potential Reversal Zone) of a Bearish BAT Pattern.
This zone coincides with a price range that has historically shown strong selling pressure,
and typically, a downward reversal tends to occur once the pattern is completed.
Accordingly, the average target price is set around 2.3 USDT.
This perspective is based on data as of October 27,
and further detailed updates will be provided depending on future price developments.
Thank you for reading.

Swing Trading and Positional Trading1. Understanding Swing Trading
1.1 Definition
Swing trading is a short-to-medium-term trading strategy where traders aim to capitalize on price swings or fluctuations within a trend. Unlike day trading, which involves buying and selling securities within the same day, swing trading typically involves holding positions for several days to weeks. The main goal is to capture a portion of a market move, whether upward or downward.
1.2 Objectives
The primary objective of swing trading is to identify short-term opportunities in the market and profit from them without getting caught in long-term market fluctuations. Swing traders often rely on technical analysis, chart patterns, and market indicators to make decisions.
1.3 Key Strategies in Swing Trading
Swing trading involves several techniques to identify profitable opportunities:
Trend Trading: Riding the momentum of an existing trend. Traders look for strong upward or downward trends and enter trades in the direction of the trend.
Breakout Trading: Identifying key levels of support or resistance and entering trades when the price breaks through these levels.
Reversal Trading: Spotting potential trend reversals using candlestick patterns, indicators like RSI (Relative Strength Index), or MACD (Moving Average Convergence Divergence).
Momentum Trading: Trading based on momentum indicators and volume spikes that suggest a strong directional move.
1.4 Tools and Indicators
Swing traders often use a combination of technical tools and indicators to identify trade setups:
Moving Averages: To detect trends and potential reversal points.
Fibonacci Retracement Levels: To identify potential support and resistance levels.
RSI and Stochastic Oscillators: To spot overbought or oversold conditions.
Candlestick Patterns: To identify potential price reversals.
Volume Analysis: To confirm the strength of a trend.
1.5 Advantages of Swing Trading
Time Efficiency: Requires less constant monitoring compared to day trading.
Profit Potential: Captures short-term market swings that can be significant.
Flexibility: Can be applied to stocks, forex, commodities, and cryptocurrencies.
1.6 Risks and Challenges
Market Volatility: Unexpected news or events can trigger sharp price movements.
Overnight Risk: Prices can gap up or down between trading sessions.
Requires Discipline: Traders must stick to strategies and avoid emotional decisions.
2. Understanding Positional Trading
2.1 Definition
Positional trading is a long-term trading strategy where traders hold positions for weeks, months, or even years. Unlike swing trading, positional trading focuses on capturing major market trends rather than short-term price movements. Traders typically rely on a mix of fundamental analysis and technical analysis to identify long-term opportunities.
2.2 Objectives
The main goal of positional trading is to capitalize on large price movements over an extended period. Positional traders aim to ride the primary trend of an asset, ignoring minor fluctuations to avoid excessive trading and transaction costs.
2.3 Key Strategies in Positional Trading
Trend Following: Entering positions in alignment with the prevailing long-term trend.
Fundamental Analysis: Evaluating company financials, economic indicators, and macroeconomic trends to select assets with growth potential.
Breakout and Support/Resistance Analysis: Using long-term chart patterns such as triangles, head and shoulders, or channel patterns to make trading decisions.
Moving Average Crossovers: Using long-term moving averages (e.g., 50-day and 200-day) to identify trend direction.
2.4 Tools and Indicators
Positional traders focus on long-term technical and fundamental tools:
Fundamental Reports: Company earnings, economic data, and geopolitical developments.
Long-Term Moving Averages: To detect primary trends.
Trend Lines and Channels: For identifying support and resistance zones.
Technical Patterns: Such as cup-and-handle, double top/bottom for long-term breakout opportunities.
2.5 Advantages of Positional Trading
Less Time-Intensive: Requires minimal day-to-day monitoring.
Lower Transaction Costs: Fewer trades reduce brokerage fees.
Potential for Large Gains: Capturing long-term trends can result in substantial profits.
2.6 Risks and Challenges
Market Corrections: Long-term holdings are susceptible to market corrections.
Capital Commitment: Funds remain tied up for extended periods.
Patience and Discipline Required: Traders must resist the urge to react to short-term volatility.
3. Risk Management in Both Styles
Risk management is vital for both swing and positional trading. Techniques include:
Stop-Loss Orders: Placing stop-loss levels to limit potential losses.
Position Sizing: Determining the appropriate trade size based on risk tolerance.
Diversification: Avoiding concentration in a single asset or sector.
Regular Review: Monitoring positions and adjusting strategies as market conditions change.
4. Practical Examples
4.1 Swing Trading Example
A swing trader identifies a stock in a strong upward trend with support at ₹500 and resistance at ₹550. The trader buys at ₹505 and targets a sell at ₹545, with a stop-loss at ₹495. Over a week, the stock rises to ₹545, yielding a short-term profit.
4.2 Positional Trading Example
A positional trader identifies a technology stock with strong fundamentals and long-term growth prospects. Buying at ₹1,000 with a target of ₹1,500 over the next year, the trader ignores minor fluctuations, focusing on the overall upward trend. Over several months, the stock appreciates steadily, achieving the target.
5. Integrating Both Strategies
Some traders combine swing and positional strategies:
Hybrid Approach: Holding a core long-term position while taking short-term swing trades on other assets.
Hedging: Using swing trades to hedge risks in a long-term portfolio.
This approach allows traders to balance risk and reward while leveraging both short-term and long-term opportunities.
6. Psychological Aspects
Swing Traders: Must handle short-term volatility, avoid overtrading, and maintain discipline.
Positional Traders: Need patience, emotional stability, and a long-term mindset.
Emotional discipline and mental resilience are key to success in both trading styles.
Conclusion
Both swing trading and positional trading offer valuable opportunities in financial markets. Swing trading is ideal for traders seeking short-term profits from market fluctuations, while positional trading suits those aiming to capture long-term trends. Choosing the right strategy depends on individual risk tolerance, time availability, and market knowledge. Mastery of technical analysis, risk management, and psychological discipline is essential for success in either style. Combining insights from both strategies can provide a comprehensive approach to trading, maximizing profits while mitigating risks.

Smart Liquidity Trading Strategies1. Understanding Market Liquidity
Market liquidity refers to the ease with which an asset can be converted to cash at a stable price. High liquidity implies narrow bid-ask spreads, large volumes, and low volatility for a given transaction size, while low liquidity involves wider spreads, lower volume, and higher volatility. Understanding liquidity is crucial for trading strategies because:
Liquidity affects execution costs.
Illiquid markets are prone to sharp price moves.
Market participants’ behavior can create temporary liquidity imbalances, which smart traders exploit.
Liquidity can be categorized into:
Natural liquidity – The existing supply and demand for an asset.
Hidden liquidity – Orders that are not visible in the order book but can influence prices, such as iceberg orders.
Synthetic liquidity – Created by market participants through strategies like high-frequency trading (HFT) or algorithmic trading.
2. Types of Liquidity Trading Strategies
Smart liquidity trading strategies can be broadly classified into several types:
2.1 Order Book Analysis
The order book shows the real-time buy (bid) and sell (ask) orders. Smart traders analyze the order book to detect liquidity clusters:
Support and Resistance Liquidity Zones: Large order clusters act as barriers to price movement. If the buy-side has a significant volume, it can provide support. Conversely, large sell orders can act as resistance.
Order Flow Imbalances: When the number of aggressive buy orders exceeds sell orders, it can indicate potential upward price pressure, and vice versa.
Tools such as depth-of-market (DOM) screens, Level II quotes, and heatmaps allow traders to visualize these liquidity zones.
2.2 Volume-Weighted Strategies
Volume is a direct proxy for liquidity. Smart liquidity traders often use volume-weighted techniques:
Volume Weighted Average Price (VWAP) Trading: VWAP is the average price of a security weighted by its traded volume. Traders aim to buy below or sell above VWAP to minimize market impact.
Liquidity-Seeking Algorithms: Large institutional orders are split and executed in small portions based on current liquidity to avoid slippage. Algorithms like VWAP, TWAP (Time-Weighted Average Price), and POV (Percentage of Volume) are commonly used.
2.3 Price Action and Liquidity Gaps
Liquidity gaps occur when the order book is thin at certain price levels. Smart traders exploit these gaps:
Breakout Trading: Thin liquidity areas often allow prices to accelerate quickly once the barrier is breached.
Stop-Hunting Strategies: Large participants sometimes trigger liquidity pools (stop-loss clusters) to create favorable price movements. Traders who understand liquidity dynamics can anticipate these zones.
2.4 High-Frequency and Algorithmic Liquidity Strategies
High-frequency traders (HFTs) specialize in identifying and exploiting transient liquidity imbalances. Examples include:
Market-Making: Providing liquidity by continuously quoting buy and sell prices and profiting from the spread.
Latency Arbitrage: Exploiting delays in price updates across exchanges or trading venues.
Liquidity Sniping: Targeting hidden orders when they are partially revealed or exposed due to large market moves.
2.5 Cross-Market and Cross-Asset Liquidity Trading
Liquidity is not confined to a single market. Smart traders examine correlations between markets:
Equity and Derivative Pairs: For example, the liquidity in index futures can provide insights into the underlying stocks’ potential moves.
Forex and Commodity Cross-Market Liquidity: Major currency pairs often exhibit predictable liquidity patterns, which can influence commodity prices, like oil or gold.
ETF Arbitrage: When ETF liquidity diverges from its underlying basket, traders can exploit the mispricing efficiently.
3. Smart Tools for Liquidity Analysis
Successful liquidity trading requires advanced tools and data sources:
Order Book and Level II Data: Visualizing real-time buy/sell orders and depth helps identify liquidity clusters and thin zones.
Volume Heatmaps: Identify where significant trading activity is occurring across price levels.
Liquidity Aggregators: Tools that combine order book data across multiple exchanges to provide a consolidated view.
Algorithmic Platforms: Automated execution minimizes slippage and optimizes order placement according to liquidity conditions.
News and Event Scanners: Market liquidity often changes during economic releases, corporate earnings, or geopolitical events. Monitoring these can prevent adverse execution.
4. Liquidity Timing Strategies
Timing is crucial in liquidity trading. Smart traders often consider:
Market Open and Close: Liquidity is often thin at market open, leading to high volatility. Conversely, liquidity peaks near close due to institutional rebalancing.
Intraday Patterns: Volume spikes are common at certain times of the day (e.g., after economic news). Traders can use these predictable patterns.
Event-Based Liquidity: Earnings announcements, central bank decisions, and geopolitical events create temporary liquidity vacuums or surges.
5. Risk Management in Liquidity Trading
While liquidity strategies can be profitable, they carry specific risks:
Execution Risk: Entering or exiting positions in illiquid markets may lead to slippage or partial fills.
Market Impact Risk: Large orders in thin markets can move prices against the trader.
Counterparty Risk: Over-reliance on automated systems or brokers may lead to failure if liquidity vanishes unexpectedly.
Overnight Risk: Illiquid positions held overnight can be vulnerable to gaps in price movement.
Smart liquidity traders manage these risks using:
Order Slicing: Breaking large trades into smaller orders to avoid price impact.
Stop-Loss Placement: Strategic placement in liquid zones to reduce adverse execution.
Diversification: Trading multiple correlated instruments to distribute liquidity risk.
Automated Monitoring: Alert systems to detect liquidity shifts and adjust execution dynamically.
6. Psychological and Behavioral Insights
Liquidity trading is not just technical; market psychology plays a key role:
Traders often herd around visible liquidity pools, creating predictable patterns.
Understanding the behavior of institutional participants, such as how they hide large orders, can give retail traders a strategic advantage.
Market sentiment can create sudden liquidity droughts, which savvy traders can exploit by anticipating crowd behavior.
7. Practical Examples of Smart Liquidity Strategies
Example 1: VWAP Execution
An institutional trader needs to buy 1 million shares without moving the market.
The algorithm executes trades according to intraday volume, ensuring the average price is near VWAP, minimizing slippage.
Example 2: Liquidity Gap Breakout
A stock shows a thin order book at a certain price level due to low participation.
A trader places a breakout order just above the liquidity gap, allowing rapid execution as the price accelerates through the thin zone.
Example 3: Cross-Market Arbitrage
ETF price deviates from its underlying basket due to temporary liquidity shortage.
Trader buys the cheaper asset and sells the overvalued counterpart, profiting as prices converge once liquidity returns.
Example 4: Stop-Loss Liquidity Pool Hunting
Large institutional stops often cluster near round numbers.
Smart traders identify these clusters and position accordingly, entering slightly before the expected cascade to benefit from the resulting liquidity surge.
8. Advanced Considerations
Hidden Liquidity: Iceberg orders and dark pools hide true market depth. Advanced traders use predictive analytics to estimate hidden volumes.
Liquidity Fragmentation: Markets are fragmented across multiple exchanges and dark pools. Consolidated data helps detect where liquidity is concentrated.
Dynamic Liquidity Modeling: Using AI and machine learning to predict how liquidity responds to price moves, news, and market sentiment.
9. Key Principles for Smart Liquidity Trading
Observe, Don’t Chase: Liquidity dynamics often reveal intentions of larger players. Observing patterns is more effective than aggressive chasing.
Minimize Market Impact: Use algorithms and staggered executions to preserve favorable prices.
Adapt to Market Conditions: Liquidity is dynamic; strategies must adjust intraday.
Leverage Technology: Automation, analytics, and high-speed data feeds are essential.
Integrate Risk Management: Smart liquidity trading combines precision entry, execution efficiency, and rigorous risk controls.
10. Conclusion
Smart liquidity trading strategies focus on understanding and leveraging the flow of market liquidity rather than simply predicting price direction. By analyzing order books, volume, cross-market activity, and behavioral patterns, traders can execute efficiently, reduce slippage, and identify profitable opportunities hidden in the market structure. These strategies require a combination of analytical skill, technological tools, and disciplined risk management. As markets evolve and liquidity becomes more fragmented, mastery of liquidity dynamics increasingly distinguishes professional traders from casual participants. The essence of smart liquidity trading lies in respecting the invisible currents of supply and demand, positioning oneself ahead of major flows, and executing with surgical precision.

Primary Market vs. Secondary Market in Indian Trading1. Introduction
Financial markets can broadly be divided into two categories: the primary market and the secondary market. These markets facilitate the trading of financial instruments such as equities, bonds, and derivatives. The primary market is the venue for raising new capital, whereas the secondary market is where existing securities are traded among investors. Both markets collectively ensure liquidity, capital formation, and price discovery in the Indian economy.
2. Primary Market
2.1 Definition
The primary market, also called the new issue market, is where companies raise capital directly from investors for the first time. This market deals with newly issued securities such as initial public offerings (IPOs), follow-on public offers (FPOs), private placements, and rights issues.
In India, the primary market is regulated by the Securities and Exchange Board of India (SEBI) to ensure transparency and protect investors’ interests.
2.2 Instruments in the Primary Market
Initial Public Offerings (IPOs)
Companies issue shares to the public for the first time to raise capital. For instance, Reliance Industries and Paytm used IPOs to generate significant funds.
Follow-on Public Offers (FPOs)
Companies that are already listed may issue additional shares to raise more capital.
Private Placements
Companies may issue securities to select institutional investors rather than the public.
Rights Issues
Existing shareholders are offered the right to purchase additional shares at a discounted price.
Debentures and Bonds
Debt instruments issued by companies or the government to raise funds for infrastructure, expansion, or operational purposes.
2.3 Functions of the Primary Market
Capital Formation
The primary market enables companies to raise funds for growth, expansion, or new projects.
Investment Opportunities
It provides investors with a chance to invest in new and potentially high-growth companies.
Economic Growth
By facilitating capital flow into productive sectors, the primary market contributes to industrial and economic development.
Government Financing
Government bonds issued in the primary market help fund public projects such as roads, hospitals, and infrastructure.
2.4 Process of Primary Market Transactions
Company Decision: The company decides to raise funds.
Appointment of Intermediaries: Merchant bankers, underwriters, and registrars are appointed.
Drafting Prospectus: A document outlining financials, risks, and objectives is prepared.
SEBI Approval: SEBI reviews the prospectus to ensure compliance.
Marketing and Subscription: Investors apply for securities through brokers or online platforms.
Allotment: Securities are allocated, and funds are transferred to the company.
Example: The 2023 IPO of Nykaa, a prominent e-commerce platform in India, followed this exact process to raise funds from retail and institutional investors.
2.5 Advantages of the Primary Market
Direct funding for companies without depending on loans.
Offers investors early-stage opportunities.
Encourages entrepreneurship and innovation.
Helps governments fund public projects efficiently.
2.6 Disadvantages of the Primary Market
Investment risk is higher due to uncertainty about new companies’ performance.
Time-consuming regulatory procedures.
Limited liquidity until shares are listed on a secondary market.
3. Secondary Market
3.1 Definition
The secondary market is where previously issued securities are traded between investors. Companies do not receive funds in this market; instead, it provides liquidity and enables price discovery for existing shares, bonds, or other financial instruments.
In India, secondary markets include stock exchanges like the NSE (National Stock Exchange) and BSE (Bombay Stock Exchange), where millions of investors trade daily.
3.2 Instruments in the Secondary Market
Equities (Shares of listed companies)
Debentures (Corporate and government bonds)
Mutual Funds
Derivatives (Options, futures, swaps)
Exchange-Traded Funds (ETFs)
3.3 Functions of the Secondary Market
Liquidity
Investors can easily buy and sell securities, providing an exit route from investments made in the primary market.
Price Discovery
Market forces of demand and supply determine the price of securities.
Investor Confidence
A transparent and regulated secondary market builds trust, encouraging more investment in the primary market.
Economic Indicator
The performance of stock exchanges reflects the economic health of the country.
3.4 Participants in the Secondary Market
Retail Investors
Individual investors trading through brokers or online platforms.
Institutional Investors
Mutual funds, insurance companies, banks, and foreign institutional investors (FIIs).
Brokers and Dealers
Facilitate trading and provide liquidity to the market.
Market Makers
Ensure constant buying and selling of securities to stabilize markets.
3.5 Advantages of the Secondary Market
Provides liquidity and flexibility to investors.
Encourages wider participation in capital markets.
Helps companies monitor investor sentiment.
Supports fair pricing of securities through continuous trading.
3.6 Disadvantages of the Secondary Market
Market volatility can lead to financial loss.
Prices may be influenced by speculation rather than fundamentals.
Requires active monitoring and knowledge to trade effectively.
4. Interaction Between Primary and Secondary Markets
The two markets are complementary. Funds raised in the primary market are invested in productive assets, while the secondary market ensures liquidity and provides investors with an avenue to exit their investments. A well-functioning secondary market encourages more participation in IPOs and other primary market instruments, creating a virtuous cycle of investment and growth.
Example in India: The IPO of Zomato in 2021 saw significant investor interest because investors knew they could sell shares on the NSE or BSE after listing.
5. Regulatory Framework in India
SEBI (Securities and Exchange Board of India) regulates both markets. Its responsibilities include:
Ensuring transparency and disclosure.
Protecting investors’ interests.
Approving IPOs and monitoring listings.
Regulating trading practices in the secondary market.
The Companies Act 2013 also governs corporate governance and disclosure norms for firms raising capital.
6. Current Trends in Indian Markets
Digital Platforms: Online trading and mobile apps have increased retail participation in both markets.
IPO Frenzy: High-growth startups are increasingly opting for public listings to raise funds.
Institutional Dominance: FIIs and domestic institutional investors drive volumes in secondary markets.
Derivatives Growth: Futures and options trading have become significant in India’s NSE and BSE markets.
Conclusion
The primary and secondary markets are essential pillars of the Indian financial system. The primary market enables companies to raise capital and supports economic growth, while the secondary market provides liquidity, facilitates price discovery, and instills investor confidence. Both markets are interconnected, and their smooth functioning is crucial for the stability and development of India’s capital market.
A robust understanding of these markets helps investors make informed decisions and allows companies to leverage capital efficiently, driving India toward sustained financial and economic growth.

Retail Investors and Algorithm AdvantagesIntroduction
In the modern financial ecosystem, retail investors—the individual investors who buy and sell securities for their personal accounts—are increasingly sharing the stage with institutional investors powered by sophisticated algorithms. The rise of algorithmic trading, machine learning, and data-driven investment strategies has created a paradigm shift in markets worldwide. For retail investors, this duality represents both opportunities and challenges: they have access to tools that were once exclusively the domain of professional traders, yet they also face markets increasingly influenced by speed, precision, and automation. Understanding the interplay between retail investment behavior and algorithmic advantages is critical to navigating contemporary financial markets.
Who Are Retail Investors?
Retail investors are non-professional market participants who invest their personal funds in stocks, bonds, mutual funds, ETFs, cryptocurrencies, and other financial instruments. Unlike institutional investors—such as hedge funds, pension funds, and mutual funds—which handle large sums and deploy complex trading strategies, retail investors typically operate with smaller capital and limited resources. Traditionally, retail investors relied heavily on brokers, financial advisors, and news media to make investment decisions.
Characteristics of Retail Investors
Limited Capital: Retail investors often trade in smaller volumes, which reduces their market influence but increases their susceptibility to volatility.
Behavioral Biases: Emotional decision-making, overconfidence, and herd behavior can influence retail trades, leading to inconsistent results.
Access to Technology: Recent advances in digital platforms have democratized access to market data, analysis tools, and even algorithmic trading software.
Long-term vs. Short-term Goals: Retail investors may pursue retirement savings, wealth creation, or speculative gains, unlike institutional investors focused on large-scale portfolio optimization.
Algorithmic Trading: An Overview
Algorithmic trading, or algo-trading, involves the use of computer programs to execute trades automatically based on predefined criteria. These algorithms can analyze vast amounts of data, identify patterns, and execute orders at speeds impossible for humans. Algorithmic trading can be broken down into several categories:
High-Frequency Trading (HFT): Executing thousands of trades per second to exploit small price discrepancies.
Statistical Arbitrage: Leveraging mathematical models to identify mispriced securities and market inefficiencies.
Trend Following Algorithms: Using historical price trends to predict future movements.
Machine Learning Algorithms: Learning from historical market data to adapt to new patterns over time.
Advantages of Algorithms for Retail Investors
Algorithmic trading is no longer confined to institutional investors. The democratization of technology has enabled retail investors to harness algorithmic advantages. Here are key benefits:
1. Speed and Efficiency
Algorithms can execute trades within milliseconds, far faster than human capabilities. For retail investors, speed is crucial in volatile markets where prices can change in seconds. Many trading platforms now provide retail traders access to execution algorithms that reduce latency, prevent slippage, and optimize order timing.
2. Emotion-Free Trading
Retail investors often succumb to fear, greed, and panic—buying during market peaks and selling during troughs. Algorithms operate purely on logic, removing emotional biases. By following a disciplined set of rules, retail investors can maintain consistency, minimize impulsive trading, and adhere to predefined risk-management strategies.
3. Backtesting and Strategy Optimization
Algorithms allow retail investors to test trading strategies against historical data before committing real capital. Backtesting provides insights into potential profitability, risk exposure, and drawdowns, enabling retail investors to refine strategies systematically rather than relying on guesswork.
4. Diversification and Portfolio Management
Algorithmic tools allow retail investors to manage multiple assets simultaneously. Automated portfolio rebalancing, risk assessment, and optimization can be achieved without manually tracking every position. This scalability enhances the efficiency of retail investment management.
5. Access to Complex Strategies
Before technological advancements, complex strategies such as options hedging, pair trading, or momentum-based trading were mostly inaccessible to retail investors due to computational or informational constraints. Algorithmic trading platforms now enable retail investors to implement sophisticated strategies with minimal manual intervention.
6. Reduced Transaction Costs
Many algorithms are designed to minimize transaction costs through optimal order execution, splitting orders to reduce market impact, and using predictive models to anticipate liquidity. For retail investors, these cost-saving advantages can significantly improve net returns over time.
Challenges and Risks for Retail Investors Using Algorithms
Despite the advantages, retail investors face unique challenges when using algorithms:
Over-Reliance on Technology: Blindly trusting algorithms without understanding underlying mechanics can be risky. A poorly designed algorithm can amplify losses.
Market Competition: Algorithms deployed by institutional investors often have access to superior data, faster execution speeds, and advanced infrastructure, putting retail traders at a relative disadvantage.
Data Limitations: Accurate algorithmic trading requires high-quality data. Retail investors may lack access to premium market data, potentially reducing algorithm effectiveness.
System Failures: Glitches, server downtime, or software errors can lead to unintended trades or significant losses.
Regulatory Risks: Automated trading is subject to market regulations to prevent manipulation and excessive volatility. Retail investors must ensure compliance with evolving rules.
How Retail Investors Leverage Algorithmic Advantages
Retail investors adopt algorithmic advantages through several approaches:
1. Algorithmic Trading Platforms
Platforms like Interactive Brokers, MetaTrader, Zerodha Streak, and Tradestation allow retail investors to design, test, and execute trading strategies automatically. These platforms offer user-friendly interfaces, reducing the need for deep programming expertise.
2. Copy Trading and Social Algorithms
Some platforms enable retail investors to copy trades from successful algorithmic traders or “quants.” This approach provides indirect access to sophisticated strategies without the need for technical coding skills.
3. Robo-Advisors
Robo-advisors leverage algorithms to manage investment portfolios, adjusting asset allocation based on risk tolerance, market conditions, and long-term goals. For retail investors, robo-advisors offer low-cost, automated, and disciplined portfolio management.
4. Data-Driven Decision Making
Retail investors can use algorithms to process market news, social media sentiment, and economic indicators to make informed investment decisions. For example, sentiment analysis algorithms can detect market trends early, providing a competitive edge.
Case Studies and Real-World Examples
Retail Algorithm Adoption in Equities: During recent market volatility, retail investors using algorithmic trading platforms were able to automate buy-and-hold strategies, reducing panic-selling behavior and capturing rebound opportunities.
Cryptocurrency Markets: Retail investors actively use algorithms for crypto trading, executing arbitrage and trend-following strategies in highly volatile environments. Algorithms provide a crucial speed advantage, given the 24/7 nature of crypto markets.
Options Trading: Retail traders increasingly rely on automated options strategies, such as straddles, strangles, and spreads, executed with precise timing and risk controls.
Strategic Implications
The fusion of retail investing and algorithmic trading has long-term implications for market dynamics:
Increased Market Efficiency: Algorithms help reduce pricing inefficiencies, benefiting both retail and institutional investors.
Changing Investor Behavior: Automation reduces the influence of human emotions on markets, potentially leading to more rational trading patterns.
Leveling the Playing Field: Access to algorithmic tools empowers retail investors to compete more effectively against larger institutional players.
Innovation in Financial Products: The rise of retail algorithmic trading encourages financial institutions to create new investment products, platforms, and educational tools catering to tech-savvy individuals.
Conclusion
The convergence of retail investors and algorithmic trading represents a transformative shift in modern financial markets. Retail investors, once limited by capital, information, and execution speed, now have access to tools that enhance speed, reduce emotional biases, enable complex strategies, and optimize portfolio management. However, this advantage comes with challenges: technological reliability, competition from institutional players, data limitations, and regulatory compliance.
Ultimately, the successful retail investor in today’s environment is one who leverages algorithms not as a replacement for judgment, but as an augmentation of research, strategy, and disciplined trading. By integrating human insight with algorithmic precision, retail investors can navigate markets more effectively, reduce risks, and capitalize on opportunities that were previously beyond reach. The future of investing is increasingly hybrid—where the speed of machines meets the strategic thinking of individuals.

Mastering Options Trading Strategies1. Understanding Options Basics
Options are derivative contracts that give the holder the right, but not the obligation, to buy or sell an underlying asset at a predetermined price (strike price) before or at expiration. There are two main types of options:
Call Options: Give the buyer the right to purchase the underlying asset.
Put Options: Give the buyer the right to sell the underlying asset.
Key components include:
Strike Price: The pre-agreed price at which the asset can be bought or sold.
Expiration Date: The date when the option contract becomes void.
Premium: The price paid to acquire the option.
Underlying Asset: The stock, index, commodity, or currency on which the option is based.
Options derive their value from intrinsic and extrinsic components. Intrinsic value reflects the option’s real value if exercised today, while extrinsic value represents the time value and implied volatility.
2. The Greeks – Risk and Reward Management
To master options, traders must understand the Greeks, which measure sensitivity to various risk factors:
Delta (Δ): Measures the rate of change of an option’s price relative to the underlying asset. Calls have positive delta, puts negative.
Gamma (Γ): Measures the rate of change of delta with respect to the underlying price.
Theta (Θ): Measures the time decay of options; critical for understanding how option value erodes over time.
Vega (V): Measures sensitivity to implied volatility.
Rho (ρ): Measures sensitivity to interest rate changes.
Mastering the Greeks allows traders to optimize positions, hedge risks, and understand profit/loss dynamics.
3. Basic Options Strategies
Beginners often start with simple strategies:
a) Long Call
Buying a call option is a bullish strategy. The trader anticipates that the underlying asset will rise above the strike price plus the premium paid. Risk is limited to the premium, while profit potential is theoretically unlimited.
b) Long Put
Buying a put is a bearish strategy. Profit increases as the asset price declines, with risk again limited to the premium.
c) Covered Call
This involves holding the underlying stock while selling a call option. It generates premium income but caps upside potential. Ideal for generating income in neutral to slightly bullish markets.
d) Protective Put
Holding the stock while buying a put protects against downside risk. It’s essentially insurance for your stock holdings, limiting losses while allowing for upside gains.
4. Intermediate Options Strategies
Once traders understand basic strategies, they can explore combinations that manage risk and reward more effectively.
a) Spreads
Vertical Spreads: Buying and selling options of the same type (calls or puts) with different strike prices. Examples:
Bull Call Spread: Buy a lower strike call, sell a higher strike call. Limited risk and profit potential.
Bear Put Spread: Buy a higher strike put, sell a lower strike put for a bearish but controlled position.
Horizontal/Calendar Spreads: Buy and sell options of the same strike price but different expirations, benefiting from time decay and volatility shifts.
Diagonal Spreads: Combination of vertical and calendar spreads, offering flexibility in directional bias, time decay, and volatility management.
b) Straddles
A straddle involves buying a call and a put at the same strike price and expiration. It profits from large price movements in either direction, making it ideal for events like earnings or economic announcements. Risk is limited to the combined premiums paid.
c) Strangles
Similar to straddles, but with different strike prices. It’s cheaper but requires larger price movement to profit.
d) Iron Condor
Selling an out-of-the-money call and put while buying further out-of-the-money options to limit risk. Ideal for range-bound markets, offering limited profit with controlled risk.
e) Butterfly Spread
Involves buying and selling multiple options to profit from minimal price movement. Combines a bull spread and bear spread to create a defined risk/reward profile.
5. Advanced Options Strategies
Professional traders employ advanced strategies to exploit market inefficiencies and volatility patterns.
a) Ratio Spreads
Buying and selling options in unequal ratios. It’s used for volatility plays or directional bias but requires careful risk monitoring.
b) Calendar Diagonal Adjustments
Adjusting existing spreads as the market moves, managing delta and theta exposure dynamically.
c) Volatility Arbitrage
Traders exploit differences between implied and historical volatility. Strategies like long straddles or strangles are used when implied volatility is mispriced.
d) Synthetic Positions
Creating equivalent positions using combinations of options and underlying assets:
Synthetic Long Stock: Buy call + sell put.
Synthetic Short Stock: Buy put + sell call.
These mimic stock exposure but require less capital.
6. Options Risk Management
Successful options trading hinges on effective risk control:
Position Sizing: Never risk more than a small percentage of capital on one trade.
Diversification: Spread options trades across sectors, expirations, and strategies.
Hedging: Use protective puts or inverse positions to limit downside.
Stop-Loss Orders: Predefine exit levels to prevent emotional decisions.
Volatility Awareness: Avoid buying expensive options during peak implied volatility.
7. Timing and Market Conditions
Options strategies depend heavily on market conditions:
Bullish Markets: Favor long calls, bull spreads, and covered calls.
Bearish Markets: Favor long puts, bear spreads, protective puts.
Range-Bound Markets: Favor iron condors, butterflies, and credit spreads.
High Volatility: Buy straddles or strangles to capitalize on large moves.
Low Volatility: Sell premium strategies like credit spreads or covered calls.
8. Execution and Trading Discipline
Mastery involves more than strategy knowledge. Execution and discipline are equally vital:
Plan Trades in Advance: Define entry, exit, and risk parameters.
Avoid Emotional Trading: Stick to strategies and rules.
Track Performance: Maintain a journal to analyze mistakes and successes.
Continuous Learning: Markets evolve; stay updated on new strategies and economic factors.
9. Tools for Options Traders
Modern traders leverage tools for analytics:
Options Pricing Models: Black-Scholes, Binomial, and Monte Carlo simulations for pricing and Greeks.
Options Scanners: Identify unusual activity, volatility spikes, and profitable spreads.
Backtesting Platforms: Test strategies on historical data before committing capital.
Broker Platforms: Must offer fast execution, risk management tools, and margin calculations.
10. Psychological and Strategic Edge
Options trading is as much psychological as mathematical:
Patience and Discipline: Wait for optimal setups; avoid chasing trades.
Adaptability: Adjust positions as market dynamics shift.
Understanding Market Sentiment: Technical and fundamental cues impact volatility and options pricing.
Risk-Reward Assessment: Always evaluate maximum loss versus potential gain before initiating trades.
11. Common Pitfalls to Avoid
Ignoring Greeks: Leads to unexpected losses from time decay or volatility changes.
Overleveraging: Options can magnify losses; excessive size can wipe accounts.
Lack of Strategy: Random trades without plan often fail.
Chasing Premiums: High volatility premiums may be overpriced; patience is key.
Neglecting Exit Plans: Without clear exit rules, profits can evaporate, and losses can magnify.
12. Path to Mastery
Mastering options trading requires:
Strong Foundation: Understand options mechanics, Greeks, and market behavior.
Structured Learning: Progress from basic calls and puts to spreads, straddles, and synthetic positions.
Practice: Use paper trading or simulated accounts to build experience without financial risk.
Continuous Analysis: Study past trades, track volatility patterns, and adapt strategies.
Discipline: Follow trading rules strictly, avoid impulsive decisions, and respect risk management principles.
Conclusion
Options trading offers unmatched flexibility and leverage, but it is complex and requires disciplined learning. Mastery comes from understanding the interplay of market conditions, volatility, and strategic positioning. By combining solid fundamentals, risk management, strategic execution, and psychological discipline, traders can convert options into a powerful tool for wealth creation and portfolio management. Whether aiming for conservative income strategies or aggressive directional bets, a structured approach to options trading ensures long-term success while minimizing unnecessary risks.

Pair Trading and Statistical ArbitrageIntroduction
In the modern world of financial markets, trading strategies have evolved beyond mere speculation to include sophisticated mathematical and statistical methods. Two such strategies—pair trading and statistical arbitrage—have gained significant traction among institutional traders, hedge funds, and quantitative analysts. Both methods rely on identifying price relationships and exploiting short-term inefficiencies, offering traders the potential to earn profits regardless of market direction. These strategies are categorized under market-neutral trading, meaning they aim to minimize market exposure while profiting from relative price movements.
Pair Trading: Concept and Fundamentals
Pair trading is a market-neutral strategy that involves trading two historically correlated assets, usually stocks, such that when the price of one asset deviates from the other, traders take positions expecting a reversion to the mean. This approach was popularized by Nunzio Tartaglia and the quantitative team at Morgan Stanley in the 1980s and has since become a staple in quantitative trading.
Key Principles of Pair Trading:
Correlation Analysis:
The first step is to identify two assets with historically high correlation. This means that their prices generally move in tandem due to common economic, sectoral, or company-specific factors. For example, Coca-Cola and Pepsi, being major competitors in the beverage sector, often exhibit high correlation.
Price Divergence Detection:
Once a pair is selected, traders monitor for deviations from their historical price ratio. If one asset significantly outperforms the other, a trading opportunity arises.
Market-Neutral Positioning:
In a typical pair trade, traders buy the underperforming asset and short-sell the outperforming asset, expecting the spread to converge back to historical norms.
Mean Reversion Hypothesis:
Pair trading relies on the assumption of mean reversion—that asset prices will revert to their historical relationship over time. This principle differentiates pair trading from trend-following strategies, which assume that asset prices will continue in the same direction.
Example of a Pair Trade:
Selection: Consider stocks A and B, which normally maintain a 1:1 price ratio.
Divergence: Stock A rises by 10% while Stock B remains unchanged.
Trade Setup: Trader shorts Stock A and goes long on Stock B.
Outcome: If the prices converge (Stock A falls or Stock B rises), the trader profits from the spread rather than the absolute price movement.
Advantages of Pair Trading:
Market Neutrality: Profits can be made in bullish, bearish, or sideways markets.
Risk Reduction: Diversification across two correlated assets reduces exposure to overall market risk.
Quantitative Precision: Historical data allows statistical modeling to optimize entry and exit points.
Limitations:
Model Risk: Historical correlations may break due to structural market changes.
Execution Costs: Frequent trades may incur transaction costs and slippage, affecting profitability.
Tail Risk: Extreme market events can disrupt correlations, leading to significant losses.
Statistical Arbitrage: Advanced Quantitative Strategy
Statistical arbitrage (or stat arb) is a broader, more sophisticated trading strategy that extends the principles of pair trading to multiple assets, sectors, or even markets. It uses advanced statistical and mathematical models to exploit short-term mispricings across securities. Unlike pair trading, which focuses on a single pair, statistical arbitrage often involves portfolios of hundreds of assets, dynamically adjusting positions based on predictive models.
Core Components of Statistical Arbitrage:
Quantitative Modeling:
Stat arb relies on rigorous quantitative techniques such as cointegration analysis, principal component analysis (PCA), and machine learning algorithms to identify relationships among assets and forecast price deviations.
High-Frequency and Low-Latency Trading:
Many stat arb strategies operate in high-frequency trading (HFT) environments, capitalizing on price inefficiencies that exist for milliseconds or seconds. Advanced infrastructure is critical to minimize latency and maximize profits.
Mean Reversion and Momentum Models:
While pair trading primarily depends on mean reversion, stat arb strategies can integrate momentum signals, volatility adjustments, and cross-asset relationships, making them more adaptive to changing market conditions.
Portfolio Diversification:
Statistical arbitrage typically constructs a market-neutral portfolio where the combined long and short positions are balanced. This diversification reduces idiosyncratic risk and enhances the stability of returns.
Steps in Statistical Arbitrage:
Data Collection: Gather historical prices, volumes, fundamental data, and macroeconomic indicators.
Signal Generation: Use statistical methods to identify mispricings or anomalies.
Position Sizing: Optimize weights of long and short positions using risk-adjusted metrics like Sharpe ratios or Value at Risk (VaR).
Execution: Employ automated trading systems to enter and exit positions efficiently.
Monitoring and Adjustment: Continuously recalibrate models to adapt to market changes.
Example of Stat Arb:
Universe Selection: 100 tech stocks listed on the NASDAQ.
Signal Identification: PCA reveals that three stocks deviate significantly from their predicted factor loadings.
Trade Execution: Short the overperforming stocks and go long on underperforming ones, with hedging adjustments to maintain market neutrality.
Profit Realization: Gains come from convergence toward predicted statistical relationships rather than the absolute market movement.
Advantages of Statistical Arbitrage:
High Return Potential: Exploiting numerous minor mispricings across assets can compound into substantial profits.
Robust Risk Management: Diversification across multiple positions reduces the impact of single-event risks.
Algorithmic Precision: Automated systems allow for consistent application of complex models without emotional bias.
Limitations:
Model Complexity: Requires sophisticated mathematical knowledge and programming expertise.
Data Dependency: Reliance on historical patterns may fail in new market regimes or during structural breaks.
Competition and Crowding: High adoption among hedge funds can reduce alpha generation and compress profits.
Transaction Costs: Frequent trading can significantly erode net returns if not carefully managed.
Applications in Modern Markets
Equity Markets:
Both strategies are extensively used in stock markets. Pair trading is popular among retail and hedge fund traders, while stat arb dominates quantitative hedge funds like Renaissance Technologies and Two Sigma.
Forex Markets:
Currency pairs offer excellent opportunities for pair trading due to their inherent correlation, especially in major currency crosses like EUR/USD and GBP/USD.
Commodity Markets:
Related commodities such as crude oil and natural gas, or gold and silver, can be traded using mean reversion-based strategies.
Derivatives:
Options and futures can be incorporated in statistical arbitrage models to hedge volatility and leverage complex payoffs.
Cross-Market Arbitrage:
Advanced stat arb strategies may exploit mispricings between equities, bonds, commodities, and currencies, often using global market data for predictive modeling.
Risk Management Considerations
Even market-neutral strategies are not risk-free. Key considerations include:
Correlation Breakdown: Assets that were historically correlated may diverge due to sectoral shocks or macroeconomic events.
Execution Risk: Delays, slippage, and partial fills can reduce expected profits.
Model Risk: Overfitting historical data may generate false signals.
Liquidity Risk: Some stocks or assets may lack sufficient volume to execute large positions without impacting price.
Tail Risk Events: Extreme market events, like the 2008 financial crisis, can overwhelm statistical relationships.
Effective risk management involves:
Position limits
Stop-loss mechanisms
Diversification across multiple pairs or portfolios
Continuous model recalibration
Technological Requirements
Both pair trading and statistical arbitrage benefit from technology:
Data Infrastructure: Access to high-quality historical and real-time data is critical.
Algorithmic Trading Platforms: Automatic order placement reduces latency and improves execution efficiency.
Statistical Software: Tools like Python, R, MATLAB, and machine learning frameworks enable modeling of complex relationships.
Backtesting Capabilities: Simulating strategies on historical data helps identify weaknesses before deploying capital.
Conclusion
Pair trading and statistical arbitrage represent the pinnacle of quantitative, market-neutral trading strategies. Pair trading offers a straightforward approach based on relative price movements between two correlated assets, while statistical arbitrage scales this concept to multiple securities, employing complex models to exploit small inefficiencies. Both approaches underscore the importance of data-driven decision-making, risk management, and technological sophistication in modern financial markets.
While these strategies can generate consistent returns with reduced exposure to market direction, they are not without challenges. Market structural changes, execution costs, and model risk can erode profitability if not carefully managed. Therefore, success in pair trading and statistical arbitrage requires a combination of statistical expertise, trading discipline, and continuous adaptation to evolving market conditions.
Ultimately, these strategies exemplify how modern finance increasingly relies on quantitative methods, automation, and statistical reasoning to navigate complex markets and extract alpha in a competitive, high-speed trading environment.
Thematic Trading vs. Sectoral Rotation: A Comprehensive Analysis1. Introduction to Market Strategies
Investors constantly seek strategies to outperform the market, hedge risks, and align investments with broader economic and societal trends. Two such strategies—thematic trading and sectoral rotation—have gained prominence in recent years due to their potential to deliver above-average returns while allowing investors to align their portfolios with macroeconomic or microeconomic shifts.
Thematic trading involves identifying long-term structural trends or themes that could drive growth across multiple sectors and regions. This strategy is typically future-oriented and is influenced by technological innovation, demographic shifts, environmental changes, and other global trends.
Sectoral rotation, on the other hand, focuses on moving investments between different sectors of the economy depending on the current stage of the economic cycle or market sentiment. It is cyclical and tends to rely on macroeconomic indicators, corporate earnings reports, and sector-specific valuations.
While both strategies aim to enhance returns, their methodologies, timelines, and risk profiles differ significantly.
2. Thematic Trading: Definition and Approach
Thematic trading is the practice of investing based on overarching global or domestic trends that are expected to persist over a long period. These themes are not limited to individual sectors but often span multiple industries, geographies, or asset classes.
2.1 Key Characteristics
Long-term horizon: Thematic trading typically involves a medium- to long-term investment horizon, often spanning several years or even decades.
Trend-driven: Themes are identified based on macro trends like technological innovation (e.g., AI, robotics), environmental sustainability (e.g., renewable energy), or demographic shifts (e.g., aging populations, urbanization).
Cross-sector approach: Investments often span multiple sectors affected by the theme. For example, a “clean energy” theme could include solar manufacturers, battery producers, and electric vehicle companies.
Narrative-based: Thematic investing often relies on compelling narratives supported by research rather than purely quantitative indicators.
2.2 Examples of Popular Themes
Technology Revolution: AI, cloud computing, 5G, and semiconductors.
Green Energy & Sustainability: Solar, wind, electric vehicles, and ESG-focused companies.
Demographic Shifts: Companies targeting aging populations, healthcare innovation, or emerging markets urbanization.
Digital Economy: E-commerce, fintech, online entertainment, and cybersecurity.
2.3 Advantages of Thematic Trading
Alignment with macro trends: Investors can capitalize on long-term structural shifts before they are fully priced into the market.
Diversification across sectors: Even though the investment is theme-based, exposure across multiple industries reduces the risk of sector-specific shocks.
High growth potential: Being early in a theme can lead to substantial capital gains, especially if the trend becomes dominant.
2.4 Challenges of Thematic Trading
Execution risk: Identifying a successful theme and selecting the right companies or instruments requires extensive research.
Volatility: Themes can be highly sensitive to market sentiment, technological breakthroughs, or regulatory changes.
Timing difficulty: While the long-term trend may be solid, short-term corrections can be severe.
3. Sectoral Rotation: Definition and Approach
Sectoral rotation is a strategy where investors periodically shift their investments from one sector to another to capitalize on economic cycles. Unlike thematic trading, which is trend-driven, sectoral rotation is cycle-driven.
3.1 Key Characteristics
Short- to medium-term horizon: Typically ranges from a few months to a few years, depending on the economic cycle.
Cyclicality: Sector performance is tied to the stages of the economic cycle—expansion, peak, contraction, and trough.
Macro-driven: Investors rely heavily on macroeconomic indicators, such as GDP growth, interest rates, inflation, and consumer confidence, to anticipate sector performance.
Active management: Sector rotation requires regular monitoring and adjustments to the portfolio based on evolving economic conditions.
3.2 Economic Cycle and Sector Performance
Different sectors historically perform better at different stages of the economic cycle:
Economic Stage Sectors Likely to Outperform
Expansion Technology, Industrials, Consumer Discretionary
Peak Energy, Materials, Industrials
Contraction Consumer Staples, Utilities, Healthcare
Trough Financials, Real Estate, Technology (selective)
This table demonstrates that sector rotation is closely tied to macroeconomic trends rather than long-term structural shifts.
3.3 Advantages of Sectoral Rotation
Capitalizing on cycles: Investors can enhance returns by moving capital into sectors poised to outperform in the current economic phase.
Risk mitigation: By exiting underperforming sectors, investors can reduce exposure to cyclical downturns.
Data-driven decisions: Decisions are grounded in macroeconomic and sector-specific data, making it systematic.
3.4 Challenges of Sectoral Rotation
Timing risk: Mistiming entry or exit from sectors can erode returns.
Frequent adjustments: Requires active portfolio management, which can increase transaction costs.
Market unpredictability: Economic indicators do not always perfectly predict sector performance; external shocks can disrupt patterns.
4. Practical Implementation
4.1 Implementing Thematic Trading
Research: Identify global megatrends and assess their sustainability.
Stock selection: Pick companies that are leaders or innovators in the theme.
ETFs & mutual funds: Thematic ETFs offer diversified exposure to the theme without concentrated stock risk.
Portfolio allocation: Typically a part of a broader diversified strategy due to high volatility.
4.2 Implementing Sectoral Rotation
Macro analysis: Monitor economic indicators such as interest rates, industrial production, consumer spending, and inflation.
Sector selection: Identify sectors likely to outperform in the current stage of the economic cycle.
Tactical allocation: Adjust portfolio weights periodically to optimize returns.
Use of ETFs: Sector ETFs allow quick rotation without individual stock risk.
5. Synergies and Integration
Interestingly, investors can combine thematic trading and sectoral rotation to balance long-term growth and short-term tactical gains. For example:
Base investment in long-term themes like renewable energy or AI for structural growth.
Tactical adjustments through sectoral rotation based on economic cycles to capture cyclical opportunities in related sectors.
This hybrid approach leverages the strengths of both strategies—long-term upside potential from thematic exposure and short-term performance enhancement from tactical rotation.
6. Risk Considerations
6.1 Thematic Trading Risks
Misjudging the theme’s longevity or relevance.
Concentration in a narrow set of high-growth stocks.
Regulatory or technological disruptions affecting the theme.
6.2 Sectoral Rotation Risks
Poor timing leading to missed gains or losses.
Unexpected macro shocks that disrupt sector performance.
Overtrading, leading to high transaction costs.
Mitigation strategies include diversification, continuous research, use of ETFs, and disciplined rebalancing.
Conclusion
Thematic trading and sectoral rotation are powerful investment strategies, each tailored to different market perspectives and investor goals.
Thematic trading offers exposure to transformative long-term trends and is suitable for investors with a higher risk appetite and long-term horizon. It relies on strategic vision and foresight into future developments.
Sectoral rotation is a tactical, cycle-driven approach that allows investors to capitalize on short- to medium-term opportunities in line with the economic cycle. It demands active monitoring and timing skills.
Understanding the distinction, strengths, and limitations of these strategies enables investors to select the right approach—or a combination—for their portfolio objectives. While thematic trading emphasizes vision and innovation, sectoral rotation emphasizes timing and macro awareness. When used thoughtfully, both can significantly enhance portfolio returns while mitigating risk.

How to Control Trading Risk FactorsIntroduction
Trading, whether in stocks, forex, commodities, or cryptocurrencies, offers immense opportunities for profit—but also significant risk. Every trader, from a beginner to a seasoned professional, must manage uncertainty and potential losses that accompany market volatility. The key to long-term success in trading is not just finding profitable opportunities but controlling risk effectively. Managing risk ensures survival during market downturns and allows traders to stay in the game long enough to benefit from profitable phases.
This comprehensive guide explains the major risk factors in trading and the best strategies to control them through discipline, planning, diversification, and emotional control.
1. Understanding Trading Risk
Trading risk refers to the potential for losses resulting from changes in market prices, volatility, leverage, or unexpected events. It is impossible to eliminate risk completely, but traders can minimize it through strategic planning and risk management tools.
There are several kinds of trading risks:
Market Risk:
The most common type, arising from fluctuations in price due to supply-demand shifts, geopolitical events, or macroeconomic indicators.
Liquidity Risk:
Occurs when an asset cannot be sold quickly without causing a significant price drop.
Leverage Risk:
Using borrowed funds to trade can amplify both gains and losses, leading to faster account depletion.
Operational Risk:
Includes system failures, technical glitches, or execution errors in placing orders.
Psychological Risk:
Emotional decision-making due to greed, fear, or overconfidence, often leading to poor trades.
Political and Economic Risk:
Policy changes, elections, or international conflicts that disrupt market stability.
Understanding these risks is the first step toward developing strategies to control them effectively.
2. Importance of Risk Management in Trading
Risk management is the foundation of professional trading. It focuses on preserving capital rather than chasing profit. The main objective is to ensure that no single trade or event can cause catastrophic losses.
Key benefits of risk management include:
Capital preservation: Protecting your funds ensures longevity in the market.
Consistency: Avoids large losses that disrupt performance.
Emotional stability: Reduces stress and prevents impulsive decisions.
Improved performance: Controlled risk allows traders to follow strategies with discipline.
A trader who loses 50% of their account needs to make a 100% return just to break even. Hence, risk control is not optional—it is essential for survival and growth.
3. Setting a Risk Tolerance Level
Every trader should establish a risk tolerance—the amount they are willing to lose on a trade or series of trades. This depends on:
Trading capital
Experience level
Market volatility
Personal financial goals
A common rule is to risk no more than 1-2% of total capital per trade. For example, if your account is $10,000, your maximum loss per trade should not exceed $100–$200. This ensures that even a streak of losing trades will not wipe out your account.
Additionally, it’s important to determine your maximum drawdown tolerance—the total loss from peak to trough that you can sustain before reconsidering your strategy.
4. Position Sizing and Capital Allocation
Position sizing is the process of determining how much capital to allocate to a particular trade. Proper position sizing prevents overexposure to a single asset.
A simple formula for determining position size is:
Position Size = (Account Size × Risk per Trade) ÷ Stop-Loss Distance
For example, if your account size is $20,000 and you risk 2% ($400) per trade, with a stop-loss 50 points away, your position size should be $8 per point ($400 ÷ 50).
In addition:
Diversify across sectors, currencies, or asset classes.
Avoid correlated trades (e.g., trading both crude oil and energy stocks simultaneously).
Keep a cash reserve for volatility spikes or margin calls.
5. The Role of Stop-Loss Orders
Stop-loss orders are one of the most effective tools for risk control. They automatically close a position when the price hits a predetermined level, preventing further losses.
Types of stop-loss orders include:
Fixed Stop-Loss: Set at a specific price level.
Trailing Stop-Loss: Moves with the price, locking in profit as the market moves favorably.
Volatility-Based Stop: Adjusted based on the market’s volatility using tools like the Average True Range (ATR).
Stop-loss placement should depend on market structure, not emotions. Setting it too close might trigger premature exits, while too far may cause large losses.
A good strategy is to place stops beyond key support/resistance levels, maintaining a favorable risk-to-reward ratio—ideally 1:2 or better (risking $1 to make $2).
6. Using Take-Profit and Trailing Strategies
While stop-losses limit downside, take-profit levels lock in gains. Establishing clear profit targets ensures you don’t let greed turn winning trades into losing ones.
A trailing stop adjusts dynamically as the price moves in your favor, allowing profits to grow while protecting gains. For example, if a stock rises from $100 to $110, a trailing stop set at $2 below the highest price would lock in profits once the price falls to $108.
This method balances the desire for larger profits with the discipline to protect existing ones.
7. Diversification and Correlation Control
Diversification spreads risk across multiple instruments, reducing the impact of a single loss. However, diversification must be intelligent. Holding several highly correlated assets does not reduce risk—it simply multiplies exposure.
For example:
Gold and silver often move in the same direction.
Major currency pairs like EUR/USD and GBP/USD are positively correlated.
Traders can analyze correlation coefficients to ensure portfolio balance. Aim to include assets with low or negative correlations, such as stocks and bonds, or currencies from different regions.
8. Managing Leverage and Margin
Leverage amplifies both profit and loss. While it attracts traders with the promise of higher returns, it can quickly lead to ruin if not controlled.
To manage leverage risk:
Use lower leverage ratios (e.g., 1:5 or 1:10) instead of excessive ones (1:100).
Monitor margin levels carefully to avoid forced liquidations.
Trade only with funds you can afford to lose.
Professional traders use leverage sparingly, often only when they have strong conviction and a clear stop-loss strategy.
9. Risk-Reward Ratio and Probability Management
Successful traders focus on probabilities, not predictions. Every trade should have a positive expected value (EV)—meaning potential profit outweighs potential loss.
The formula for expected value is:
EV = (Winning Probability × Average Win) – (Losing Probability × Average Loss)
For example, if your strategy wins 60% of the time with an average win of $200 and an average loss of $100, then:
EV = (0.6 × 200) – (0.4 × 100) = $80 profit per trade on average.
Maintaining a risk-to-reward ratio of 1:2 or higher ensures profitability even with moderate accuracy.
10. Technical and Fundamental Risk Control Tools
Modern trading offers numerous analytical tools to control risk:
Technical Indicators: Moving Averages, RSI, MACD, and Bollinger Bands help identify trend strength and reversal points.
Volatility Measures: The Average True Range (ATR) and VIX index guide traders on when to reduce position sizes during high volatility.
Fundamental Analysis: Studying interest rates, inflation data, and earnings reports helps anticipate market shifts.
Sentiment Analysis: Tracking market sentiment can reveal overbought or oversold conditions.
Combining these approaches gives a comprehensive understanding of when to enter or exit trades safely.
11. The Psychology of Risk Control
One of the biggest challenges in trading is emotional control. Fear and greed can distort judgment, leading to impulsive trades or hesitation.
To control psychological risk:
Follow a trading plan: Stick to predefined rules for entry, exit, and risk.
Avoid revenge trading: Don’t try to recover losses immediately—it often worsens them.
Accept losses as part of the process: Even the best traders lose frequently.
Use journaling: Track your trades and emotions to identify behavioral patterns.
Emotional discipline is as important as technical skill in maintaining consistent performance.
12. Developing a Risk Management Plan
A well-structured risk management plan should include:
Trading Goals: Define profit targets and acceptable drawdown limits.
Capital Allocation: Decide how much capital to risk per trade.
Position Sizing Formula: Apply consistent rules for trade volume.
Stop-Loss and Take-Profit Rules: Set these before entering any trade.
Diversification Strategy: Limit exposure to correlated assets.
Review Process: Analyze performance weekly or monthly and adjust strategies.
This plan acts as a rulebook, keeping traders objective even during volatile market conditions.
13. Technology and Automation in Risk Control
Automation has revolutionized risk management. Algorithmic trading systems can execute trades with predefined rules, removing emotional bias.
Tools like:
Automated stop-loss execution
Portfolio tracking dashboards
Risk calculators
help traders monitor exposure and respond to changing conditions instantly.
Moreover, AI-driven trading systems can detect unusual market movements, improving real-time decision-making.
14. Continuous Learning and Adaptation
Markets evolve constantly. Economic cycles, regulations, and technology all influence volatility. Hence, traders must continuously adapt their risk management techniques.
Regularly review:
Strategy performance metrics (win rate, profit factor, drawdown).
Market news and central bank policies.
Trading journal entries to refine emotional and strategic weaknesses.
Adaptability separates successful traders from those who fail to adjust to new realities.
Conclusion
Controlling trading risk is not about eliminating it—it’s about managing it intelligently. A trader who understands risk tolerance, uses proper position sizing, applies stop-loss orders, diversifies holdings, and maintains emotional discipline builds a foundation for consistent success.
Risk control transforms trading from gambling into a professional, structured endeavor. By mastering capital management, leverage discipline, and psychological stability, traders ensure longevity in the market. Remember, the best traders are not those who make the most money in one day—but those who never lose too much on any single day.
Trading will always involve uncertainty, but with a robust risk control strategy, you can turn that uncertainty into opportunity—confidently, consistently, and profitably.
Trading Volume Secrets Finally OutIntroduction: The Hidden Power Behind Market Movements
In the world of financial markets, price is often the first thing traders look at — but it’s not the whole story. Beneath every price chart lies another powerful force: trading volume. While price tells us what is happening, volume reveals why. Understanding trading volume can uncover the true intentions of large institutional players, validate price trends, and expose false breakouts before they trap unsuspecting traders.
For years, professional traders and institutions have quietly used volume analysis as their secret weapon — guiding their decisions on when to buy, sell, or stay out. Today, we reveal those trading volume secrets and explain how you can use them to your advantage.
1. What Is Trading Volume?
Trading volume represents the total number of shares, contracts, or units traded in a given period. In simple terms, it measures market activity and participation.
For example, if 10 million shares of a stock are exchanged in one day, its trading volume for that day is 10 million. High volume often means strong investor interest, while low volume reflects uncertainty or lack of conviction.
But beyond raw numbers, volume tells a deeper story — it shows how committed traders are to a price move. A rally with low volume is like a building on weak foundations; it may not stand for long. Conversely, a price move backed by heavy volume indicates strength and sustainability.
2. Why Volume Is the “Truth Teller” of the Market
Volume is often called the fuel of the market because price cannot move significantly without participation. Large institutions such as mutual funds, hedge funds, and banks execute trades in high volume, and their footprints appear in the volume data.
Let’s break down why volume is considered the ultimate confirmation tool:
Price without volume is illusion: If prices rise but volume stays low, it usually signals a temporary move — often driven by retail traders or short covering.
Volume precedes price: Many times, spikes in volume appear before a major trend reversal. Smart money often accumulates (buys quietly) or distributes (sells gradually) before the market reacts.
Volume confirms strength: Strong uptrends are characterized by increasing volume on rallies and decreasing volume on pullbacks. Weak trends show the opposite.
In essence, while prices can be manipulated in the short term, volume reveals the conviction behind the move.
3. The Hidden Patterns of Volume
Let’s explore the patterns and clues traders can extract from volume behavior:
a. Rising Volume with Rising Price
This is the hallmark of a strong bullish trend. When prices climb and volume increases simultaneously, it indicates growing confidence among buyers. Institutions are entering positions, and retail traders often follow later.
b. Falling Volume with Rising Price
This is a warning sign. It suggests that the rally may be losing momentum, with fewer participants supporting higher prices. Such moves are often followed by corrections.
c. Rising Volume with Falling Price
When volume expands as prices fall, it signals strong selling pressure — possibly from large investors exiting. This pattern often appears before or during a bearish trend.
d. Falling Volume with Falling Price
This pattern indicates a weakening downtrend. Sellers are losing interest, and a reversal could be near.
e. Volume Spikes
Sudden, unusually high volume often marks key turning points. For example, after a long decline, a massive surge in volume might signal capitulation — the moment when panic selling exhausts itself and a reversal begins.
4. The Volume–Price Relationship
One of the most powerful ways to read markets is through Volume Price Analysis (VPA) — a method popularized by legendary trader Richard Wyckoff. The concept is simple but profound:
“Price shows you the move. Volume shows you the intention.”
In VPA, traders analyze how price bars and volume bars interact to spot accumulation (buying) and distribution (selling) phases.
Key Scenarios:
Wide range up bar with high volume: Strong buying interest — bullish confirmation.
Wide range up bar with ultra-high volume but small price progress: Indicates potential selling into strength (distribution by smart money).
Narrow range down bar with high volume: Could signal absorption — buyers quietly accumulating as weak holders sell.
Narrow range bar with low volume: Market is quiet; often a precursor to a breakout or breakdown.
5. The Smart Money Volume Trap
One of the biggest volume secrets lies in understanding institutional behavior. Big players cannot simply buy or sell millions of shares at once without moving the market against themselves. Instead, they use volume manipulation tactics:
Accumulation Phase
Institutions quietly buy from retail sellers at lower prices.
Volume gradually increases but prices stay range-bound.
Fake breakdowns may occur to scare retail traders into selling.
Markup Phase
After accumulating enough, institutions push prices higher.
Volume rises sharply as retail traders jump in — too late.
The trend appears “obvious” now, but smart money is already positioned.
Distribution Phase
Prices stay high, but volume remains elevated.
Institutions offload their holdings to late entrants.
Once selling pressure exceeds buying demand, the trend reverses.
Markdown Phase
The market declines sharply as retail panic sets in.
Volume spikes again — institutions may start re-accumulating at lower levels.
Recognizing these volume cycles can help traders follow the smart money instead of fighting it.
6. Volume Indicators and Tools
Several technical indicators help traders interpret volume more effectively. Here are the most valuable ones:
a. On-Balance Volume (OBV)
Developed by Joseph Granville, OBV adds volume on up days and subtracts it on down days. It helps confirm trends:
If OBV rises while price rises → bullish confirmation.
If OBV falls while price rises → bearish divergence (possible reversal).
b. Volume Moving Average
A moving average of volume smooths out fluctuations, showing long-term participation trends. If current volume exceeds the average, a significant move may be starting.
c. Volume-Weighted Average Price (VWAP)
VWAP is the average price weighted by volume over a specific period. Institutional traders use it to gauge fair value and execute large orders without distorting the market.
d. Accumulation/Distribution Line (A/D)
This indicator measures the relationship between price and volume to determine whether a stock is being accumulated (bought) or distributed (sold).
e. Chaikin Money Flow (CMF)
CMF combines price and volume to assess buying and selling pressure. A positive CMF suggests accumulation, while a negative value signals distribution.
7. Volume and Breakouts: Separating Truth from Traps
Breakouts are among the most profitable — and most dangerous — trading setups. The secret to identifying genuine breakouts lies in volume:
True breakout: Strong volume confirms that many participants are involved, supporting the move.
False breakout: Low or declining volume suggests a lack of conviction, often leading to a quick reversal.
A simple rule:
No volume, no trust.
Before entering a breakout trade, always check if the breakout candle is backed by higher-than-average volume.
8. Using Volume in Different Markets
Volume analysis is not limited to stocks — it’s powerful across multiple asset classes:
a. Stock Market
Volume confirms institutional participation, validates price patterns (like head-and-shoulders or triangles), and signals breakouts.
b. Forex Market
While spot forex lacks centralized volume data, traders use tick volume (number of price changes) as a proxy. It closely mirrors real volume trends.
c. Futures and Commodities
Volume helps identify contract rollovers, open interest changes, and institutional positioning in commodities like oil, gold, or wheat.
d. Cryptocurrency Market
Crypto volume data is transparent and real-time. Tracking exchange volume and blockchain transaction volume can reveal whale (large holder) activity.
9. Volume Divergence: The Secret Reversal Signal
Volume divergence occurs when price moves in one direction, but volume does not confirm it. This often signals an upcoming reversal.
Example:
Price keeps making new highs, but volume is shrinking → buyers are losing strength.
Price falls to new lows, but volume declines → selling pressure is fading.
Such divergences often precede significant turning points — a key secret used by experienced traders.
10. How to Use Volume in Your Trading Strategy
Here’s a practical framework to integrate volume into your trading decisions:
Identify the trend direction using price action or moving averages.
Confirm trend strength by checking if volume supports the move.
Spot accumulation or distribution zones by observing volume spikes in sideways ranges.
Validate breakouts or breakdowns using volume surges.
Watch for divergence between price and volume to anticipate reversals.
Use volume indicators like OBV or VWAP to add confirmation.
Avoid low-volume environments, as they often lead to false signals and poor liquidity.
11. Psychological Secrets Hidden in Volume
Volume is not just a technical metric — it reflects trader psychology. Every spike in volume represents emotional intensity — fear, greed, or panic. Understanding this psychology can give traders an edge:
High volume at peaks: Euphoria and greed dominate; retail traders rush in.
High volume at bottoms: Panic selling and capitulation occur; smart money steps in.
Steady volume rise: Confidence builds gradually — a healthy trend.
Volume drop: Uncertainty, hesitation, or lack of interest.
Reading volume is like listening to the market’s heartbeat. It tells you when enthusiasm grows, when fear spreads, and when calm returns.
12. Common Mistakes in Volume Analysis
Even though volume is powerful, traders often misuse it. Avoid these pitfalls:
Ignoring context — volume must always be read alongside price action.
Comparing volume across different assets — what’s high for one stock may be low for another.
Focusing only on daily volume — intraday and weekly patterns provide richer insights.
Assuming every spike means reversal — sometimes it’s just news-driven volatility.
13. The Future of Volume Analysis
With algorithmic and high-frequency trading dominating modern markets, volume analysis is evolving. Artificial intelligence tools now analyze not just how much volume trades, but who is trading it — institutions, retail investors, or algorithms.
Smart traders use volume profile tools to study how volume is distributed across price levels, identifying zones of high interest called value areas. These act as support and resistance levels far stronger than those based on price alone.
Conclusion
Trading volume is far more than a simple statistic — it’s the hidden force that drives markets. It reflects participation, conviction, and emotion, providing traders with vital clues that price alone cannot offer.
By mastering volume analysis, traders can see beneath the surface of price movements — spotting accumulation before rallies, distribution before crashes, and false breakouts before they trap the crowd.
In essence, volume is the truth teller of the market. When price and volume move together, trends thrive. When they diverge, caution is warranted. Understanding these volume secrets transforms ordinary chart reading into professional market analysis — the same skill that separates the pros from the amateurs.

Part 1 Candle Stick Pattern Real-Life Example
Suppose you expect Reliance Industries stock to rise from ₹2,500 to ₹2,600 next month.
You buy a Call Option with a strike price of ₹2,500 for a premium of ₹50.
If Reliance reaches ₹2,600 → Profit = ₹100 - ₹50 = ₹50 per share
If Reliance stays below ₹2,500 → You lose only ₹50 premium
Thus, your risk is limited, but your reward can be significant.

Divrgence Secrets The Indian Options Market
In India, NSE (National Stock Exchange) is the major platform for options trading.
Most trading occurs in index options like NIFTY and BANKNIFTY, and in stock options of large companies.
Options are settled in cash, and expiry usually happens weekly (for indices) and monthly (for stocks).

PCR Trading StrategiesWhy Traders Use Options
Options are used for several strategic purposes:
Hedging: Protecting existing positions from price fluctuations.
Speculation: Earning profits from expected price movements with limited capital.
Income Generation: Selling options to collect premiums regularly.
Leverage: Controlling large positions with smaller amounts of money.

Part 2 Intraday TradingTypes of Options
There are two main types of options:
a. Call Option
A Call Option gives the holder the right to buy an asset at a specific price within a set time.
Traders buy call options when they expect the price of the asset to rise.
Example:
If a stock is trading at ₹100 and you buy a call option with a strike price of ₹110, you will profit if the stock rises above ₹110 before expiry.
b. Put Option
A Put Option gives the holder the right to sell an asset at a specific price within a set time.
Traders buy put options when they expect the price of the asset to fall.
Example:
If the stock is at ₹100 and you buy a put option with a strike price of ₹90, you will profit if the stock price falls below ₹90 before expiry.

Part 1 Intraday TradingKey Terms in Option Trading
To understand option trading well, you must know these important terms:
Strike Price: The fixed price at which the underlying asset can be bought or sold.
Premium: The price paid to purchase an option.
Expiry Date: The date when the option contract ends.
In the Money (ITM): When exercising the option is profitable.
Out of the Money (OTM): When exercising the option is not profitable.
At the Money (ATM): When the asset’s price is equal to the strike price.

Part 12 Trading Master ClassOption Pricing Factors
The price (premium) of an option depends on multiple factors, including:
Underlying asset price
Strike price
Time to expiry
Volatility of the underlying asset
Interest rates and dividends
Two main pricing models used are the Black-Scholes Model and the Binomial Model.

Part 11 Trading Master ClassRisks in Option Trading
While options offer opportunities, they also carry risks:
Time Decay: The value of options reduces as expiry approaches.
Complexity: Requires good understanding and experience.
Unlimited Loss Potential (for Sellers): Option writers can face huge losses if the market moves against them.
Volatility Risk: Sudden market changes can make options lose value quickly.

Part 10 Trade Like InstitutionsParticipants in Option Trading
There are mainly four types of participants:
Buyers of Calls: Expect the price to rise.
Sellers of Calls (Writers): Expect the price to stay the same or fall.
Buyers of Puts: Expect the price to fall.
Sellers of Puts (Writers): Expect the price to stay the same or rise.

Part 9 Trading Master ClassHow Option Trading Works
Let’s take an example:
You buy a call option for a stock at a strike price of ₹100 for a premium of ₹5.
If the stock price rises to ₹120 before expiry, you can exercise your right to buy at ₹100 and sell at ₹120, earning ₹20 profit per share (minus ₹5 premium = ₹15 net profit).
If the price remains below ₹100, you simply let the option expire and lose only the premium paid (₹5).
This flexibility — limited loss and unlimited profit potential for buyers — is what makes option trading so attractive.
