Options TradingIntroduction to Options Trading
Options trading is one of the most powerful yet misunderstood segments of the financial markets. Unlike stocks, which represent ownership in a company, options are financial contracts that give the holder the right, but not the obligation, to buy or sell an underlying asset at a predetermined price within a specific timeframe. Options are part of the derivatives family, meaning their value derives from the price movements of another asset, such as stocks, indices, commodities, or currencies.
Options trading allows investors to hedge risks, generate income, and speculate on market movements with comparatively smaller capital. They are versatile instruments, suitable for conservative hedging strategies as well as aggressive speculative plays. In India, options are actively traded on exchanges like NSE (National Stock Exchange) and are available on equities, indices (like Nifty 50), and commodities.
At its core, options trading is about flexibility and strategy. Unlike buying a stock outright, options let traders create positions that profit in bullish, bearish, or neutral market conditions. This flexibility is why professional traders and institutions frequently use options to manage risk, leverage capital, and optimize returns.
What Are Options?
An option is a contract between two parties: the buyer and the seller (writer). The buyer pays a price called a premium for the right to buy or sell the underlying asset at a specific price, known as the strike price, before the option expires. The seller, in turn, is obligated to fulfill the contract if the buyer exercises it.
Options are categorized into two main types:
Call Options – Give the holder the right to buy the underlying asset at the strike price.
Put Options – Give the holder the right to sell the underlying asset at the strike price.
The price of an option (premium) depends on multiple factors, such as:
The current price of the underlying asset.
The strike price relative to the current price.
Time until expiration (time decay).
Volatility of the underlying asset.
Interest rates and dividends (for equities).
Because options are derivative instruments, they allow traders to control a larger position with smaller capital. For instance, buying one Nifty 50 call option might give exposure equivalent to 50 shares of the index, but at a fraction of the capital required to buy the shares directly.
Options come with an expiration date, after which they become worthless if not exercised or closed. This characteristic introduces an important concept called time decay (Theta), which significantly influences option pricing and strategy.
Calls vs Puts: The Basics
Options are essentially bets on market direction, and the two main instruments—calls and puts—represent opposite positions.
1. Call Options
Definition: A call option gives the buyer the right, but not the obligation, to buy the underlying asset at a predetermined strike price before or on the expiration date.
When to Buy: Traders buy call options when they expect the price of the underlying asset to rise.
Profit Potential: The potential profit is theoretically unlimited, as the asset price can rise indefinitely above the strike price.
Risk: The maximum risk for the call option buyer is the premium paid, which is the cost of acquiring the option.
Example: Suppose Reliance Industries is trading at ₹2,500. A trader buys a call option with a strike price of ₹2,600, paying a premium of ₹50. If the stock rises to ₹2,700, the intrinsic value is ₹100, resulting in a profit of ₹50 per share after deducting the premium.
2. Put Options
Definition: A put option gives the buyer the right, but not the obligation, to sell the underlying asset at a predetermined strike price before or on expiration.
When to Buy: Traders buy put options when they expect the price of the underlying asset to fall.
Profit Potential: The potential profit increases as the price of the underlying asset declines. In theory, the maximum gain occurs if the asset price drops to zero.
Risk: Like calls, the maximum risk is limited to the premium paid.
Example: Suppose Infosys is trading at ₹1,500. A trader buys a put option with a strike price of ₹1,450 for a premium of ₹30. If Infosys falls to ₹1,400, the intrinsic value of the put is ₹50, resulting in a profit of ₹20 per share after deducting the premium.
Comparison Table: Calls vs Puts
Feature Call Option Put Option
Right To buy underlying asset To sell underlying asset
Market Expectation Bullish (price rise) Bearish (price fall)
Maximum Loss Premium paid Premium paid
Maximum Gain Unlimited Strike price minus premium (asset cannot
go below zero)
Used for Speculation, hedging long Speculation, hedging short positions
positions
Importance of Understanding Option Mechanics
Understanding the mechanics of options is crucial for traders to make informed decisions and manage risk effectively. Options are not standalone investments—they interact with market dynamics, time decay, volatility, and pricing models. Misunderstanding these mechanics can lead to significant losses, even in seemingly simple trades.
1. Pricing Factors
The pricing of options depends on variables like the underlying asset’s price, strike price, time to expiration, volatility, and interest rates. Using models like Black-Scholes (for European options) or Binomial models (for American options) helps traders understand fair value and identify mispriced options.
2. Risk Management
Options can limit risk for buyers because the maximum loss is the premium paid, while sellers face theoretically unlimited risk (especially naked call sellers). Understanding the payoff structure allows traders to balance reward vs. risk and design hedging strategies.
3. Strategic Flexibility
Options mechanics allow for sophisticated strategies beyond just buying calls and puts. Traders can combine calls, puts, and underlying assets to create strategies like:
Covered Calls – Generating income on existing holdings.
Protective Puts – Hedging against downside risk.
Spreads and Straddles – Leveraging volatility for profit.
Without a solid grasp of how options work, implementing these strategies can become confusing and risky.
4. Timing and Volatility
Time decay (Theta) erodes option value as expiration approaches. Traders must understand how timing affects profitability. Similarly, volatility (Vega) impacts premiums: higher volatility increases option prices, offering potential for greater profit but also higher cost. Ignoring these factors can lead to unexpected losses even if the market moves in the anticipated direction.
5. Hedging and Speculation
Options are invaluable for hedging. For example, an investor holding a long stock position can buy puts as insurance against market decline. Conversely, options can be used for speculation with leverage, allowing traders to control large positions with limited capital. Understanding mechanics ensures these strategies are applied effectively.
Conclusion
Options trading is a dynamic and versatile arena within financial markets. Understanding what options are, the distinction between calls and puts, and the mechanics behind option pricing is essential for anyone looking to trade wisely. Calls allow traders to profit from rising markets, while puts benefit from falling prices. Both offer defined risk for buyers and strategic opportunities when used correctly.
Mastering option mechanics is not just about predicting market direction—it’s about timing, volatility, premium management, and strategic deployment. Traders who understand these nuances can leverage options for hedging, income generation, and speculation, making them one of the most powerful tools in modern finance.
Contains image

Technical Indicators Used in Momentum Trading1. Relative Strength Index (RSI)
The Relative Strength Index (RSI) is one of the most popular momentum indicators used by traders. Developed by J. Welles Wilder, the RSI measures the speed and magnitude of price movements over a specified period, typically 14 days. The indicator oscillates between 0 and 100 and helps identify overbought and oversold conditions in the market.
Overbought Condition: RSI above 70 suggests that the asset might be overbought, indicating potential for a price correction or trend reversal.
Oversold Condition: RSI below 30 suggests the asset may be oversold, providing potential buying opportunities.
RSI is particularly effective in momentum trading because it reflects the strength of price trends and highlights potential entry and exit points. Traders often combine RSI with other indicators to confirm momentum.
2. Moving Average Convergence Divergence (MACD)
The MACD is another essential tool in momentum trading. It measures the relationship between two moving averages, typically the 12-day and 26-day exponential moving averages (EMA), and produces a MACD line. A 9-day EMA of the MACD, known as the signal line, helps identify buy or sell signals.
Bullish Signal: When the MACD line crosses above the signal line, it suggests upward momentum.
Bearish Signal: When the MACD line crosses below the signal line, it indicates downward momentum.
MACD is valuable for momentum traders because it captures trend strength and potential reversals, allowing traders to time entries and exits more effectively.
3. Stochastic Oscillator
The Stochastic Oscillator is a momentum indicator that compares the closing price of an asset to its price range over a specific period, usually 14 periods. It consists of two lines: %K (fast line) and %D (slow line).
Overbought Condition: Readings above 80 suggest that the asset may be overbought.
Oversold Condition: Readings below 20 indicate that the asset may be oversold.
The Stochastic Oscillator is particularly effective in identifying short-term momentum shifts and spotting potential reversals in both trending and range-bound markets. Traders often use stochastic divergences, where price moves contrary to the oscillator, to detect weakening trends.
4. Average Directional Index (ADX)
The Average Directional Index (ADX) measures the strength of a trend rather than its direction. It is derived from the +DI and −DI lines, which indicate upward and downward directional movement. ADX values range from 0 to 100:
Strong Trend: ADX above 25 indicates a strong trend.
Weak or No Trend: ADX below 20 suggests a weak or sideways market.
Momentum traders rely on ADX to identify when a trend is gaining strength, which is essential for confirming momentum-driven trades. Unlike oscillators, ADX does not provide overbought or oversold signals but instead signals trend strength.
5. Bollinger Bands
While Bollinger Bands are primarily used to measure volatility, they also help identify momentum changes. Bollinger Bands consist of a moving average (usually 20-period SMA) and two standard deviation lines above and below it.
Price Breakout: When the price moves outside the bands, it indicates strong momentum.
Squeeze: Narrow bands indicate low volatility and potential for a momentum breakout.
Momentum traders use Bollinger Bands to spot explosive moves and gauge the strength of trends. When prices ride the upper or lower band, it often signifies strong trend momentum.
6. Commodity Channel Index (CCI)
The Commodity Channel Index (CCI) measures the deviation of the asset's price from its moving average. Typically, a 20-period CCI is used, oscillating between +100 and −100.
Overbought: CCI above +100.
Oversold: CCI below −100.
CCI is particularly useful in momentum trading for identifying cyclical trends and potential reversals. It is often combined with trend-following indicators to improve accuracy.
7. On-Balance Volume (OBV)
The On-Balance Volume (OBV) is a volume-based momentum indicator. It accumulates volume based on whether the price closes higher or lower than the previous period.
Rising OBV: Confirms upward price momentum.
Falling OBV: Confirms downward price momentum.
OBV is valuable for traders to confirm price trends with volume support. Momentum traders often rely on OBV divergences to spot potential reversals before they occur.
8. Ichimoku Cloud
The Ichimoku Cloud is a comprehensive indicator that combines trend, momentum, and support/resistance in a single view. Key components include the Tenkan-sen, Kijun-sen, Senkou Span A, and Senkou Span B.
Bullish Momentum: Price above the cloud.
Bearish Momentum: Price below the cloud.
Ichimoku Cloud helps momentum traders identify trend direction and potential entry/exit points while also providing a sense of trend strength.
9. Practical Tips for Using Momentum Indicators
Combine Indicators: No single indicator provides perfect signals. Traders often combine RSI, MACD, and ADX for better confirmation.
Confirm Trend Direction: Use trend-following indicators alongside oscillators to avoid false signals in sideways markets.
Time Frame Selection: Short-term traders may prefer 5–15 minute charts, while swing traders use daily or weekly charts.
Watch for Divergence: Momentum divergence, where price moves contrary to an indicator, often signals weakening momentum.
Risk Management: Momentum trading can be fast-moving; always use stop-loss orders and position sizing.
10. Conclusion
Momentum trading relies heavily on technical indicators to make informed decisions. Indicators such as RSI, MACD, Stochastic Oscillator, ADX, ROC, Bollinger Bands, CCI, OBV, and Ichimoku Cloud provide traders with quantitative insights into trend strength, potential reversals, and overbought or oversold conditions. By understanding the strengths and limitations of each indicator, momentum traders can optimize their strategies, identify high-probability trade setups, and manage risk effectively.
While technical indicators are powerful tools, successful momentum trading also requires discipline, market awareness, and a solid risk management plan. Using indicators in conjunction with proper trading psychology and market knowledge increases the likelihood of consistent profitability in dynamic markets.
Impact of Geopolitical Risks on Indian Financial MarketsIntroduction
Geopolitical risks have emerged as a significant determinant of financial market behavior across the globe. Defined as the potential for political, social, or military events to disrupt the stability of economies and financial markets, these risks can profoundly impact investor sentiment, capital flows, and asset prices. India, as one of the fastest-growing emerging economies, is particularly sensitive to geopolitical developments due to its strategic location, dependency on energy imports, and integration with global trade networks. From regional conflicts in South Asia to global trade tensions, geopolitical events create volatility in Indian financial markets and influence both domestic and international investors’ decision-making processes.
Channels Through Which Geopolitical Risks Affect Markets
The impact of geopolitical risks on Indian financial markets occurs through several interlinked channels:
Investor Sentiment and Market Volatility:
Geopolitical instability can trigger uncertainty among investors, leading to sudden sell-offs in equity markets. Fear of potential disruptions in economic activity prompts investors to adopt risk-averse strategies, often reallocating capital to safe-haven assets such as gold, U.S. Treasury securities, or currencies like the Swiss Franc. In India, major geopolitical shocks have historically led to heightened volatility in the Bombay Stock Exchange (BSE) and the National Stock Exchange (NSE).
Foreign Institutional Investment (FII) Flows:
India relies significantly on foreign institutional investors (FIIs) to provide liquidity and drive equity market growth. Geopolitical tensions can prompt FIIs to withdraw or reduce investments in emerging markets due to perceived risks, adversely affecting stock indices. For instance, conflicts in the Middle East impacting oil prices often lead to capital outflows from Indian markets, weakening the rupee and exerting downward pressure on equity valuations.
Commodity Prices and Inflation:
India is heavily dependent on imports for critical commodities, particularly crude oil. Geopolitical disruptions in oil-producing regions, such as the Middle East, directly impact crude oil prices, influencing inflation and fiscal policy. Rising crude prices increase production and transportation costs, squeezing corporate margins and reducing disposable income for consumers. This ripple effect negatively impacts stock markets, especially sectors like transportation, manufacturing, and consumer goods.
Currency Fluctuations:
The Indian rupee is highly sensitive to global geopolitical developments. Crises in oil-rich regions, U.S.-China trade tensions, or conflicts affecting major global economies can lead to capital flight from emerging markets, depreciating the rupee. Currency depreciation increases import costs, fuels inflation, and heightens uncertainty for foreign investors, creating further pressure on equity and bond markets.
Interest Rates and Monetary Policy:
Geopolitical shocks can indirectly influence monetary policy decisions. Rising inflation due to higher commodity prices or currency depreciation can compel the Reserve Bank of India (RBI) to adopt a tighter monetary stance, raising interest rates to stabilize prices. Higher interest rates may dampen investment and consumption, affecting corporate earnings and stock market performance.
Historical Examples of Geopolitical Risk Impact on Indian Markets
Gulf Wars and Oil Price Shocks:
During the Gulf War in 1990-1991, crude oil prices surged due to conflict in the Middle East, creating inflationary pressures in India. The Indian stock market experienced volatility, and capital outflows intensified due to investor concerns about the country’s balance of payments and economic stability. The rupee depreciated significantly, and sectors dependent on imported oil and petrochemicals were hit hardest.
U.S.-China Trade Tensions:
Although primarily affecting global markets, trade wars between the U.S. and China had spillover effects on India. Investor apprehension about global growth slowdown led to FII outflows from Indian equities. Export-oriented industries in India, such as IT and manufacturing, faced uncertainty regarding demand and pricing, impacting their stock performance.
Russia-Ukraine Conflict (2022):
The Russia-Ukraine war caused a global energy crisis and disrupted commodity markets. India faced rising crude oil and gas prices, leading to inflationary pressures and fiscal stress. Indian equities reacted with short-term volatility, particularly in energy-intensive sectors and industries heavily reliant on imports. Currency depreciation and bond market stress were also observed as global risk sentiment deteriorated.
Border Tensions with China and Pakistan:
Regional conflicts have historically influenced investor sentiment in India. Escalating tensions along the India-China border or cross-border skirmishes with Pakistan often create uncertainty regarding domestic stability, prompting investors to temporarily reduce equity exposure, resulting in short-term market corrections.
Sectoral Impacts of Geopolitical Risks
The impact of geopolitical risks is often sector-specific:
Energy and Oil & Gas: Directly affected due to import dependency and global supply disruptions.
Defense and Infrastructure: Geopolitical tensions often increase defense spending, benefiting defense contractors and infrastructure companies.
IT and Exports: Trade disruptions and sanctions affect export-oriented businesses, including IT and pharmaceutical sectors.
Banking and Financial Services: Volatility affects investor confidence, credit growth, and risk-weighted assets, impacting banking profitability.
Strategies Adopted by Investors and Policymakers
Portfolio Diversification:
Investors often diversify across asset classes and geographies to hedge against geopolitical risks. Gold and other safe-haven assets are popular choices during periods of heightened uncertainty.
Derivative Hedging:
Hedging using futures, options, and currency swaps allows investors and corporates to mitigate exposure to market and currency volatility induced by geopolitical developments.
Policy Interventions:
The Indian government and RBI actively monitor global developments. Strategic petroleum reserves, currency interventions, and monetary policy adjustments are tools used to manage external shocks. For instance, during periods of oil price spikes, the government has reduced excise duties to contain inflationary pressures.
Long-Term Investment Outlook:
While short-term market movements are highly sensitive to geopolitical shocks, long-term investors often focus on India’s underlying growth potential, robust domestic consumption, and reform-driven policies to maintain confidence.
Challenges and Risks
Despite strategies to mitigate geopolitical risks, certain challenges persist:
Unpredictability: Geopolitical events are inherently uncertain and often occur suddenly, making it difficult for investors and policymakers to respond immediately.
Global Interconnectedness: India’s integration with global financial markets amplifies the impact of distant geopolitical events.
Inflationary Pressures: Persistent inflation due to commodity price shocks can undermine economic stability and erode investor confidence.
Currency Depreciation: Continuous volatility in the rupee can create uncertainty for foreign investors and corporates with significant external debt exposure.
Conclusion
Geopolitical risks represent a complex and multifaceted challenge for Indian financial markets. They affect market sentiment, investment flows, commodity prices, currency stability, and monetary policy decisions. Historical evidence demonstrates that both global and regional geopolitical events have significant short-term impacts, often causing volatility and sector-specific repercussions. However, India’s robust economic fundamentals, strategic policy interventions, and long-term growth potential provide a cushion against sustained market disruption. For investors, a careful blend of risk management strategies, diversification, and a long-term outlook remains essential to navigate the uncertainties posed by geopolitical risks. As India continues to integrate further into global markets, understanding and managing these risks will remain a crucial aspect of financial market strategy.
Introduction to Futures HedgingUnderstanding Futures Contracts
A futures contract is a standardized legal agreement to buy or sell an asset at a predetermined price at a specified future date. These contracts are traded on organized exchanges, ensuring liquidity, transparency, and regulatory oversight. The underlying asset in a futures contract could be a physical commodity such as crude oil, wheat, or gold, or a financial instrument like an index, bond, or currency.
Futures contracts have key characteristics:
Standardization: The contract specifies the quantity, quality, and delivery date of the underlying asset.
Margin Requirements: Traders must maintain a margin—a fraction of the contract value—to enter into futures positions.
Mark-to-Market: Gains and losses are settled daily based on the contract’s market value.
Leverage: Futures allow traders to control large positions with relatively small capital, magnifying both potential gains and losses.
These features make futures contracts ideal tools for hedging because they provide predictability and protection against price volatility.
The Concept of Hedging
Hedging is the practice of taking an investment position in one market to offset potential losses in another. In essence, it acts like insurance: while it may limit potential profits, it also minimizes exposure to losses. There are two main types of hedging:
Long Hedge: Used when a business anticipates purchasing an asset in the future and wants to lock in the current price to avoid rising costs.
Example: An airline expects to buy jet fuel in six months. To protect against rising fuel prices, it can buy futures contracts now at the current price. If fuel prices rise, the gain on the futures contract offsets the higher cost of purchasing fuel in the future.
Short Hedge: Used when a business holds an asset and wants to protect against falling prices.
Example: A wheat farmer expects to harvest in three months. To avoid losses if wheat prices fall, the farmer can sell wheat futures contracts now. If the price drops, the profit on the futures contract compensates for the lower market price of the physical wheat.
By employing hedging strategies, both buyers and sellers can stabilize cash flows and plan their operations with more certainty.
Importance of Futures Hedging
Risk Management: The primary objective of futures hedging is to manage price risk. Businesses in agriculture, energy, metals, and finance frequently use futures to minimize the impact of adverse price movements.
Price Discovery: Futures markets facilitate price discovery, reflecting expectations of supply and demand. Hedgers benefit by gaining insight into future price trends.
Financial Stability: Hedging provides stability to earnings and costs. For companies with significant exposure to commodity or currency fluctuations, this stability supports strategic planning, investment, and growth.
Speculation Reduction: By hedging, companies avoid excessive exposure to speculation-driven market movements, focusing instead on their core business operations.
Enhanced Creditworthiness: Companies with effective hedging programs are viewed as financially prudent by lenders and investors, improving access to capital.
Mechanics of Futures Hedging
Hedging with futures involves several steps:
Identify the Exposure: Determine which assets, commodities, or financial instruments are exposed to price risk.
Select the Appropriate Futures Contract: Choose a futures contract that closely matches the underlying asset in terms of quantity, quality, and timing.
Decide the Hedge Ratio: The hedge ratio determines the number of futures contracts needed to offset the risk. Perfect hedges are rare; often, partial hedges are employed to balance risk reduction and cost.
Enter the Futures Position: Buy or sell futures contracts depending on whether a long or short hedge is appropriate.
Monitor and Adjust: As market conditions change, hedgers must monitor their positions and adjust contracts to maintain effective risk coverage.
Close or Offset the Hedge: Futures contracts can be offset before expiration by taking an opposite position or allowed to expire if physical delivery aligns with the hedger’s requirements.
Examples of Futures Hedging
1. Agricultural Hedging:
A corn farmer expects to harvest 10,000 bushels in four months. Concerned about falling prices, the farmer sells corn futures contracts now. When harvest time arrives, even if the market price has dropped, the farmer’s futures gains compensate for the lower sale price, ensuring financial stability.
2. Corporate Hedging:
A multinational company expects to receive €5 million in payments in six months but operates primarily in USD. To protect against EUR/USD exchange rate fluctuations, the company sells euro futures contracts. If the euro depreciates, gains on the futures offset the reduced dollar value of the payment.
3. Commodity Hedging:
An airline hedges against rising fuel costs by buying crude oil futures. If oil prices increase, the gain on the futures contracts compensates for higher fuel costs, helping maintain profitability.
Advantages of Futures Hedging
Predictable Cash Flows: Hedging reduces uncertainty in revenue and costs.
Flexibility: Futures can be tailored to different commodities, currencies, or indices.
Liquidity: Exchange-traded futures offer easy entry and exit.
Leverage: Efficient capital use allows risk management without tying up large amounts of money.
Transparency: Prices are visible and regulated, reducing counterparty risk.
Limitations of Futures Hedging
Basis Risk: The futures price may not move perfectly in line with the underlying asset, resulting in imperfect hedges.
Cost: Margins and transaction fees add to the cost of hedging.
Limited Profit Potential: Hedging locks in prices, reducing the opportunity to benefit from favorable market movements.
Complexity: Understanding contract specifications, hedge ratios, and market dynamics requires expertise.
Over-hedging Risk: Using excessive futures positions can create unintended exposure and losses.
Conclusion
Futures hedging is a vital risk management tool in modern financial and commodity markets. It allows businesses and investors to stabilize cash flows, plan effectively, and mitigate losses arising from adverse price movements. By understanding the mechanics, advantages, and limitations of futures contracts, market participants can use hedging strategies to navigate volatile markets with confidence. While futures hedging does not eliminate risk entirely, it transforms unpredictable market movements into manageable financial outcomes, fostering greater stability and strategic decision-making.
In an increasingly globalized and interconnected economy, the role of futures hedging has expanded beyond traditional commodities to include financial instruments, currencies, and indices. Companies, investors, and financial institutions that employ well-structured hedging strategies are better positioned to withstand market shocks, protect their profitability, and achieve long-term growth.
Introduction to the AI-Driven Trading EraThe Evolution of Trading Technology
To understand the AI-driven era, it is important to look back at how trading technology has evolved. Markets moved from the open-outcry system to electronic trading, and from electronic trading to algorithmic models. Algorithmic trading introduced systematic rule-based execution, but these systems still relied heavily on predefined human logic. AI changes that framework by enabling trading systems to learn, adapt, and optimize themselves using vast amounts of data.
This evolution happened because markets became too fast, too complex, and too data-driven for human traders to handle manually. AI emerged as the natural solution for processing huge datasets, identifying hidden patterns, and executing trades in microseconds.
What Makes AI a Game Changer in Trading?
AI’s advantage lies in its ability to detect nonlinear patterns, its speed, and its capacity to learn autonomously. Unlike conventional formulas that follow static rules, AI models adjust themselves based on new market behavior, making them exceptionally powerful during volatility, regime shifts, or unexpected market events.
Some key strengths of AI-driven trading systems include:
1. Big Data Processing
Financial markets produce enormous amounts of data: price ticks, news, economic indicators, global sentiments, social media activity, institutional flows, and alternative datasets like satellite images or credit card spending. AI models can process all of these simultaneously, generating insights far beyond the reach of human analysis.
2. Predictive Modeling
Machine learning models learn from historical price data and trading patterns to predict potential future outcomes. While no model is perfect, AI significantly improves the probabilities and timing of accurate predictions.
3. Automation and Emotion-Free Decision Making
Human traders often suffer from fear, greed, overconfidence, and biases. AI systems remove emotional interference entirely, sticking to mathematical probabilities and risk-adjusted models.
4. Multi-Factor Integration
AI can combine dozens—or even hundreds—of variables to evaluate a trading opportunity, something impossible for a human trader. These include:
Technical indicators
Market microstructure signals
Volume patterns
Macroeconomic trends
Order book depth
Options flow
Global market correlations
5. Speed and Precision
AI-powered high-speed execution ensures minimal slippage, instant order routing, and accurate position sizing. This is crucial in markets where milliseconds can mean the difference between profit and loss.
The Rise of Machine Learning Models in Trading
Three major categories of ML models dominate AI trading today:
1. Supervised Learning
Models learn from labeled historical data to predict future price movements. Examples include:
Linear regression
Random forests
Gradient boosting models
Neural networks
These models are excellent at forecasting price direction, volatility, and risk.
2. Unsupervised Learning
Used for clustering, anomaly detection, and market regime identification. These models identify hidden structures in the market such as:
Patterns preceding trend reversals
Unusual behavior indicating manipulation
Shifts in market sentiment
3. Reinforcement Learning (RL)
One of the most exciting developments in AI trading, RL models learn by trial and error. They self-optimize by interacting with market environments, much like how AlphaGo learned to play Go. RL trading systems continuously adjust strategies based on reward maximization, making them extremely adaptive.
AI in High-Frequency Trading (HFT)
High-frequency trading firms were among the earliest adopters of AI. Their algorithms operate at lightning speed, executing thousands of trades per second. AI enhances HFT through:
Ultra-fast pattern recognition
Statistical arbitrage
Market-making
Latency arbitrage
Liquidity prediction
HFT remains one of the most profitable yet highly competitive areas of AI-powered markets.
AI for Retail Traders
The democratization of AI has brought powerful tools to retail traders in India and around the world. Cloud computing, open-source ML libraries, and broker APIs allow individuals to build and deploy their own AI models. Many retail traders now use:
AI-based scanners
Sentiment analysis bots
Automated trading systems
Options flow predictors
Reinforcement learning strategies
Platforms like Zerodha, Upstox, and Interactive Brokers support API-driven execution, enabling retail participants to operate like mini-quant firms.
AI and Market Microstructure
Advanced AI tools analyze market microstructure to exploit tiny inefficiencies. They evaluate:
Bid-ask spreads
Order book imbalances
Liquidity pockets
Iceberg orders
Hidden institutional flows
For traders, this means precise entries, better exit timing, and improved risk management.
Sentiment Analysis: The New Frontier
In the AI era, price is no longer the only source of truth. Sentiment is equally powerful. AI models scan:
News
Financial reports
Twitter
Reddit
Analyst commentary
CEO statements
Global events
Natural Language Processing (NLP) converts all this into actionable trading signals. For example, a sudden surge in negative sentiment often predicts a short-term drop in price.
Risks and Limitations of AI-Driven Trading
Despite its advantages, AI also brings challenges:
1. Overfitting
Models may perform well on historical data but poorly in live markets.
2. Black-Box Behavior
Deep learning models can be difficult to interpret.
3. Market Regime Shifts
AI can struggle when markets behave in ways not seen in training data.
4. Data Quality Issues
Incorrect, insufficient, or biased data leads to inaccurate predictions.
5. Overdependence
Traders relying entirely on AI may overlook fundamental risks or black swan events.
Successful AI trading requires human judgment, risk management, and continuous monitoring.
The Future of AI-Driven Trading
The AI trading era has only just begun. The future will likely include:
Fully autonomous trading systems
AI-powered portfolio optimization
Predictive risk models
Quantum computing–based trading algorithms
Personalized AI trading advisors
Real-time global sentiment heat maps
Markets will continue becoming faster, smarter, and more efficient. Traders who adopt AI early will have a powerful edge, while those who ignore it risk falling behind.
Trading Styles in the Indian Market1. Intraday Trading
Intraday trading, commonly known as day trading, is one of the most popular styles in India due to high volatility and leverage availability. It involves entering and exiting trades within the same trading day. The primary objective is to capture small price movements across large volumes.
Key Features
Short time frames: 1–5 minutes, 15 minutes, or hourly charts.
High leverage: Brokers offer margin for intraday trades.
Targets are small: 0.3% to 1.5% moves.
Risk management is crucial due to high volatility.
Popular Strategies
Momentum trading during market opening.
Breakout and breakdown strategies.
VWAP-based institutional flow tracking.
Reversal trades at key supply-demand zones.
Best Suited For
Traders with quick decision-making skills, emotional discipline, and the ability to monitor charts during market hours.
2. Swing Trading
Swing trading is ideally suited for the Indian market because stocks often move in short-term trends driven by news, earnings expectations, institutional flows, and sector rotation. Swing traders typically hold positions for 2–20 days.
Key Features
Higher timeframe analysis: Daily and weekly charts.
Lower stress compared to intraday.
Ideal for people with jobs who cannot monitor the market all day.
Uses technical patterns like flags, triangles, pullbacks, and breakouts.
Popular Swing Indicators
Moving averages (20, 50, 200)
RSI divergences
Fibonacci retracement zones
MACD crossovers
Best Suited For
Traders who prefer moderate risk, medium-term profits, and structured analysis without minute-to-minute monitoring.
3. Positional Trading
Positional trading involves holding trades for weeks to months based on broader market trends. This style is popular among experienced traders and investors who understand macro trends, sectoral cycles, and company fundamentals.
Key Features
Focus on major trends, not minor fluctuations.
Requires patience and conviction.
Uses weekly and monthly charts.
Less stressful than intraday/swing.
Approach
Use fundamentals for selection and technicals for timing.
Sectors like banking, FMCG, pharma, and IT respond well to positional plays.
Key tool: trendlines, moving averages, sector rotation analysis.
Best Suited For
Working professionals, medium-capital traders, and long-term thinkers.
4. Scalping
Scalping is one of the fastest and most advanced trading styles. The goal is to book very small profits (0.05%–0.3%) multiple times throughout the day. Scalping is extensively used in index derivatives—especially NIFTY, BANK NIFTY, and FINNIFTY—because liquidity and depth are extremely high.
Key Features
Extremely quick trades lasting seconds to minutes.
High frequency, low risk per trade.
Requires stable internet and low-latency execution.
Works best during high liquidity periods—opening hour and closing hour.
Tools
Option order flow
VWAP
Depth of market (DOM) data
Tick charts and footprint charts (for advanced scalpers)
Best Suited For
High-skill professional traders with strong reflexes, emotional control, and advanced tools.
5. Algorithmic and System-Based Trading
Algo trading has grown rapidly in India with the availability of APIs, platforms like Zerodha Streak, Tradetron, and custom Python systems. Algorithmic trading uses rules, automation, and backtesting instead of emotional decision-making.
Key Features
Mechanical, rule-based execution.
Removes emotions from trading.
Can handle high-frequency signals.
Backtesting helps refine strategies.
Popular Algo Styles
Trend-following systems.
Mean-reversion systems.
Statistical arbitrage.
Option selling with hedges.
Market-neutral strategies.
Advantages
Consistency and discipline.
Ability to trade multiple symbols simultaneously.
Works even for part-time traders.
Best Suited For
Tech-savvy traders, engineers, data scientists, or those who prefer automation over discretion.
6. BTST / STBT Trading (Buy Today, Sell Tomorrow / Sell Today, Buy Tomorrow)
BTST and STBT trading styles focus on overnight price movements influenced by global cues, economic announcements, or corporate news.
Key Features
BTST: Carry equity positions overnight to capture gap-up openings.
STBT: Mostly used in F&O due to short selling restrictions.
Trades depend on global markets—Dow, SGX NIFTY, crude oil, and currency moves.
Best Suited For
Swing traders who want to avoid intraday volatility but profit from overnight reactions.
7. Options Buying (Directional)
Options trading has exploded in India due to low capital entry and high reward potential. Directional option buyers predict sharp short-term moves.
Focus Areas
ATM/OTM calls and puts.
Breakout-based entries.
Trend days with strong momentum.
Expiry day (Thursday) trades.
Challenges
High theta decay.
Requires accuracy in direction and timing.
Best Suited For
Experienced traders who understand volatility, Greeks, and market structure.
8. Options Selling (Non-Directional or Semi-Directional)
Option selling is preferred by professional traders because it offers consistent income through premium decay.
Popular Strategies
Straddles & strangles.
Iron condor.
Bull/bear spreads.
Calendar spreads.
Advantages
High probability trades.
Beneficial during low-volume consolidations.
Risks
Requires strict hedging.
Black swan events can cause large losses.
Best Suited For
Capital-rich traders with risk-management experience.
9. Trend Following
Trend following is timeless and works well in trending markets like India. Instead of predicting tops and bottoms, trend followers ride the big wave.
Key Features
Use moving averages (20/50/200).
Enter after confirmation, not prediction.
Works extremely well in bull markets.
Requires fewer but high-quality trades.
Psychology
Trend following is simple but emotionally challenging because you must hold winners and cut losers quickly.
10. News-Based and Event Trading
Event traders focus on volatility around:
RBI policy
Budget announcements
Earnings results
Global macro events
Corporate announcements
Approach
Predict volatility, not direction.
Often uses straddles/strangles.
Fast execution is required.
Conclusion
The Indian market provides opportunities for every type of trader—from beginners to advanced professionals. Each trading style has its strengths, weaknesses, and ideal market conditions. To succeed, traders must choose a style that matches their personality, risk tolerance, time availability, and capital. Mastery comes from specialization, risk management, and continuous learning.
Part 1 Ride The Big Moves What Are Options?
Options are derivatives, which means their value is derived from an underlying asset such as stocks, indices, commodities, or currencies. In equity and index markets, options help traders speculate on price movements or protect their existing positions.
An option is essentially a contract that grants the buyer the right (but not the obligation) to buy or sell the underlying asset at a predetermined price (called the strike price) before a specific date (called the expiry).
There are two types:
Call Option – Gives the right to buy
Put Option – Gives the right to sell

Candle Patterns ExplainedCandlestick patterns are one of the most powerful tools in technical analysis. They visually capture the battle between buyers and sellers and show you who is in control of the market at any moment. Each candle represents the market psychology of that particular timeframe—fear, greed, rejection, aggression, and hesitation. When you learn to read candles correctly, you understand the story behind price, not just the price itself.
A single candlestick is made up of four important points: Open, High, Low, and Close (OHLC). The body of the candle represents the distance between open and close. The wicks (also called shadows) show the highest and lowest points reached during the candle. Bullish candles close higher than they open, while bearish candles close lower than they open.
Candle patterns are broadly divided into three categories: Single-candle patterns, Double-candle patterns, and Triple-candle patterns. Each type gives different signals about trend continuation, reversal, or market indecision.

Premium Chart PatternsPremium chart patterns are advanced market structures that go beyond basic triangles, flags, and double tops. These patterns are used by experienced traders, institutional desks, and serious technical analysts to catch moves before the majority notices. What makes them “premium” is their reliability, deeper logic, and ability to identify institutional activity, liquidity traps, and major swing reversals.
While basic chart patterns rely on simple visual structures, premium patterns focus on price psychology, volume behavior, liquidity engineering, and market structure transitions. These tools help traders understand why price is moving in a certain direction—not just how it looks.

#UNIVPHOTO: Reversal Alert at Falling Channel Midline!CMP: 286
UnivPhoto found support ✅ & bounced strongly off the mid-line of the falling channel (245–266 zone), forming a textbook Morning Star on the weekly chart — a classic bullish reversal! ⭐️🔥
Now testing key resistance 310–337 + downtrend line. A breakout could fuel a rally to 484 → 747/818 → 988 (ATH) 🚀🚀
Could this be the end of the multi-year downtrend? Watch closely! 👀✨
#UNIVPHOTO #MorningStar #CandleStickPattern #PriceAction #LongTerm #Investing
📌 #Disclaimer: This analysis is shared for educational purposes only. It is not a buy/sell recommendation. Please do your own research before making any trading decisions.

Essential Guide to Support and Resistance 1️⃣ The Importance of Support and Resistance in the Highly Volatile Crypto Market
- The cryptocurrency market operates 24/7/365 and shows significantly higher volatility than traditional financial markets. This volatility creates exceptional profit opportunities but also triggers intense fear and greed, placing substantial psychological pressure on traders.
- Support and resistance act as critical reference points within this chaos, highlighting areas where price is likely to react. Beyond technical analysis, they reflect the collective psychology of traders. Understanding them is essential for long-term success in crypto trading.
2️⃣ The Nature of Support and Resistance and Their Psychological Foundation
Support and resistance form where buying and selling pressures clash strongly enough to slow down or halt price movement.
Support:
At this level, buyers perceive the asset as “cheap enough” and are willing to enter, forming a psychological and structural barrier against further decline. Traders previously stuck in losing positions may sell at breakeven, adding layered reactions around these levels.
Resistance:
At this level, sellers believe the asset is “expensive enough” and reduce exposure, while trapped traders near the top may sell with a “better late than never” mentality, limiting further upward movement.
※ The Meaning of Breakouts and Fakeouts
- When support breaks, active buyers may panic and trigger stop-loss selling. Conversely, breaking resistance often invites aggressive buyers, accelerating the trend.
- However, many breakouts turn into fakeouts, designed to exploit trader psychology. Avoid jumping in too early without confirmation.
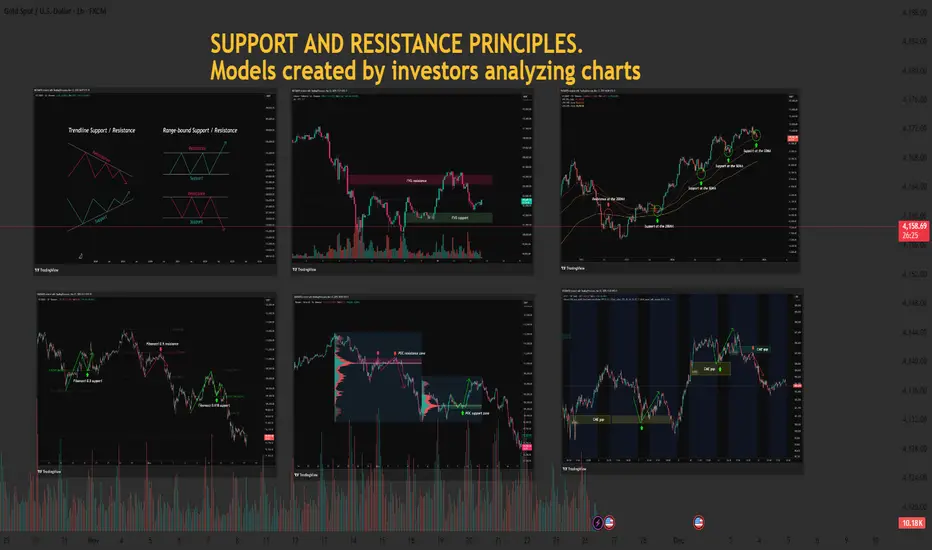
3️⃣ Key Support and Resistance Models Explained
📈 Trendlines & Accumulation Zones: Market Structure and Trader Expectations
- Trendlines visually represent collective expectations of future price direction.
- Touching an uptrend line triggers “buy the dip” psychology.
- Touching a downtrend line reinforces the belief that price “cannot move higher.”
- Accumulation Boxes mark areas where buying and selling pressures stabilize. Traders plan around these zones, driven by the mindset of “waiting for the breakout” to catch meaningful moves.
drive.google.com
📈 FVG (Fair Value Gap): Market Inefficiency & Smart Money Footprints
An FVG forms when price moves too quickly through a zone, leaving an unfilled “price gap.” These gaps often represent sudden activity from Smart Money (institutions, whales).
Gap Filling:
Markets naturally avoid leaving inefficiencies unresolved. When price returns to an FVG, the entities responsible for the original move may adjust or reopen positions, creating support or resistance.
Newer traders can observe FVGs as footprints of Smart Money and plan reactions accordingly.
drive.google.com
📈 Moving Averages (MA): Collective Sentiment & Trend Direction
MAs reflect the average price the market perceives over time. Because MAs are widely monitored, they naturally form psychological support and resistance.
Short-term MA (e.g., 50MA): Tracks short-term sentiment.
Price below → worry about trend weakening.
Price above → renewed optimism.
Long-term MA (e.g., 200MA): Represents long-term sentiment.
Price below 200MA → fear of prolonged downtrend.
Price above 200MA → hope for sustained bullishness.
When acting as support/resistance, MAs reflect strong collective agreement.
drive.google.com
📈 POC (Point of Control) – Volume Profile: Market Consensus & Volume Strength
POC is the price level with the highest trading volume within a given range — the market’s strongest consensus level.
Price below POC:
POC becomes strong resistance.
Buyers stuck in losing positions may sell at breakeven, strengthening resistance.
Price above POC:
POC turns into solid support.
Buyers believe price should not fall below this level.
POC often reflects the market’s “expected value” and the area where loss-aversion psychology is strongest.
drive.google.com
📈 Fibonacci: Natural Order & Human Expectations
- Fibonacci retracement applies golden ratio mathematics to charts, reflecting where traders expect reversals and forming support/resistance.
- These levels work not by magic but because many traders plan trades around them — collective behavior creates real reactions.
- Levels like 0.5 and 0.618 carry psychological significance, often seen as optimal buying or selling opportunities.
drive.google.com
📈 CME Gap: Institutional Movement & Mean Reversion Behavior
CME gaps occur in Bitcoin futures due to institutional trading hours. When spot price moves over the weekend while futures are closed, gaps form.
Gap Filling:
These gaps represent time periods without institutional activity, encouraging the market to “normalize” abnormal price areas.
Traders commonly expect gaps to be filled eventually, turning them into potential support/resistance zones.
drive.google.com
4️⃣ Managing Trading Psychology Through Support and Resistance
Even the best tools are useless without psychological discipline.
Confirmation Bias & Stop-Loss Discipline
- Ignoring losses due to selective perception leads to failure.
- When support breaks, accept the invalidation and exit decisively.
Overbought/Oversold Psychology & FOMO
- Avoid chasing price upward out of fear of missing out.
- In crashes, resist panic-selling at the bottom.
- Rely on your structured support/resistance rules.
Scaling Into Trades
- Avoid buying everything at one support level—or selling everything at one resistance level.
- Scaling entries across multiple levels increases psychological stability and reduces the impact of misjudgment.
5️⃣ Building a Complete Strategy & Practical Application Tips
Confluence Creates Strongest Levels
When multiple support/resistance signals overlap
(e.g., Fibonacci 0.618 + 200MA + POC + FVG),
these zones become significantly stronger because they reflect collective trader agreement.
Volume Confirms Support/Resistance Strength
High volume validates a level's importance.
A reliable breakout requires strong volume, showing clear market participation and intent.
Develop Your Own Trading Plan
Do not follow every model blindly.
Choose indicators and methods that fit your style, and create clear trading rules.
Discipline with your own system leads to psychological stability and long-term success.
Don’t forget to like and share your thoughts in the comments! ❤️
Introduction to DivergenceShould You Trade Options?
Options are powerful tools, but they require:
Understanding of market structure
Technical or quantitative edge
Patience and discipline
Clear strategy
Risk management
If you want leverage and flexibility, options are excellent.
If you want consistency and low risk, focus on credit spreads or hedged selling.

Bitcoin Ready to hit New Low?BITCOIN QUICK UPDATE: LEVELS PLAYING OUT EXACTLY AS EXPECTED
As we mentioned earlier, the $88,600 FVG has now been fully filled, and CRYPTOCAP:BTC is currently trading below that zone.
Here’s what matters next:
🔹 If $85,000 holds as support → BTC likely pushes toward the next major Bearish Order Block at ~$93,000.
High probability this zone gets tapped.
🔹 If BTC fails to reclaim and break above $88,000 → expect a deeper leg down toward ~$75,000.
Stay sharp. NFA.

Gold Maintains Bullish Momentum,Watching for Breakout Above 4150📊 Market Overview:
Gold is currently trading around 4140. Market sentiment remains tilted toward buying due to expectations of an upcoming Fed rate cut, while the USD shows mild weakening during the session.
📉 Technical Analysis:
• Key resistance: 4150 – 4162
• Nearest support: 4125 – 4130
• EMA: Price is above the EMA-09, indicating the bullish trend is still intact.
• Candlestick / Momentum:
– The 4150 zone is forming a strong resistance; H1 candles show upper wicks → short-term profit-taking pressure.
– If H1 closes above 4150 → gold may extend to 4175 – 4190.
– If it fails, price may retest 4130.
📌 Outlook:
Gold may continue rising if it breaks above 4150 with a confirmed candle.
Otherwise, if it cannot break 4150 in the next 2–3 H1 candles, the market could retrace to 4130 before rising again.
________________________________________
💡 Suggested Trading Strategy:
🔺 BUY XAU/USD
Entry: 4128 – 4132
🎯 TP: 40 / 80 / 200 pips
❌ SL: 4125

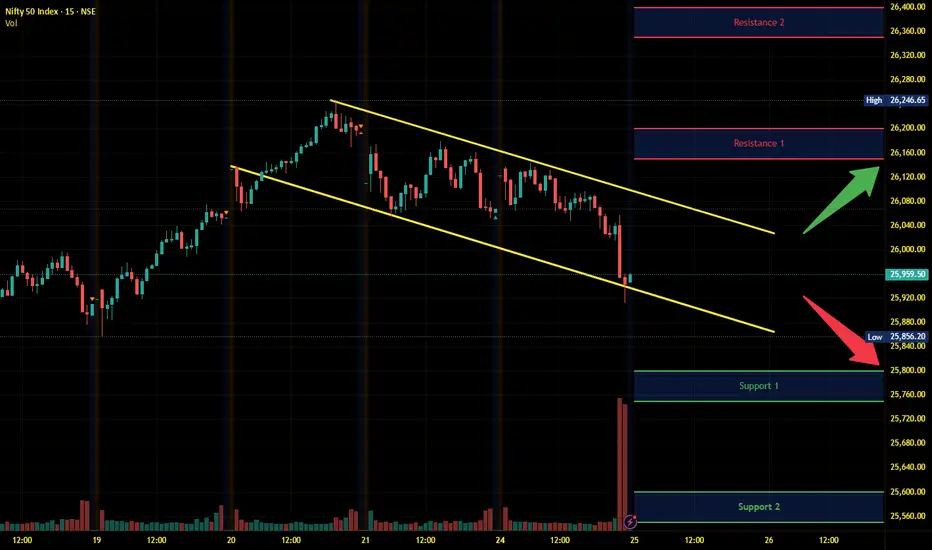
Nifty Intraday Analysis for 25th November 2025NSE:NIFTY
Index has resistance near 26150 – 26200 range and if index crosses and sustains above this level then may reach near 26350 – 26400 range.
Nifty has immediate support near 25800 – 25750 range and if this support is broken then index may tank near 25600 – 25550 range.
Volatility expected on the November 2025 Month F&O expiry day.
Introduction to Put-Call Ratio (PCR)Psychology in Option Trading
Option trading is not just technical—it's emotional.
Traders face:
Fear of missing out (FOMO)
Overtrading during high volatility
Holding losers too long
Expecting miracles from OTM options
Disciplined psychological control is essential.

Part 2 Intraday Trading Master ClassMargin and Risk Management
Option buying requires no margin except the premium.
Option selling requires high margin because:
Risk is unlimited.
Exchanges demand safety.
Risk Management Rules
Never sell naked options without stop-loss.
Avoid selling during high volatility events.
Use spreads to reduce risk.
Position size properly—do not over-leverage.

Part 1 Intraday Trading Master ClassIndex Options vs Stock Options
Index Options
Extremely liquid
Weekly expiry
Less manipulation
Ideal for intraday traders
Stock Options
Monthly expiry only
Higher margin for selling
Less liquid compared to index
Better for positional strategies

Option Trading Premium: The Price of an Option
Premium is the amount the option buyer pays to the seller. It is influenced by:
Intrinsic Value
Time to Expiry
Volatility (IV)
Interest Rates
Demand–Supply
Premium tells you how expensive or cheap an option is at a given moment.

Part 2 Support and Resistance Premium: The Price of an Option
Premium is the amount the option buyer pays to the seller. It is influenced by:
Intrinsic Value
Time to Expiry
Volatility (IV)
Interest Rates
Demand–Supply
Premium tells you how expensive or cheap an option is at a given moment.

Option Greeks and Advanced Hedging Strategies1. Understanding the Core Option Greeks
1. Delta – Sensitivity to Price Movement
Delta measures how much an option’s price changes for a ₹1 change in the underlying asset.
Call options: Delta ranges from 0 to +1.
Put options: Delta ranges from 0 to –1.
High-delta options behave almost like the underlying, while low-delta options react slowly.
Use: Directional trades, risk measurement, delta-neutral hedging.
2. Gamma – Rate of Change of Delta
Gamma shows how fast delta changes. It is highest for at-the-money options and near expiry.
High gamma means your delta can shift quickly, increasing risk if the market moves suddenly.
Use: Managing intraday fluctuations, protecting against rapid price moves.
3. Theta – Time Decay
Theta measures how much an option’s price erodes daily due to time decay.
Short option sellers benefit from positive theta.
Long option buyers suffer negative theta.
Theta accelerates as expiry approaches, especially for ATM options.
Use: Deciding when to buy or sell options based on time decay.
4. Vega – Sensitivity to Volatility
Vega estimates how much the option price changes when implied volatility changes by 1%.
High vega = large impact of volatility.
ATM and longer-dated options have higher vega.
Use: Volatility trading, earnings strategies, long straddles/strangles, volatility crush hedging.
5. Rho – Sensitivity to Interest Rates
Rho measures how an option’s value changes when interest rates move.
Rho is more relevant in long-dated options (LEAPS).
Higher rates tend to increase call prices and reduce put prices.
Use: Institutional hedging, bond-linked derivatives, macro-based hedging.
2. Why Greeks Matter in Trading
Each Greek reveals a different dimension of risk. A professional trader doesn’t just react to price; they monitor how Greeks shift across time, volatility, and market conditions.
Delta controls directional exposure.
Gamma controls how quickly direction changes.
Theta affects profitability over time.
Vega controls volatility risk.
Rho impacts rate-sensitive options.
A complete risk management system balances all Greeks using hedging strategies.
3. Advanced Hedging Strategies Using Greeks
A. Delta Hedging – Neutralising Directional Risk
Delta hedging means adjusting your underlying shares to keep delta = 0.
Example:
If you hold a long call with delta 0.60, buying 100 calls gives you 60 delta. To hedge, sell 60 shares.
This protects you from directional movement but NOT volatility or time decay.
When to Use Delta Hedging
For market-making
For large option sellers
During high volatility events
For maintaining non-directional strategies like straddles/strangles
B. Gamma Hedging – Controlling Delta Drift
Gamma hedging stabilises delta by using additional options, often opposite positions.
If gamma is high, delta changes rapidly, creating risk during volatile markets.
How It Works
Use options with opposite gamma to neutralise fluctuations.
Typically buy long-dated options with high gamma to stabilise short-dated high-gamma positions.
Gamma hedging is crucial for short option sellers who face rapid delta shifts.
C. Vega Hedging – Reducing Volatility Exposure
Traders hedge volatility by combining options that offset each other’s vega.
Methods
Buy/Sell options in different expiries
Use calendar spreads
Use ratio spreads
Example:
Long a straddle in near-month?
Hedge vega risk by shorting far-month options.
Vega hedging protects you from implied volatility crush (particularly important around earnings).
D. Theta Hedging – Managing Time Decay Exposure
Theta risk affects long option buyers and short sellers differently.
If you are long options, hedge with short theta (credit spreads).
If you are short options, hedge with long options (debit spreads).
Common Theta-hedging tools:
Iron condors
Credit spreads
Calendar spreads
Butterfly spreads
These strategies help balance time decay while limiting risk.
E. Rho Hedging – Interest Rate Risk
For long-dated options, changes in interest rates matter.
Institutions hedge by:
Taking opposite positions in interest-rate futures
Adjusting long-dated calls and puts
Rho hedging is mainly used in currency options, index options, and LEAPS.
4. Advanced Multi-Greek Hedging Strategies
Professional hedging often needs balancing multiple Greeks simultaneously.
1. Delta-Gamma Hedging
Objective: Neutralise both delta and gamma.
Used when markets are expected to stay within a range but may see temporary swings.
How to Construct:
Begin with the main option position.
Add options with opposite gamma until gamma ≈ 0.
Adjust underlying shares to bring delta to zero.
This creates a smoother risk profile.
2. Delta-Vega Hedging
Useful when trading volatility strategies like straddles or calendar spreads.
Approach:
Start with volatility-based position (e.g., long straddle).
Hedge delta with underlying.
Hedge vega by using options in different expiries.
This isolates pure volatility trading.
3. Delta-Theta Hedging
Designed for option sellers to offset excessive time decay sensitivity.
Tools:
Credit spreads
Butterfly adjustments
Ratio spreads
This prevents sudden losses from time decay acceleration.
4. Vega-Gamma Hedging
This is highly advanced and used by professional volatility traders.
Gamma and vega often move together.
High gamma = high vega.
So traders hedge using combinations of:
Calendar spreads
Diagonal spreads
Backspreads
Purpose: Generate controlled exposure to volatility without directional risk.
5. Key Advanced Hedging Strategies in Practice
A. Calendar Spreads (Time Arbitrage)
Buy long-dated options (high vega & low theta) and sell short-dated options (low vega & high theta).
Benefits:
Profits from volatility differences
Controls theta
Low directional risk
Great for hedging earnings uncertainty.
B. Iron Condors (Range-Bound Hedging)
Combines call and put credit spreads.
Purpose:
Profit from time decay
Hedge delta by balancing calls and puts
Low vega exposure
Institutions love condors because they naturally hedge multiple Greeks.
C. Ratio Spreads (Directional Volatility Hedging)
Example: Buy 1 ATM call, sell 2 OTM calls.
Benefits:
Balances delta
Captures volatility
Controls gamma risk
This is used when anticipating gradual price rise, not a breakout.
D. Straddles and Strangles (Gamma & Vega Plays)
Used when expecting high volatility.
To hedge:
Use delta hedging intraday
Use calendar spreads for vega hedging
Use stop adjustments to manage gamma risk
E. Butterfly Spreads (Controlled Gamma Exposure)
Butterflies offer controlled risk with defined payoff.
Benefits:
Low delta
Low vega
Balanced theta
Perfect for traders expecting low volatility and stable prices.
6. Professional Tips for Greek Management
Never hedge only delta—monitor gamma and vega too.
Use options in multiple expiries to stabilise vega and theta.
Avoid high gamma exposure near expiry unless you can adjust quickly.
Hedge dynamically—Greeks change every second.
In volatile markets, hedge more frequently.
Always check net Greeks of your entire portfolio, not individual trades.
Use spreads instead of naked options for balanced Greek profiles.
Conclusion
Option Greeks form the foundation of professional derivatives trading. Delta, gamma, theta, vega, and rho each describe different risk dimensions. Advanced hedging strategies combine these Greeks to build stable, market-neutral, volatility-neutral, or time-neutral portfolios. Whether trading directional moves, volatility events, or range-bound markets, mastery of Greek-based hedging is essential for long-term consistency and capital protection.
Microstructure Trading Edge1. What Is Microstructure Trading?
Microstructure trading focuses on:
Order flow (who is buying/selling and with what urgency)
Liquidity (where big orders sit in the book)
Bid–ask dynamics
Market maker behavior
Execution algorithms
Slippage and transaction cost analysis
Short-term price impact
Instead of predicting future prices using patterns, a microstructure trader reads the real intentions of market participants through order book changes, volume imbalances, and execution footprints.
This gives the trader the ability to:
Enter before breakouts actually occur
Predict fakeouts and liquidity grabs
Spot absorption by big players
Identify high-probability reversal points
Understand when momentum is real or manufactured
In short, microstructure trading is about recognizing the behavior of money, not the movement of lines.
2. The Foundation of Microstructure Edge
A microstructure trading edge emerges when you consistently identify and exploit inefficiencies in:
Order execution
Limit order placement
Market maker risk control
Liquidity distribution
Price impact of aggressive orders
These inefficiencies exist because:
Limit orders are placed by humans and algorithms with predictable patterns
Market makers adjust spreads based on risk
Large players cannot hide their intentions completely
Liquidity is uneven and clustered around obvious levels
Retail traders chase breakout candles, creating temporary mispricings
Understanding these behaviors offers a structural edge rather than a psychological one.
3. Key Elements of Microstructure Trading
(A) Order Flow Analysis
Order flow tells you the story behind every candle.
Key concepts:
Aggressive Buying → Market buy orders lifting liquidity at ask
Aggressive Selling → Market sell orders hitting bids
Delta and Cumulative Delta → Shows the net buying/selling pressure
Example edge:
If price is rising but cumulative delta is falling, it indicates passive absorption, meaning big players are selling into the rally. A sharp drop is likely ahead.
(B) Liquidity Pools
Liquidity pools are areas where large stop-losses or limit orders accumulate:
Swing highs/lows
Round numbers
Previous day high/low
Big figure levels
VWAP
Smart money often pushes price toward these pools to trigger liquidity and fill their large orders.
Edge:
When price aggressively taps a liquidity pool but shows no follow-through, it often marks a reversal or fade opportunity.
(C) Market Maker Behavior
Market makers provide liquidity but also:
Adjust spreads based on volatility
Absorb or reject aggressive orders
Hedge inventory risks
Manipulate micro-movements to attract order flow
A microstructure trader watches for:
Spread widening (hinting at imbalance)
Sudden liquidity removal
Fake liquidity (spoofing)
Iceberg orders
Hidden limit orders
When you know why a market maker widens spreads or pulls liquidity, you get clues about impending volatility or direction.
(D) Price Impact Models
Large institutional orders create predictable patterns:
They move price in the direction of the trade
The price impact is nonlinear—bigger orders have exponentially higher impact
They break orders into small chunks using algorithms (VWAP, TWAP, POV)
A microstructure trader identifies these patterns through:
Consistent small prints at fixed intervals
Volume clustering
Slow grind with no retracements
This often signals algorithmic accumulation or distribution, forming early entries.
(E) Queue Position & Execution Advantage
In limit order markets, queue priority matters.
Being early in the queue gives:
Better fill probability
Lower slippage
Reduced adverse selection
HFT firms exploit this with:
Speed advantage
Order anticipation
Rebate capturing
Retail traders can still gain edge through:
Using limit orders at well-selected liquidity zones
Avoiding poor execution times (open & close volatility)
Minimizing mechanical slippage
This transforms trading from random entries to strategic liquidity positioning.
4. Types of Microstructure Trading Edges
1. Liquidity Edge
Understanding where liquidity sits allows you to anticipate:
Stop hunts
False breakouts
Sharp reversals
You know why price moves, not just where.
2. Order Flow Timing Edge
Knowing when aggressive orders enter the market helps you:
Ride momentum early
Avoid fading strong pressure
Identify trap moves
This is especially powerful during:
First 15–30 minutes
News volatility
Breakout retests
3. Market Maker Pattern Edge
Market makers behave consistently under:
Low liquidity
Sudden volatility
One-sided order flow
Recognizing their footprints gives you:
High-probability scalps
Reversal signals
Safe entry timing
4. Execution Efficiency Edge
Improving order placement reduces:
Slippage
Costs
Unnecessary losses
Over thousands of trades, this becomes a significant edge.
5. Structural Pattern Edge
Microstructure traders often specialize in:
Liquidity grabs
Absorption blocks
Exhaustion prints
Imbalance continuation
Fair value gaps
Order blocks
Auction inefficiencies
These are not traditional chart patterns—they are behavioral signatures of large traders.
5. Practical Microstructure Trading Strategies
(1) Liquidity Grab Reversal Strategy
Steps:
Identify swing high/low with visible liquidity.
Wait for price to spike into the zone aggressively.
Watch order flow:
If volume spikes but price fails to follow → absorption.
Enter toward the opposite direction.
Target nearest imbalance or range midpoint.
Edge: You ride the trapped traders’ pain.
(2) Imbalance Continuation Strategy
Look for strong one-sided delta.
Price creates a displacement (fast move).
Wait for shallow pullback into imbalance or fair value gap.
Enter with trend.
Exit before next liquidity pool.
Edge: You ride institutional execution algorithms.
(3) Absorption Detection Strategy
Price approaches support/resistance.
Aggressive buying/selling is absorbed by opposite passive orders.
Price struggles to break despite large market orders.
Enter opposite direction.
Edge: You detect hidden limit orders absorbing flow.
6. Why Microstructure Trading Works
Human and algorithmic behaviors repeat
Liquidity distribution is predictable
Markets must move to fill large orders
Retail traders consistently provide exploitable patterns
Market makers follow rules and risk constraints
Order flow cannot be completely hidden
Microstructure trading edge is structural and durable, unlike pattern-based edges which decay over time.
7. Final Thoughts
Microstructure trading offers a deep understanding of why price moves, not just where it moves.
By studying order flow, liquidity, market maker behavior, and execution mechanics, traders gain a sustainable edge rooted in the actual functioning of markets. It requires discipline, screen time, and precision, but the rewards are significant—superior timing, reduced risk, and higher accuracy.

Swing Trading Secrets1. The Secret of Trend Recognition
The biggest secret of profitable swing trading is identifying the dominant trend of the market. Most novices try to pick tops and bottoms, but professionals follow the path of least resistance. Trend recognition means:
Uptrend: Higher highs (HH) + higher lows (HL)
Downtrend: Lower highs (LH) + lower lows (LL)
Range: Price oscillates between support and resistance
Swing traders do not predict; they react. They align trades with the existing trend.
For example:
In an uptrend, they wait for pullbacks to key levels.
In a downtrend, they short the rallies.
In a range, they buy at support and sell at resistance.
Knowing the trend keeps traders on the right side of probability.
2. The Secret of Patience and Timing
Effective swing traders don’t enter randomly. They wait for specific conditions:
A. The market must be near a key level
Trendline touch
Moving average support (e.g., 20-EMA, 50-EMA)
Fibonacci retracement (38.2%, 50%, 61.8%)
Previous swing high/low
Volume clusters
B. Price must confirm the reversal or continuation
Patience allows the market to “show its hand” before entering.
The secret: wait for the candle close, not the candle forming.
Many traders lose because they enter too early. Timing matters more than direction.
3. The Secret of Multi-Timeframe Confluence
Professional swing traders use multiple timeframes:
Higher timeframe (HTF): 1-week or 1-day → Trend direction
Trading timeframe (TTF): 4-hour or 1-day → Entry zones
Lower timeframe (LTF): 1-hour or 15-min → Entry trigger refinement
This is called top-down analysis.
If the weekly chart shows an uptrend, the daily chart shows a pullback, and the 4-hour chart shows a bullish reversal pattern, the probability of success becomes extremely strong.
Multi-timeframe alignment is a powerful edge.
4. The Secret of High-Probability Patterns
Swing traders rely on chart patterns—not lots of patterns, just a handful of powerful ones that repeat reliably.
A. Continuation Patterns
Bull flag
Bear flag
Ascending triangle
Descending channel
These indicate that the trend is likely to continue.
B. Reversal Patterns
Double top / double bottom
Head and shoulders
Morning star / evening star
Hammer / shooting star
C. Breakout Patterns
Cup and handle
Range breakout
Consolidation breakout
Professional traders focus on clean patterns. If the pattern is messy, overlapping, or unclear, they move on.
5. The Secret of Volume Analysis
Price shows direction; volume shows conviction.
High-probability swing trades usually show:
High volume on breakouts
Low volume on pullbacks
High volume on reversal candles
Volume spikes at support/resistance
Volume acts like a lie detector. If a breakout happens on weak volume, it is often a trap.
Understanding volume helps traders avoid false signals.
6. The Secret of Risk Management
Most swing traders fail not because their strategy is bad but because their risk management is weak.
Professionals follow these golden rules:
Risk only 1–2% of capital per trade
Always place a stop-loss
Size positions based on volatility
Avoid overtrading
Never increase lot size after a loss
The greatest secret:
Protecting capital is more important than making profits.
A trader who avoids major losses can survive long enough to catch big winning swings.
7. The Secret of Support & Resistance Mastery
Swing traders obsess over support and resistance levels.
These levels act as price magnets and turning zones.
Key levels include:
Previous swing highs/lows
Daily, weekly, and monthly levels
Psychological numbers (100, 500, 1000)
Fibonacci retracement levels
Supply and demand zones
Swing traders wait for price reactions at these levels and only trade when confirmation appears.
8. The Secret of Using Indicators the Right Way
Professional swing traders use indicators as confirmation, not decision-making tools.
Popular indicator combinations:
A. Trend + Momentum
50-EMA or 200-EMA + RSI
20-EMA + MACD
B. Pullback Identification
Bollinger Bands
Stochastic RSI
C. Breakout Confirmation
Volume + MACD
RSI breakout
The secret:
Use indicators sparingly—2 or 3 maximum.
Clear charts produce clearer decisions.
9. The Secret of Trading Psychology
Swing trading rewards emotional control.
Professionals master:
A. Discipline
Follow the plan strictly.
B. Patience
Wait for the best setups.
C. Emotional Detachment
React to charts, not feelings.
D. Consistency
A few high-quality trades outperform dozens of random trades.
The less emotionally involved a trader is, the better they perform.
10. The Secret of Journaling Every Trade
This is one of the most underrated secrets.
A trade journal includes:
Entry and exit
Stop loss
Chart screenshots
Reason for trade
Mistakes
Market context
Journaling forces self-reflection and dramatically improves discipline and performance.
11. The Secret of Avoiding News-Based Noise
Swing traders avoid making decisions during:
Major economic announcements
Earnings reports
Policy changes
High volatility events
News can create unpredictable spikes that damage swing positions.
Professionals stay defensive during such periods.
12. The Secret of Letting Winners Run
One of the greatest swing trading secrets is knowing when not to exit early.
Successful traders:
Trail their stop-loss
Add positions in trend continuation
Hold until target zones are met
Small losses and big wins create long-term profitability.
Conclusion
Swing trading appears simple but demands mastery of multiple elements—trend recognition, timing, patience, volume interpretation, chart patterns, risk management, and psychology. The real secrets lie not in magical indicators but in disciplined execution and consistent behavior. When traders combine technical analysis with emotional control, they unlock the ability to capture market swings with confidence and accuracy.