Index Rebalancing Impact1. Why Index Rebalancing Happens
Indices are meant to represent a particular segment of the market. Over time, however:
Some companies grow while others shrink.
Market capitalizations change.
New leaders emerge in sectors.
Corporate actions (mergers, delistings, bankruptcies) occur.
Market liquidity and trading patterns evolve.
To maintain accuracy and credibility, index providers periodically evaluate components based on criteria such as:
Free-float market capitalization
Liquidity (trading volumes and turnover)
Sector representation
Corporate governance and regulatory compliance
Financial performance
Rebalancing ensures that the index remains aligned with the current structure and performance of the market.
2. How Rebalancing Works
The rebalancing process typically includes:
a. Announcement Phase
Index providers (NSE Indices, MSCI, FTSE Russell, S&P Dow Jones) release the final list of changes ahead of implementation, typically 2–4 weeks in advance. This gives institutional investors time to prepare.
b. Execution Day
On the official rebalancing date—often coinciding with the end of a quarter—index funds and ETFs must:
Buy stocks that are being added.
Sell stocks that are being removed.
Adjust weightings for stocks that remain but whose weight has changed.
This creates heightened trading activity, especially in the closing session (closing auction window).
c. Post-Rebalance Adjustment
Stocks may continue to adjust over the next few sessions as traders reposition and arbitrage strategies unwind.
3. Impact of Index Rebalancing
A. Price Impact on Stocks Being Added
When a stock is added to a major index:
Index funds buy the stock, leading to strong demand.
Prices often surge in the short term (known as the index inclusion effect).
Liquidity improves due to higher institutional participation.
Valuations may rise as more ETFs and passive funds accumulate holdings.
This effect is especially pronounced in indices with large passive following such as Nifty 50, S&P 500, or MSCI Emerging Markets.
However, this rise may be temporary—after the initial bounce, prices may stabilize or even decline as speculative traders exit.
B. Price Impact on Stocks Being Removed
Stocks removed from the index face:
Forced selling by index funds.
Immediate drop in price due to excess supply.
Reduced liquidity as passive funds exit.
Potential long-term decline in visibility and analyst coverage.
This is called the index deletion effect and can significantly hurt sentiment.
C. Impact on Index Levels
Rebalancing can change:
Sector weights (e.g., financials vs. IT)
Market-cap distribution
Risk and volatility characteristics
If high-weight stocks are added or removed, the impact on the overall index value can be sizeable.
D. Impact on Trading Volumes and Liquidity
Rebalancing typically results in:
Surge in trading volumes, especially in the last hour.
Increased delivery-based buying from funds.
Temporary widening of spreads due to volatility.
Short-term liquidity mismatches, particularly in mid-cap or small-cap rebalancing.
Index rebalancing days are often among the highest volume days of the year.
E. Impact on ETFs and Passive Funds
Passive funds must replicate the index exactly. Rebalancing forces:
High turnover in ETF portfolios.
Transaction costs, which may be passed on to investors.
Tracking error risks if markets are too volatile on rebalancing day.
This mechanical trading adds to price distortions.
F. Impact on Derivatives Markets
Index rebalancing impacts:
Nifty Futures and options due to hedging adjustments.
Volatility around expiry, especially if rebalancing coincides with derivatives expiry.
Straddle and strangle traders who position based on anticipated price swings.
Quant traders and arbitrage desks particularly exploit these windows.
G. Impact on Market Sentiment
Inclusion in a major index is often seen as:
A sign of strong fundamentals.
Higher institutional confidence.
Better corporate governance.
Removal, on the other hand:
Signals deterioration.
May reduce analyst and investor focus.
4. Who Benefits from Index Rebalancing?
i. Short-Term Traders
They profit from:
Price surges in stocks being added.
Price drops in stocks being removed.
Volatility spikes on execution day.
High-frequency traders (HFTs) and algorithmic funds dominate this space.
ii. Arbitrageurs
They exploit price inefficiencies created by:
Temporary demand-supply imbalance.
Tracking errors in ETFs.
Lag between announcement and execution.
iii. Corporates
Being added to an index increases visibility and prestige, potentially lowering cost of capital.
5. Risks and Challenges of Index Rebalancing
a. Excess Volatility
Prices swing sharply on announcement day and execution day, often unrelated to fundamentals.
b. Temporary Distortions
Stocks may become:
Overvalued after inclusion.
Undervalued after exclusion.
These distortions eventually normalize but create risk for traders.
c. Market Manipulation or Speculation
Some traders attempt to anticipate rebalancing outcomes, leading to front-running—buying in advance of the official announcement.
d. Overdependence on Indexing
As passive investing grows, mechanical buying/selling can destabilize markets during rebalances.
6. Global vs. Local Impacts
MSCI Rebalancing: impacts global flows in emerging markets including India.
Nifty/Sensex Rebalancing: impacts domestic flows.
Sectoral Index Rebalancing: affects specific industries.
Global indices often cause bigger price swings due to foreign fund flows.
Conclusion
Index rebalancing is a critical process in ensuring that stock market indices remain accurate and relevant. While it may seem purely technical, its impact is widespread—from stock price movements and liquidity changes to investor sentiment and fund flows. For traders, rebalancing events offer opportunities to capitalize on predictable demand patterns, but they also come with significant volatility-related risks. For long-term investors, while the day-to-day swings may not matter much, understanding how rebalancing works can help explain sudden price movements and shifts in market dynamics.
Overall, index rebalancing reinforces the efficiency and representativeness of financial markets, but it also introduces short-term inefficiencies that active participants can exploit.
Contains image

Nifty & Bank Nifty Options Trading1. Understanding Nifty & Bank Nifty as Option Underlyings
Nifty 50
A diversified index covering 13 sectors, representing India’s overall equity market.
Lower volatility compared to Bank Nifty
Stable and predictable movements
Preferred by positional traders and institutional hedgers
Bank Nifty
Composed of major banking stocks, highly sensitive to interest rates, RBI actions, liquidity flows, and global banking events.
Extremely high volatility
Fast intraday swings (frequently 300–700 points in a day)
Preferred by aggressive intraday option buyers and advanced traders
Liquidity in both instruments is extremely high, making them ideal for buying and selling options.
2. How Index Options Work
Option Types
You deal with two primary instruments:
Call Options (CE) – You profit when the index goes up
Put Options (PE) – You profit when the index goes down
Expiry Cycles
Both Nifty and Bank Nifty have:
Weekly expiry
Monthly expiry
Quarterly (some strikes)
Bank Nifty earlier had only weekly expiry on Thursday, but now expiries rotate due to SEBI’s rules. Nifty expires every Thursday as usual (unless it is a trading holiday).
Lot Sizes
Nifty lot size: typically 50 units
Bank Nifty lot size: typically 15 units
(These vary slightly during periodic revisions.)
3. Pricing Dynamics: Why Option Premiums Move
Option premiums are governed by:
i. Intrinsic Value
The real, quantifiable value.
CE intrinsic value = Spot price – Strike
PE intrinsic value = Strike – Spot
ii. Time Value (Theta)
Time value decreases as expiry comes closer.
Buyers get hurt by theta decay
Sellers benefit from theta decay
Bank Nifty has rapid intraday time decay, so sellers often dominate.
iii. Volatility (Vega)
Bank Nifty has higher volatility, meaning:
Higher premiums
Larger impact of news
Bigger risk and reward potential
iv. Delta
Measures how quickly the premium moves with respect to the index.
Example:
Delta 0.50 → Option moves 50% of index move
ATM options typically have delta ~0.5
Bank Nifty deltas shift faster due to rapid price movement.
4. Why Nifty & Bank Nifty Are Perfect for Options Trading
1. Deep liquidity
Instant order execution, tight spreads.
2. Weekly expiries
Fast premium decay → perfect for option sellers
Low cost → attractive for option buyers
3. High volatility (Bank Nifty)
Good for intraday scalping.
4. Large participation
FIIs, DIIs, proprietary desks, retail traders provide continuous order flow.
5. Common Trading Styles
A. Option Buying
Best for:
Trending markets
Breakout strategies
Intraday volatility plays
Pros:
Limited risk (premium paid)
High returns when market trends strongly
Cons:
Theta decay kills slow markets
Needs precise timing and direction
Bank Nifty is favored by buyers due to sudden moves.
B. Option Selling
Best for:
Range-bound markets
High probability income
Weekly expiry trading
Pros:
Higher win-rate
Time decay works in seller’s favor
Cons:
Potential for large losses if market trends
Must use hedging
Nifty is preferred by conservative sellers due to calmer moves.
Bank Nifty selling is profitable but demands skill and hedging discipline.
6. Key Strategies Used in Nifty & Bank Nifty
1. ATM/ITM Scalping (Intraday)
Used for 1–3 minute charts.
Buyers use fast entries on breakouts; sellers sell on reversals.
2. Straddles
Sell ATM CE + ATM PE.
Ideal when expecting low volatility.
Highly used on:
Expiry days
Fridays in monthly series
3. Strangles
Sell OTM CE + OTM PE.
Safer than straddles, with wider breathing space.
4. Credit Spreads
Bear call spread
Bull put spread
Controlled-risk selling strategies.
5. Iron Condor
For sideways markets with limited risk.
6. Directional Option Buying
Buyers typically look for:
Trendline breakouts
VWAP bounces
CPR (Central Pivot Range) breakout
Previous day high/low rejection
Bank Nifty gives the best directional follow-through.
7. Hedge-Based Positional Trades
Nifty traders often hold:
Bull Call Spreads
Bear Put Spreads
Calendar spreads
for monthly swings.
7. Expiry Day Dynamics
Expiry days (especially Thursday) are unique:
For Nifty & Bank Nifty
Accelerated theta decay
Frequent stop-hunt wicks
Sudden option premium collapse
Wild moves in the last 30 minutes
Scalpers thrive; beginners get trapped.
Option selling is usually profitable on expiry days, but only if:
You hedge
You manage risk
You avoid naked selling
Option buying works only during big directional moves or volatility spikes.
8. Risk Management (Non-Negotiable)
Without risk management, Nifty & Bank Nifty options will punish you. Follow these guidelines:
1. Use Stop-Loss Always
Options move insanely fast.
Bank Nifty can wipe out capital in minutes.
2. Never Sell Naked Options
Unhedged selling can cause large losses.
3. Control Position Size
Risk per trade should not exceed:
1–2% of capital (positional)
0.5–1% (intraday)
4. Avoid Overtrading
Chasing every move is a losing habit.
5. Understand News Events
Avoid trading near:
RBI policy
Budget
FOMC
Inflation data
Major geopolitical news
These events create sudden spikes.
9. Psychological Discipline
Options trading is 70% psychology.
Don’t chase runaway premiums
Don’t revenge trade
Don’t hold losing trades hoping they “come back”
Don’t keep adding to a losing position
If you can stay calm during fast index swings, you will trade better than most participants.
10. Final Practical Advice
I’ll be direct with you—Nifty & Bank Nifty options can help you grow your capital fast only if you learn structured trading. Otherwise, they can drain your account.
Here’s the right mindset:
Learn the basics thoroughly
Trade small and build skill
Specialize in one or two strategies
Stick to charts, not emotions
Think like a risk manager first, trader second
If you invest time in practice and discipline, index options can become your strongest trading edge.

Part 2 Ride The Big Moves Why Option Selling is Popular
Option selling is preferred because:
Time decay works in seller’s favour
Most options expire worthless
Sellers act like insurance companies
They earn small but consistent profits
But selling requires high capital and strict risk management.

Part 1 Ride The Big Moves Intraday Option Trading
Focus on momentum
Quick scalping
Uses volume, market structure
Greeks change rapidly
Risk high due to volatility
Positional Option Trading
Based on swing analysis
Uses spreads and hedged strategies
Requires understanding of Theta and Vega
Preferred for hedging and income generation

Part 2 Intraday Master Class1. Option Buying
Low capital
Limited risk
Unlimited profit
Requires strong movement
Suffers from time decay
2. Option Selling
High capital
Limited profit (premium)
High or unlimited risk
High probability trades
Theta decay works in favor

Nifty Intraday Analysis for 21st November 2025NSE:NIFTY
Index has resistance near 26400 – 26450 range and if index crosses and sustains above this level then may reach near 26650 – 26700 range.
Nifty has immediate support near 26000 – 25950 range and if this support is broken then index may tank near 25800 – 25750 range.

Part 1 Intraday Master Class 1. Directional Trading
Trader expects market to move up or down.
Buying Calls (bullish)
Buying Puts (bearish)
Selling Calls (bearish)
Selling Puts (bullish)
2. Non-Directional Trading
Trader expects market to remain in a range.
Straddles
Strangles
Iron Condor
Butterfly

Option Trading Strategies Put Buyer
Pays premium
Expects price to fall
Risk limited to premium
Profit increases as price goes down
Put Seller
Receives premium
Expects price to stay flat or go up
Risk large if market crashes

Gold Drops to 4050 – Testing a Key Support Zone📊 Market Overview:
Gold continues to fall toward the 4050 region as the US Dollar strengthens and US bond yields edge higher, reducing safe-haven demand. The market is now awaiting clearer signals from the Fed minutes and upcoming US economic data, causing bullish momentum to weaken.
________________________________________
📉 Technical Analysis:
Key Resistance: 4072 – 4085
Stronger Resistance: 4095 – 4105
Nearest Support: 4055
Stronger Support: 4045 – 4040
EMA09: Price is trading below the EMA09 on the H1 chart → short-term bearish signal.
Candlestick / Momentum:
H1 candles continue forming lower highs, showing sellers are in control. Volume is gradually decreasing, indicating the market is waiting for a reaction at the 4050 support zone.
________________________________________
📌 Outlook:
• Gold may continue to decline in the short term if price breaks below 4045.
• Conversely, if gold bounces strongly from 4050 with a clear reversal candle, price could retrace toward 4072–4085, and may extend to 4095 if buying pressure strengthens.
________________________________________
💡 Suggested Trading Strategy:
🔻 SELL XAU/USD at: 4082 – 4085
🎯 TP: 40 / 80 / 200 pips
❌ SL: 4088
🔺 BUY XAU/USD at: 4040 – 4037
🎯 TP: 40 / 80 / 200 pips
❌ SL: 4035

PCR Trading Strategies Call Buyer
Pays premium
Expects price to go up
Risk limited to premium
Profit unlimited
Call Seller
Receives premium
Expects price to stay flat or go down
Profit limited to premium
Risk potentially unlimited

Advanced Candlestick Pattern AnalysisTypes of Candlestick Patterns
Candlestick patterns are broadly categorized into:
Single-candle patterns
Double-candle patterns
Triple-candle patterns
Complex multi-candle structures

Advanced / Premium-Level PatternsWhy Chart Patterns Work Universally
Human psychology doesn’t change.
Market cycles repeat.
Patterns reflect economic behaviour.
Institutional buying/selling creates recognizable structures.
Liquidity zones attract predictable reactions.

In about an hour, UK Retail Sales data will be releasedIn about an hour, UK Retail Sales data will be released.
We’ve analyzed every report since 2022 to build this insight-packed dashboard showing how GBPUSD typically reacts within 4 hours after the print:
📊 Historical Breakdown (32 events total):
🔹 Bullish trend: 46.9% → 15 events
🔸 Bearish trend: 53.1% → 17 events
📉 Average bearish move: -30.35 pips
📈 Average bullish move: +22.13 pips
No crystal ball — just statistics and probabilities.

Rate Hikes & Inflation: Understanding the Impact1. Why Central Banks Hike Rates
Inflation occurs when prices of goods and services rise over time. While moderate inflation is considered normal for a growing economy, high inflation reduces purchasing power, distorts financial planning, and hurts savings.
Central banks monitor inflation targets—usually around 2% for developed economies and 4%±2% for developing economies like India.
When inflation rises above these targets, central banks raise rates to:
Reduce excess money supply
Cool off consumer and business spending
Control credit expansion
Anchor inflation expectations
Higher interest rates make loans more expensive, slowing down economic activity and thereby reducing inflationary pressure.
2. The Mechanism: How Rate Hikes Curb Inflation
Rate hikes impact the economy through multiple channels:
A. Borrowing Becomes Expensive
When central banks raise policy rates, commercial banks increase:
Home loan interest rates
Personal loan rates
Corporate borrowing rates
Credit card rates
As borrowing becomes costlier, households reduce spending on big-ticket items like cars, housing, and consumer durables. Businesses delay expansion, hiring, and capital expenditure.
This drop in demand helps bring prices down.
B. Savings Become Attractive
Higher interest rates usually lead to:
Higher fixed deposit returns
Better bond yields
Increased returns on savings instruments
When saving becomes more rewarding, people prefer to save rather than spend. This lowers consumption demand, putting downward pressure on inflation.
C. Currency Strengthens
Higher rates attract foreign investors looking for higher yields. This leads to an inflow of foreign capital, which strengthens the local currency.
A stronger currency:
Lowers import costs
Reduces prices of foreign goods like oil, electronics, and machinery
Helps reduce inflation, especially in import-dependent countries
For example, if the Indian rupee strengthens due to RBI rate hikes, India’s import bill for crude oil decreases, helping control inflation.
D. Slows Down Asset Price Growth
Rate hikes cool off excessive speculation in the:
Stock market
Real estate market
Bond market
Crypto market
When borrowing becomes expensive and liquidity tightens, speculative investments reduce. This slows the rise of asset prices, indirectly containing inflation.
3. Short-Term vs. Long-Term Effects
Rate hikes do not bring inflation down immediately. The effects appear gradually.
Short-Term Effects
Borrowing costs rise immediately
Stock markets often correct
Bond yields increase
Consumer confidence drops
Businesses slow hiring and investment
However, prices of essentials like food and fuel may not drop instantly because they depend on other factors like supply chain stability, global prices, and weather conditions.
Long-Term Effects
Once demand slows and money supply contracts, inflation begins to ease. Expectations of future inflation stabilize, and the economy moves towards equilibrium.
4. When Rate Hikes Can Hurt the Economy
While rate hikes help control inflation, excessive or aggressive tightening can harm economic growth.
A. Risk of Recession
If rates rise too quickly:
Companies may cut jobs
Consumers reduce spending severely
Businesses face financial stress
GDP growth slows
This may trigger a recession, especially if inflation remains stubborn even after multiple hikes.
B. Higher Loan EMIs for Households
Home loan borrowers especially feel the pinch. A 1% rate hike can significantly increase EMI burdens, reducing disposable income and affecting family budgets.
C. Stress on Small Businesses
Small and medium-sized enterprises (SMEs) rely heavily on loans. Higher borrowing costs:
Reduce profit margins
Discourage expansion
Increase risk of defaults
This can slow entrepreneurship and job creation.
D. Impact on Government Borrowing
Higher interest rates raise the government’s borrowing costs, increasing fiscal pressure. This can force governments to reduce spending on infrastructure, subsidies, and welfare programs.
5. The Balance: Why Central Banks Must Act Carefully
Central banks must strike a delicate balance between:
Controlling inflation
Preserving economic growth
Raising rates too slowly may let inflation spiral. Raising rates too aggressively may cause a recession.
This is why central banks rely on:
Inflation data
Employment data
GDP growth indicators
Global commodity prices
Financial stability metrics
The goal is a soft landing—reducing inflation without damaging economic growth.
6. Real-World Examples
A. United States (2022–2024)
The Federal Reserve raised rates aggressively to control post-pandemic inflation. The hikes slowed the housing market, reduced consumer demand, and eventually brought inflation closer to target.
B. India (2022–2023)
RBI raised the repo rate multiple times to control inflation driven by global supply shocks and rising commodity prices. The hikes stabilized the rupee, improved capital flows, and helped cool inflation.
C. Europe (2022–2023)
The ECB raised rates after years of ultra-low interest policies to fight soaring energy-driven inflation. While inflation eased, growth slowed sharply, pushing some nations toward recession.
7. When Rate Hikes Don’t Work
Sometimes inflation is not caused by excess demand but by supply shocks, such as:
War-driven oil price spikes
Global shipping disruptions
Crop failures due to weather
Shortage of raw materials
In such cases, rate hikes alone cannot solve inflation and may even worsen growth.
Central banks must then use a mix of:
Fiscal policy support
Supply chain improvements
Targeted subsidies
Import adjustments
8. Conclusion
Rate hikes are one of the most powerful tools central banks use to control inflation. By increasing borrowing costs, encouraging savings, strengthening the currency, and reducing speculative activity, rate hikes effectively cool down aggregate demand in the economy.
However, they must be implemented with caution. While necessary to tame inflation, excessive tightening can slow economic growth, increase unemployment, and stress both households and businesses. The true art of monetary policy lies in balancing inflation control with sustainable economic growth.
In a world of interconnected economies, global commodity trends, geopolitical tensions, and financial market dynamics all influence how effective rate hikes can be. Therefore, successful inflation management requires a mix of monetary policy, government action, and market stability.
Intraday Scalping Tips1. Trade Only High-Volume Stocks, Indices, or Currency Pairs
Liquidity is the lifeline of scalping. You need instruments with tight spreads, fast order execution, and consistent movement.
Why High Volume Matters
Ensures quick entry and exit.
Reduces slippage during volatile periods.
Offers clear price patterns and clean breakouts.
Allows placing large position sizes without affecting price.
Popular choices include:
Indices: Nifty 50, Bank Nifty, S&P 500
Stocks: Reliance, TCS, HDFC Bank, Tesla (in US market)
Forex: EUR/USD, GBP/USD, USD/JPY
Commodities: Gold, Crude Oil
Avoid low-volume or penny stocks — they often trigger false breakouts.
2. Use the Right Time Frames for Scalping
Successful scalpers combine multiple time frames to confirm entries and exits.
Recommended Setup
1-Minute Chart: Entry timing and trade execution
5-Minute Chart: Short-term trend identification
15-Minute Chart: Market structure or bias
Daily Chart: Major support and resistance
How It Works
If the daily and 15-minute chart show bullish bias, and the 1-minute chart forms a breakout pattern, the probability of success increases. Multi-time-frame confirmation reduces false signals and emotional trades.
3. Use Key Indicators with Precision (But Don’t Overload)
Scalping requires fast decisions, so keep indicators minimal. The best combinations are:
a) Moving Averages (MA)
EMA 9 & EMA 21: Identify short-term momentum
EMA 9 crossing above EMA 21 = bullish momentum
EMA 9 crossing below EMA 21 = bearish momentum
b) VWAP (Volume Weighted Average Price)
VWAP acts as an intraday support/resistance for institutions.
Price above VWAP = bullish environment
Price below VWAP = bearish environment
c) RSI (Relative Strength Index)
Use RSI with 70/30 or 80/20 levels to spot exhaustion.
d) Supertrend
Helps identify direction and allows trailing stops.
Tip: Combine VWAP + EMA + RSI for powerful scalp entries.
4. Master Key Scalping Strategies
a) Breakout Scalping
Trade breakouts of:
Previous day high/low
Intraday supply/demand zones
Round numbers (e.g., 100, 500, 1000 levels)
Look for volume confirmation to avoid traps.
b) Pullback Scalping
Enter when price returns to:
EMA 9/21
VWAP
Trendline
These pullbacks offer low-risk entries.
c) Range Scalping
When the market is sideways:
Buy at range support
Sell at range resistance
Perfect for low-volatility phases.
d) Quick News-Based Scalping
Scalpers take advantage of sudden volatility during events like:
FOMC meetings
RBI policy announcements
Non-farm payroll
Quarterly earnings
This requires high experience and fast execution — beginners should avoid high-volatility news setups.
5. Maintain Strict Risk Management
Scalping involves multiple trades, so losses must be extremely small.
Golden Rules
Risk 0.5%–1% per trade
Use tight stop losses (0.3%–0.5% of price)
Target 1:1 or 2:1 risk-reward
Never average loss-making trades
Why Stop Loss Is Mandatory
Without strict SL, one wrong trade can eliminate 10 successful scalps.
6. Use Pre-Defined Entry and Exit Rules
Emotion has no place in scalping. You must follow clear rules:
Enter only after a candle closes over key levels
Avoid chasing fast-moving candles
Book profit quickly if momentum slows
Exit immediately when your stop is hit
Consistency comes from mechanical execution.
7. Focus on Market Timing
Scalping works best when volatility and liquidity are highest.
Best Times to Scalp
Opening hour: First 30–45 minutes
Mid-session: Breakouts or trend continuation
Power hour: Last 1 hour of market
Avoid lunch hours — the market becomes slow and choppy.
8. Watch the Order Flow (Advanced Tip)
Order flow tools like:
Level 2
Depth of market (DOM)
Time & Sales (Tape reading)
Help identify:
Hidden buying/selling pressure
Fake breakouts
Liquidity zones
Scalpers use order flow to time ultra-precise entries.
9. Keep Your Mind Calm and Avoid Overtrading
Scalping demands high focus. Overtrading leads to impulsive decisions.
Rules to Avoid Burnout
Take breaks after every 3–5 trades
Limit to a maximum of 10–15 trades per day
Avoid revenge trading
Stick to your strategy, not emotions
Mental exhaustion is one of the biggest enemies for scalpers.
10. Practice on Demo Before Going Live
Scalping is not suitable for complete beginners.
A demo account helps you:
Understand order execution
Practice SL placement
Backtest fast setups
Improve timing
Once you achieve consistency, switch to live trading with small capital.
11. Keep a Trade Journal
A trading journal helps identify:
Most profitable strategies
Common mistakes
Best market conditions for your style
Winning and losing streak patterns
Document:
Entry reason
Exit reason
Chart screenshots
Emotions during the trade
Journaling sharpens discipline and reduces repeat mistakes.
12. Use a Reliable Broker and Fast Internet
Since scalping is execution-sensitive:
Use a low-latency trading platform
Ensure low spreads and commissions
Maintain high-speed stable internet
Disable unnecessary background apps during trading
Execution quality directly affects profitability.
13. Stick to One or Two Assets Only
Avoid switching between multiple stocks or pairs.
By focusing on one instrument:
You understand its behavior
You predict its reaction to levels
You avoid confusion
You improve accuracy
Scalpers trade familiarity, not variety.
Conclusion
Intraday scalping is a powerful trading style, but it requires discipline, precision, and emotional control. By choosing liquid instruments, using proper indicators, applying strict risk management, and practicing high-probability strategies, scalpers can achieve consistent intraday profits. Follow the technical rules, stay calm, avoid overtrading, and maintain a journal to track progress. Scalping rewards disciplined traders, not emotional ones.
ESG and Carbon Credit Trading1. Introduction to ESG
ESG refers to a set of standards used to evaluate a company’s sustainability performance and ethical impact. It goes beyond traditional financial metrics and evaluates how responsibly a company operates.
Components of ESG
1. Environmental
Focuses on how a company impacts the planet.
Key indicators include:
Carbon emissions
Energy efficiency
Renewable energy usage
Waste and pollution management
Water conservation
Biodiversity protection
2. Social
Analyzes how a company manages relationships with people, culture, and society.
Key indicators include:
Employee welfare and diversity
Human rights
Community development
Customer data privacy
Workplace safety
Supply chain ethics
3. Governance
Evaluates how a company is governed, including its leadership structure.
Key indicators include:
Board diversity
Executive compensation
Shareholder rights
Transparency and reporting
Anti-corruption measures
Strong governance ensures smooth business operations and builds investor trust.
2. Importance of ESG in Modern Business and Investment
Institutional investors, banks, asset managers, and regulators increasingly prioritize ESG factors to evaluate long-term risk, sustainability, and ethical behavior.
Key reasons for ESG adoption
1. Investor Demand
Global investors prefer companies with:
Sustainable long-term strategies
Lower environmental and regulatory risks
Ethical practices and transparency
ESG-compliant firms often attract more capital and have stronger market valuations.
2. Regulatory Pressure
Governments worldwide are:
Imposing emission rules
Mandating ESG disclosures
Encouraging green investments
For example, Europe’s SFDR, India’s BRSR norms, and the U.S. SEC climate disclosure proposals are major steps.
3. Business Competitiveness
Companies that adopt ESG practices achieve:
Cost savings (through energy efficiency)
Lower legal and compliance risks
Better brand reputation
Higher customer loyalty
4. Risk Mitigation
Ignoring ESG exposes companies to risks such as:
Climate-related disruptions
Regulatory penalties
Social backlash
Poor governance scandals
Thus, ESG acts like a shield against long-term uncertainties.
3. What Are Carbon Credits?
Carbon credits are tradable certificates that represent the right to emit one metric ton of carbon dioxide or its equivalent (CO₂e). These credits are generated through projects that reduce, capture, or avoid greenhouse gas emissions.
Types of Carbon Credits
1. Compliance Credits
Used by industries under mandatory government regulations such as:
EU Emission Trading System
California Cap-and-Trade
China’s national carbon market
2. Voluntary Carbon Credits
Purchased by companies voluntarily to offset emissions and meet sustainability goals.
Companies may buy credits to reach:
Carbon neutrality
Net-zero goals
ESG compliance
4. How Carbon Credit Trading Works
Carbon credit trading operates on market principles where supply and demand influence price. The trading systems can be broadly categorized into Cap-and-Trade and Voluntary Markets.
1. Cap-and-Trade Mechanism (Compliance Market)
This is the most widely used carbon trading system globally.
How it works:
Government sets a cap or limit on total emissions allowed for industries.
Companies receive or buy emission allowances.
If a company emits less than its quota, it can sell the excess credits.
If it emits more, it must buy credits to offset the difference.
This economically encourages companies to adopt cleaner technologies.
2. Voluntary Carbon Market (VCM)
Here, companies voluntarily purchase carbon credits.
Sources of voluntary credits include:
Reforestation projects
Renewable energy installations
Methane capture
Carbon sequestration in soil
Waste recycling and reduction
These credits are bought to meet corporate commitments or to enhance ESG scores.
5. Why Companies Buy Carbon Credits
Carbon credits serve multiple strategic purposes:
1. Achieving Carbon Neutrality
Companies offset their greenhouse gas emissions to become carbon neutral.
2. Meeting Regulatory Requirements
In mandatory markets, businesses must comply with government caps.
3. Enhancing ESG Scores
A strong environmental performance boosts a company’s ESG rating, attracting:
Investors
Global customers
Financial incentives
4. Avoiding Penalties
Failing to offset emissions often leads to regulatory fines.
6. Economic and Market Impact of Carbon Credit Trading
Carbon markets create new financial opportunities while combating climate change.
Key Market Impacts
1. Revenue Generation
Governments earn through auctions of emission permits.
2. Support for Green Projects
Carbon offset projects receive funding from credit sales.
3. Cost Efficiency for Businesses
Buying credits is often cheaper than modernizing operations.
4. Market Liquidity
Carbon credits are traded on exchanges, improving liquidity and price discovery.
7. Integration of ESG with Carbon Markets
Modern ESG ratings include factors related to carbon footprint, net-zero plans, and participation in carbon markets.
How ESG and Carbon Trading Intersect
Environmental Score
Emissions reduction and carbon offsetting directly raise the E score.
Investor Confidence
Companies participating in regulated carbon markets are viewed as future-ready.
Corporate Strategy Alignment
ESG-driven firms adopt internal carbon pricing, invest in carbon offset projects, and integrate climate risk into long-term business planning.
Financial Products
ESG funds increasingly include companies with strong carbon mitigation strategies.
8. Benefits and Challenges of Carbon Credit Trading
Benefits
Encourages emission reduction
Funds environmental projects
Creates new financial markets
Helps companies meet sustainability goals
Supports global climate agreements
Challenges
Price volatility
Lack of standardization
Risk of “greenwashing”
Fraudulent or low-quality credits
Verification challenges in voluntary markets
These challenges highlight the need for strong regulation, transparency, and reliable auditing systems.
9. Future of ESG and Carbon Credit Trading
Both ESG and carbon markets are expected to grow significantly due to:
Global climate commitments (Paris Agreement)
Rise in sustainability-driven investments
Increasing corporate carbon-neutral pledges
Technological innovations in monitoring and reporting
Artificial intelligence, satellite data, and blockchain technology are also making carbon markets more trustworthy and efficient.
In the future:
Carbon credits may become more mainstream financial instruments.
ESG ratings will become stricter and more transparent.
Companies with poor ESG scores may face limited access to capital.
Carbon pricing may influence global trade and supply chains.
Conclusion
ESG and carbon credit trading together represent a major transition toward a sustainable global economy. ESG provides the framework for responsible corporate behavior, while carbon credit trading offers a market-based mechanism for reducing greenhouse gas emissions. As investors, regulators, and corporations increasingly prioritize sustainability, the integration of ESG principles with carbon markets is becoming essential for long-term growth, risk management, and global climate action.
Both concepts are not just regulatory requirements—they are fundamental pillars of the future economic system, shaping how businesses will operate and compete in the coming decades.

Part 2 Master Candle Stick PatternsWhat Drives Option Prices Intraday?
Several factors affect option prices every minute:
1. Underlying price movement (Delta)
2. IV changes (Vega)
3. Time decay (Theta)
4. Liquidity
5. Market sentiment
6. Hedge adjustments by institutions
Understanding these micro-dynamics helps you avoid false breakouts.

Part 1 Master Candle Stick Patterns Why Option Buyers Lose More Frequently
Option buyers lose mainly due to:
Time decay
Wrong direction
Lack of momentum
Low probability bets
Emotional trading
Most buyers attempt lottery-like trades in weekly expiries.
This is why professional traders prefer selling strategies.

Divergence Secrets Option Greeks – The Heart of Option Pricing
Option Greeks mathematically measure how an option should behave.
1. Delta
Measures direction sensitivity.
Call delta: 0 to 1
Put delta: –1 to 0
2. Gamma
Measures change in delta.
High near expiry.
3. Theta
Time decay rate.
4. Vega
Sensitivity to volatility.
5. Rho
Interest rate impact (lowest impact).
These Greeks help traders build stable and predictable strategies.

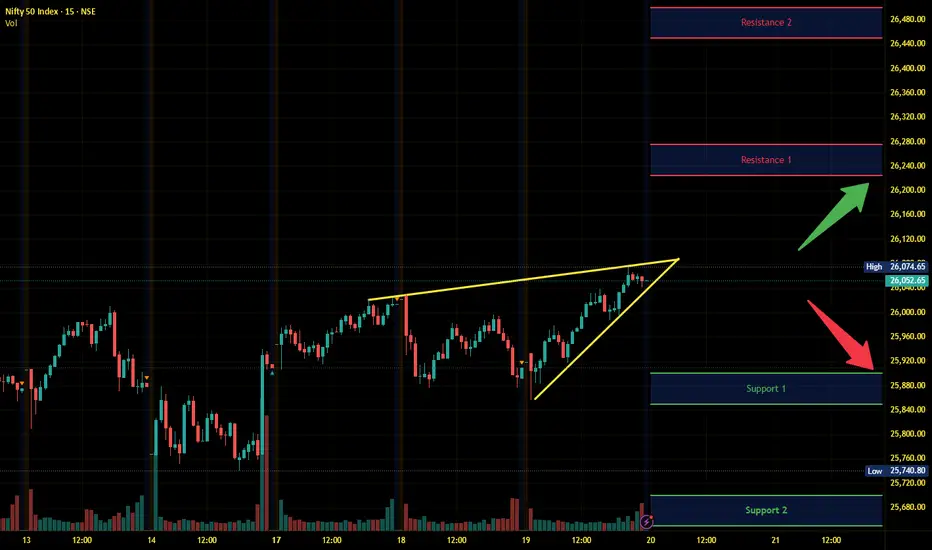
Nifty Intraday Analysis for 20th November 2025NSE:NIFTY
Index has resistance near 26225 – 26275 range and if index crosses and sustains above this level then may reach near 26450 – 26500 range.
Nifty has immediate support near 25900 – 25850 range and if this support is broken then index may tank near 25700 – 25650 range.
Part 2 Support and ResistanceOption Premium Breakdown – Intrinsic vs Extrinsic
1. Intrinsic Value
Actual value if exercised TODAY.
For Call: Spot – Strike (if positive)
For Put: Strike – Spot (if positive)
2. Extrinsic (Time + Volatility)
Value due to time left + expectations.
This is where traders either make or lose money.

Part 1 Support and ResistanceBuyer vs Seller (Writer): The Battle
Every option trade has two sides:
Option Buyer Option Seller
Pays premium Receives premium
Limited loss Limited profit
Unlimited profit Unlimited risk (if naked)
Needs movement Makes money without movement
Option buyers need direction + momentum.
Option sellers need time + stability.
About 70–80% of options expire worthless, which is why many traders prefer selling over buying.

Part 12 Trading Master Class With ExpertsMoneyness of Options
Options are classified as:
In the Money (ITM)
At the Money (ATM)
Out of the Money (OTM)
Call Options
ITM: Stock price > Strike price
ATM: Stock price = Strike price
OTM: Stock price < Strike price
Put Options
ITM: Stock price < Strike price
ATM: Stock price = Strike price
OTM: Stock price > Strike price
Moneyness affects premium value, risk, and probability of profit.
